

Abstract
Rationale
It is generally presumed that the Cystic Fibrosis (CF) population is relatively homogeneous, and predominantly of European origin. The complex ethnic make-up observed in the CF patients collected by the North American CF Modifier Gene Consortium has brought this assumption into question, and suggested the potential for population substructure in the three CF study samples collected from North America. It is well appreciated that population substructure can result in spurious genetic associations.
Objectives
To understand the ethnic composition of the North American CF population, and to assess the need for population structure adjustment in genetic association studies with North American CF patients.
Methods
Genome-wide single-nucleotide polymorphisms on 3076 unrelated North American CF patients were used to perform population structure analyses. We compared self-reported ethnicity to genotype-inferred ancestry, and also examined whether geographic distribution and CFTR mutation type could explain the structure observed.
Main Results
Although largely Caucasian, our analyses identified a considerable number of CF patients with admixed African-Caucasian, Mexican-Caucasian and Indian-Caucasian ancestries. Population substructure was present and comparable across the three studies of the consortium. Neither geographic distribution nor mutation type explained the population structure.
Conclusion
Given the ethnic diversity of the North American CF population, it is essential to carefully detect, estimate and adjust for population substructure to guard against potential spurious findings in CF genetic association studies. Other Mendelian diseases that are presumed to predominantly affect single ethnic groups may also benefit from careful analysis of population structure.
Keywords: ethnicity, principal component analysis, population substructure, population stratification
Introduction
Cystic fibrosis (CF) is a recessive monogenic disease caused by mutations in the Cystic Fibrosis Transmembrane Regulator (CFTR) gene. Despite this simple Mendelian inheritance pattern, there is substantial variability among CF patients in their severity of lung disease and other phenotypes, even among CF patients carrying the same CFTR mutations (1); thus environmental and non-CFTR genetic factors must contribute to overall disease variability. Genetic factors account for 54–86% of the overall variability in lung disease (2), pointing to a substantial role for genetic modifiers in CF lung disease, independent of CFTR genotype.
To identify genetic modifiers that contribute to CF disease variability, the North American CF Modifier Gene Consortium was established to conduct a genome-wide association study (GWAS) genotyping 610,000 single-nucleotide polymorphisms (SNPs) and CNV probes among 3076 CF patients and 665 parents.
Genome-wide association studies are a powerful tool to identify common variants associated with disease. They assume that a common founder has given rise to a disease-associated mutation such that these methods can capitalize on linkage disequilibrium (LD) between the mutation and nearby SNPs for localization. However, in a sample of ethnically diverse individuals whose disease severity may not be accounted for by a common founder, the specific pattern of marker alleles surrounding and in LD with a causal mutation may vary, hindering the potential for identification. In addition, population structure can lead to spurious association results due to differential allele frequencies and phenotypic differences in sub-populations in the sample. Therefore, care must be taken during analysis of GWAS data to understand ethnic diversity in a sample; if heterogeneity is present it must be considered in an association analysis.
Since CF is considered to be a disease predominantly of European origin, it has been presumed that the CF population is relatively homogenous. However, the diverse, complex and dynamic ethnic make-up observed in the subjects collected by the North American CF Modifier Gene Consortium has required that we take a closer look at this assumption. Here we aim to (I) use our genome-wide genotype data on 3,076 North American CF patients to better understand the ethnic composition of the North American CF population; and (II) assess the need for population structure adjustment in association studies of North American CF patients.
A variety of statistical software packages have been developed to detect and correct for population structure, and they are generally based on one of three methods: structured association (3), genomic control (4) and principal component analysis (5). Here we use the SMARTPCA program in the EIGENSTRAT package (5, 6), which implements a principal component approach to analyze population structure in the North American CF population.
Materials and Methods
Subjects
Subjects for this study were collected by the North American CF Modifier Gene Consortium, which consists of three separate CF research groups (Table 1): (I) The Canadian Cystic Fibrosis Genetic Modifier Study (Canadian population study), a population based sample consisting of 75% of the total Canadian CF population; (II) the University of North Carolina/Case Western Reserve University Case-Control Study, a sample ascertained on the phenotype of extremes of lung disease (7) (US extremes of phenotype study); and (III) the US CF Twin and Sibling Study (2), a family-based study with CF twins, siblings and parents (US sibling study).
Table 1.
Summary of samples collected by the Canadian population study, the US extremes of phenotype study, and the US sibling study.
| Study design | Genotyped subjects | Subjects included in the population structure analysis | |
|---|---|---|---|
| Canadian Population Study | Population-based, unrelated individuals | 1505 | 1437 unrelated, pancreatic insufficient CF patients |
| US extremes of phenotype study | Unrelated individuals (a) with extreme values of lung function, (b) homozygous for F508del | 1203 | 1203 unrelated, pancreatic insufficient CF patients |
| US sibling study | Families with CF twins or siblings | 1131 CF children, 665 parents | 436 unrelated, pancreatic insufficient CF children |
Canadian Population Study
In this study, 1,437 unrelated Canadian pancreatic insufficient (PI) CF patients were recruited from 33 specialized CF clinics across Canada. Exocrine pancreatic function status was determined by genetic mutations (8). PI status was assigned if both CFTR mutations were known to be associated with pancreatic insufficiency (9); otherwise, the subject was categorized as pancreatic sufficient and excluded from analysis. The study sample was representative of the overall Canadian PI CF population (see Table 2A for a summary of the geographic distribution of the subjects). Ethnicity data collected was broadly categorized as ‘Caucasian’, ‘Asian’, ‘African’, ‘Other’ and ‘Mixed’, and was based on self-report.
Table 2.
Geographic distribution of subjects included in the population structure analysis. Subjects from the Canadian population study, the US extremes of phenotype study, and the US sibling study are summarized in table A, B and C, respectively.
| Province | AB | BC | MB | NB | NL | NS | ON | QC | SK |
|---|---|---|---|---|---|---|---|---|---|
| Frequency | 209 | 178 | 46 | 13 | 40 | 110 | 491 | 314 | 36 |
| A | |||||||||
| State | AL | AZ | CA | CO | FL | GA | IL | IN | IA | MD | MA |
|---|---|---|---|---|---|---|---|---|---|---|---|
| Frequency | 18 | 3 | 99 | 31 | 26 | 47 | 9 | 32 | 15 | 30 | 24 |
| MI | MN | MS | MO | NE | NH | NJ | NM | NY | NC | OH | |
| 49 | 48 | 6 | 42 | 12 | 15 | 16 | 9 | 55 | 179 | 165 | |
| PA | RI | SC | TN | TX | UT | VA | WA | WV | WI | ||
| 72 | 13 | 22 | 38 | 17 | 23 | 20 | 42 | 22 | 4 | ||
| B | |||||||||||
| State | AK | AL | AR | AZ | CA | CO | CT | DC | DE | FL | FO | GA |
|---|---|---|---|---|---|---|---|---|---|---|---|---|
| Frequency | 1 | 5 | 1 | 4 | 30 | 8 | 1 | 1 | 1 | 9 | 2 | 20 |
| IA | ID | IL | IN | KS | KY | LA | MA | MD | ME | MI | MN | |
| 9 | 6 | 24 | 22 | 10 | 4 | 2 | 15 | 16 | 2 | 12 | 19 | |
| MO | MS | MT | NC | ND | NE | NH | NH | NM | NY | OH | OK | |
| 9 | 5 | 5 | 11 | 1 | 3 | 2 | 13 | 5 | 34 | 33 | 1 | |
| OR | PA | RI | SC | TX | UT | VA | VT | WA | WI | WV | ||
| 1 | 26 | 1 | 9 | 16 | 15 | 17 | 2 | 8 | 10 | 6 | ||
| C | ||||||||||||
US Extremes of Phenotype Study
The extremes of phenotype study collected and genotyped 1,203 unrelated CF patients who (a) were homozygous for F508del, the most common CFTR mutation and (b) had lung function at the extremes of the population distribution. With respect to self-reported ethnicity, 1,162 (97%) out of the 1203 subjects categorized themselves as ‘Caucasian’; whereas 41 subjects reported they were ‘Hispanic’ (N= 18), ‘African American’ (N=12), ‘Asian’ (N=1) and of ‘Other’ ethnicity (N=10) (specific composition usually defined by patients). The geographic distribution of these subjects is shown in Table 2B.
US Sibling Study
The sibling study consisted of 1,796 genotyped CF children and parents from 559 unique families. Selection of twins or siblings resulted in a milder and younger sample. We included 436 unrelated PI CF children from this sample in our population structure analysis. The sibling study collected more detailed information on self-reported ethnicity, including the categories of ‘Caucasian’, ‘Hispanic’, ‘African American’, ‘Asian’ and ‘ Middle Eastern’. For admixed subjects, the ethnic backgrounds of the parents were recorded in a composite manner as follows: ‘African, Caucasian’, ‘Aleut, Caucasian’, ‘Asian, Caucasian’, ‘Hispanic, Caucasian’, ‘Middle Eastern, Caucasian’ and ‘Native American, Caucasian’. The geographic distribution of the 436 subjects is summarized in Table 2C.
Genotype and Quality Control
To ensure data quality and comparability, the three study samples within the North American CF Modifier Gene Consortium were genotyped simultaneously on the same platform, using the Illumina Infinium 610K array (610,000 SNPs and CNV probes) at McGill University and the Genome Quebec Innovation Centre.
Quality control procedures were carried out simultaneously at a single centre using a common set of rules and thresholds on all three study samples. Subjects with high missing genotype rate (> 10%) were removed, and identity by descent (IBD) statistics were calculated using PLINK (10) to detect and remove cryptically related subjects. We excluded SNPs with high missing rate (> 10%), and SNPs that departed from Hardy-Weinberg equilibrium (p < 0.001), or had low minor allele frequency (< 0.01) were flagged. The number of SNPs remaining after quality control procedures was 556,445.
Analysis of Population Structure
Population structure analysis of the North American CF population was performed using the SMARTPCA program in the EIGENSTRAT. SNPs with low minor allele frequency (< 0.05) were excluded from principal component analyses. To reduce the LD between SNPs, PLINK was used to conduct SNP-pruning: we considered a sliding window of 1500 SNPs and calculated r2 between each pair of SNPs in that window; one of a pair of SNPs was removed if the pairwise r2 was greater than 0.2, then the window shifted 100 SNPs forward and the procedure was repeated. We used three-dimensional scatter plots of the top 3 significant principal components inferred by SMARTPCA to visualize population structure. Self-reported ethnicity was compared to population structure inferred by principal component analysis in all three study samples. Geographic distribution and CFTR mutation type (homozygous for F508del or not) of the samples were also examined in the Canadian population study to determine whether these factors coincide with population substructure. In particular, logistic regression analysis was performed to assess the association between mutation type and the top 50 principal components inferred by SMARTPCA.
Seeding with HapMap
To understand the ethnic make-up of the North American CF population, we utilized data from the International HapMap Project (http://hapmap.ncbi.nlm.nih.gov), which provides genotype data on individuals collected from 11 populations with known ancestral background. We seeded the data derived from the North American CF population with 7 selected populations from the HapMap phase 3 draft 1 release (HapMap3), including Utah residents with Northern and Western European ancestry from the CEPH collection, USA (CEPH Caucasian); Han Chinese in Beijing, China (Han Chinese); Japanese in Tokyo, Japan (Japanese); Yoruba in Ibadan, Nigeria (Yoruba); African ancestry in Southwest USA (African American); Gujarati Indians in Houston, Texas (Gujarati Indian); and Mexican ancestry in Los Angeles, California (Mexican) (11). Only SNPs that were common among the Illumina Infinium 610K array and all HapMap3 populations were selected (N = 424,139) for analysis. Discordant SNP-strands were identified and corrected using PLINK. Additional quality control including removal of cryptically related subjects and LD-pruning were performed on the combined data prior to principal component analysis. Because principal component analysis is sensitive to inclusion of related individuals, we included only HapMap3 founders in the analysis (Table 3). IBD statistics and inbreeding coefficients were estimated in the HapMap3 founders to guard against cryptic relatedness.
Table 3.
Summary of HapMap3 samples that were included in the population structure analysis; only HapMap3 founders were included.
| HapMap3 Population | African American | CEPH Caucasian | Han Chinese | Gujarati Indian | Japanese | Mexican | Yoruba |
|---|---|---|---|---|---|---|---|
| Number of samples | 42 | 109 | 82 | 83 | 82 | 45 | 108 |
We analyzed each of the three study samples separately for population structure, and then together, to ensure that the ethnic diversity and the degree of admixture were comparable. Tracy-Widom statistics and p-values were calculated using EIGENSTRAT to assess the number of statistically significant principal components. Scree plots (12) were also constructed using the top 10 principal components, and they are commonly used to graphically determine the number of principal components to be used as covariates in an association analysis to adjust for population structure. Here we provide an example of the effect of using these principal components as covariates to adjust for population structure in a genome-wide association study of CF patients. Although the consortium conducted a combined genome-wide association analysis for lung disease severity in a well-powered sample consisting of all the samples collected by the 3 study groups, here our example consists of an analysis in the Canadian sample alone, which is the only population-based sample within the consortium. We present two Quantile-Quantile (QQ) plots from a genome-wide association analysis in this Canadian sample with and without incorporating principal components in the analysis. Scree plot was used to determine the number of principal components needed for population substructure adjustment in the Canadian sample. The QQ-plot provides the observed by expected p-values under the null hypothesis of no association across 555,168 separate multiple regression analyses of quantitative phenotype regressed on genetic marker, implemented in PLINK. Deviation from the identity line of a QQ-plot can provide evidence of possible population structure. The R statistical package (13) was used to produce the QQ-plots.
Results
Population Structure
In the Canadian population sample, the top 15 principal components were statistically significant (p <0.05) based on the Tracy-Widom test. The scree plot (Supplementary figure 1) suggested that the top 7 principal components accounted for a substantial fraction (1.37%) of the total variability, recognizing that even minor substructure can affect the most extreme p-values. Two snapshots from a 3D plot of the top 3 principal components (accounting for 0.86% of the total variability) are shown in Figure 1. Four continuous arms of variation were apparent instead of tight clusters, indicating population admixture in the Canadian sample. The limited ethnicity information available on each individual did not provide additional insight into the population substructure observed. Neither geographic differences (analysis by province) nor CFTR mutation type (Supplementary figure 2) seemed to explain the population substructure, and mutation type was not significantly associated with any of the top 50 principal components in the logistic regression analysis.
Figure 1.

Two snapshots of the 3D plot of the top 3 principle components extracted from the Canadian population study sample; four distinct arms are present.
When the Canadian sample was seeded with 7 HapMap3 populations (Figure 2), the CEPH Caucasian (red) and Yoruba (blue) samples formed two separate tight clusters, while the two Asian samples, Han Chinese (orange) and Japanese (aquamarine), clumped together and formed another separate tight cluster. The Gujarati Indian (grey), Mexican (green) and African American (purple) samples formed three short continuous arms pointing to the CEPH Caucasian cluster. The Canadian sample exhibited a tripod structure with most of the subjects clustering around the apex where the CEPH Caucasian samples were located. The rest of the Canadian subjects formed three long arms, distributing along the CEPH Caucasian-Indian, CEPH Caucasian-Mexican and CEPH Caucasian-African American arms. The HapMap3 Asian populations did not encompass any of the Canadian subjects. Canadian patients that scattered along the CEPH Caucasian-African American arm were either self-reported ‘African’ or ‘mixed.’ Both of the CEPH Caucasian-Mexican and CEPH Caucasian-Gujarati Indian arms consisted of individuals that self-reported as either ‘Caucasian’ or as ‘Other.’ The three self-reported ‘Asian’ individuals were not mapped onto the HapMap3 Asian cluster; one scattered around the CEPH Caucasian cluster, and the other two fell along the CEPH Caucasian-Gujarati Indian arm.
Figure 2.
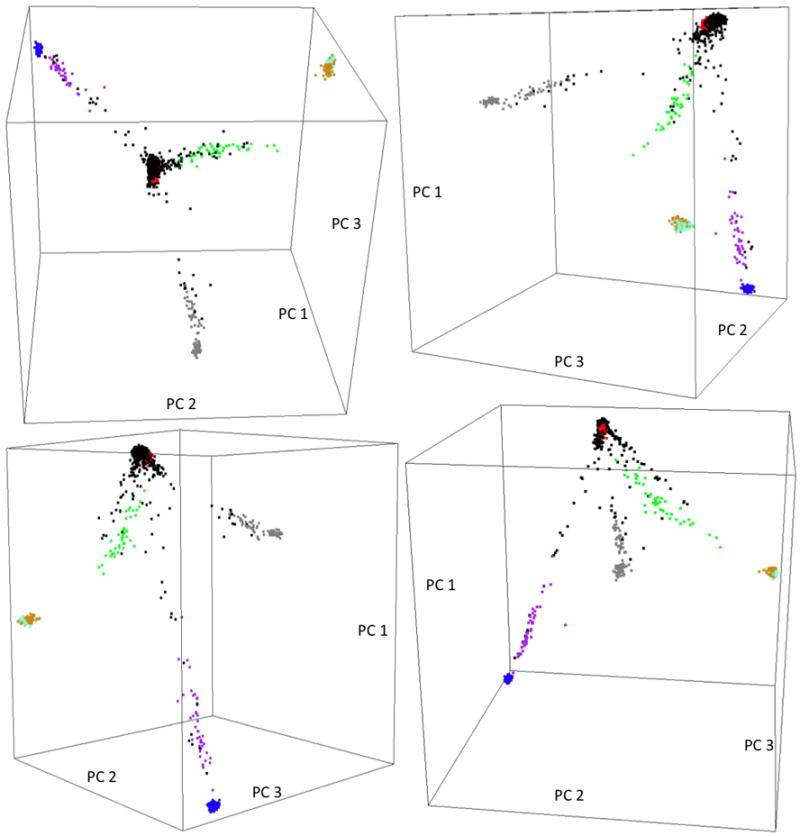
Four snapshots of the 3D plot of the top 3 principal components extracted from the combined Canadian population study sample and HapMap3 samples derived from 7 populations. Color legend: Black=Canadian population study sample, Red=CEPH Caucasian, Purple=African American, Green=Mexican, Grey=Gujarati Indian, Orange=Han Chinese, Aquamarine=Japanese, Blue=Yoruba. CEPH Caucasian and Yoruba samples formed two separate tight clusters; Han Chinese and Japanese samples clumped together and formed another tight cluster; African American, Mexican and Gujarati Indian samples formed 3 short continuous arms pointing to the CEPH Caucasian cluster. The Canadian population study samples exhibited a tripod structure, with most of the samples forming a cluster at the apex, overlapping the CEPH Caucasian cluster, and the rest of the samples formed three long arms, distributing along the CEPH Caucasian-African American, CEPH Caucasian-Mexican and CEPH Caucasian-Gujarati Indian arms.
Tracy-Widom tests indicated 9 and 13 significant principal components in the extremes of phenotype and sibling studies, respectively. Separate scree plots (Supplementary figure 1) indicated that the top 4 principal components accounted for a substantial proportion (1% and 2.15%, respectively) of the total variability in each of the two samples. The extremes of phenotype and sibling study samples were very similar to the Canadian sample in that they both exhibited arm-like structures in the 3D plot of the top 3 principal components, with most of the samples scattered around one of the arms. However, both US samples displayed 3 arms in contrast to the Canadian sample, which revealed 4 distinct arms (Supplementary figure 3 and Supplementary figure 4, respectively). In both US samples, the self-reported ‘Caucasian’, ‘Hispanic’ and ‘African American’ samples dominated each of the 3 arms (Figure 3). When each of the US samples was seeded with HapMap3 data, the three arms were mapped onto the CEPH Caucasian cluster, the CEPH Caucasian-African American arm and the CEPH Caucasian-Mexican arm, respectively. In general, the population substructure detected by principal component analysis agreed with self-reported ethnicity in both US samples; however, there were exceptions. For example, in the extremes of phenotype sample, one self-reported ‘Hispanic’ subject (Supplementary figure 5) fell along the CEPH Caucasian-African American arm. In the siblings sample, one self-reported ‘Caucasian’ subject (circled in green) distributed away from the CEPH Caucasian cluster; and one self-reported ‘Hispanic’ individual (circled in red) scattered along the CEPH Caucasian-Gujarati Indian arm; and three individuals (circled in blue) with self-reported ‘Asian’ or ‘Asian, Caucasian’ ethnicity did not scatter around either of the CEPH Caucasian or the Asian cluster, one fell along the CEPH Caucasian-African American arm and the other two fell along the CEPH Caucasian-Mexican arm (Supplementary figure 6).
Figure 3.
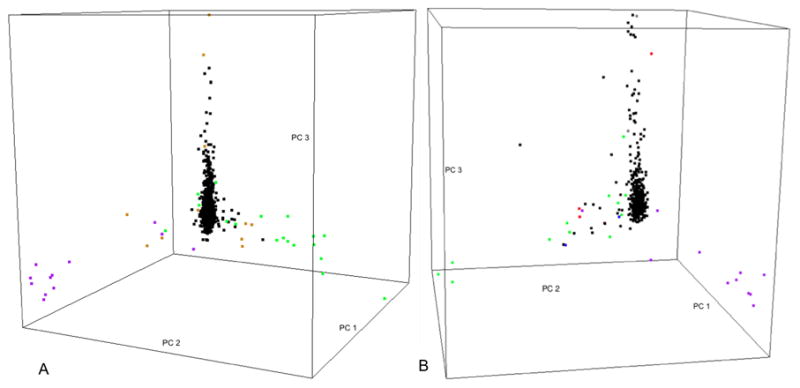
(A) Snapshot of 3D plot of the top 3 principal components extracted from the US extremes of phenotype study sample. Points were colored by self-reported ethnicity. Color legend: Black= ‘Caucasian’, Green= ‘Hispanic’, Purple= ‘African American’, Orange= ‘Other’. (B) Snapshot of 3D plot of the top 3 principal components extracted from the US sibling study sample. Points are colored by self-reported ethnicity. Color legend: Black= ‘Caucasian’, Green= ‘Hispanic’ or ‘Hispanic, Caucasian’, Purple= ‘African American’ or ‘African American, Caucasian’, Grey= ‘Middle Eastern’ or ‘Middle Eastern, Caucasian’, Brown= ‘Aleut, Caucasian’, Blue= ‘Native American, Caucasian’. Three distinct arms are observed in each of the two US study samples, with one arm encompassing the majority of the subjects. The major arm consists of mostly self-reported ‘Caucasian’ samples; and samples with ‘Hispanic’ and ‘African American’ ancestral background dominated the other two arms, respectively.
When we analyzed the US and Canadian samples combined, four arms were present in the 3D plot of the top 3 principal components (Supplementary Figure 7). Individuals from each of the three study samples distributed evenly along the arms, with the exception of a single arm, which consisted almost exclusively of individuals from Canada. When we seeded the 3 study samples with HapMap3 data (Figure 4), the structure was very similar to that shown in Figure 2, and the four arms we observed in Supplementary figure 7 clearly projected onto the CEPH Caucasian cluster, the CEPH Caucasian-Mexican, CEPH Caucasian-African American and CEPH Caucasian-Gujarati Indian arms, with the majority of the samples in a cluster overlapping the CEPH Caucasian cluster. The arm that consisted exclusively of Canadian samples overlapped the CEPH Caucasian-Gujarati Indian arm; all these patients had self-reported their ethnicity as ‘Other’.
Figure 4.

Four snapshots of the 3D plot of the top 3 principal components extracted from the combined North American CF samples and HapMap3 samples. Color legend: Black= North American CF samples, Purple=African American, Red= CEPH Caucasian, Orange=Han Chinese, Grey=Gujarati Indian, Aquamarine=Japanese, Green=Mexican, Blue=Yoruba. The HapMap3 samples formed 3 continuous arms and two separate tight clusters similar to that shown in Figure 2. The North American CF samples scattered along the 3 arms and around the CEPH Caucasian cluster, and the CEPH Caucasian-Gujarati Indian arm consists of almost exclusively samples from the Canadian population study.
This analysis indicates that there appears to be population substructure in all three study samples, with the degree and ethnic make-up of the patients in each study comparable. How might this substructure affect an association analysis in the North American CF population?
Effects on GWAS
We performed a genome-wide association analysis in the Canadian sample only, to illustrate the effect of population substructure. QQ-plots with and without adjusting for population substructure using the top 7 principal components, as suggested by the scree plot, are provided in Figures 5A and 5B, respectively. Although the Tracy-Widom test nominated the top 15 principal components as significant, we chose to use the top 7 principal components for the sake of parsimony; however, the association results did not differ with the inclusion of the extra principal components. Deviation from the identity line is observed in the absence of covariate adjustment with the top 7 principal components, but removed with adjustment, suggesting bias in the observed p-values due to population substructure.
Figure 5.
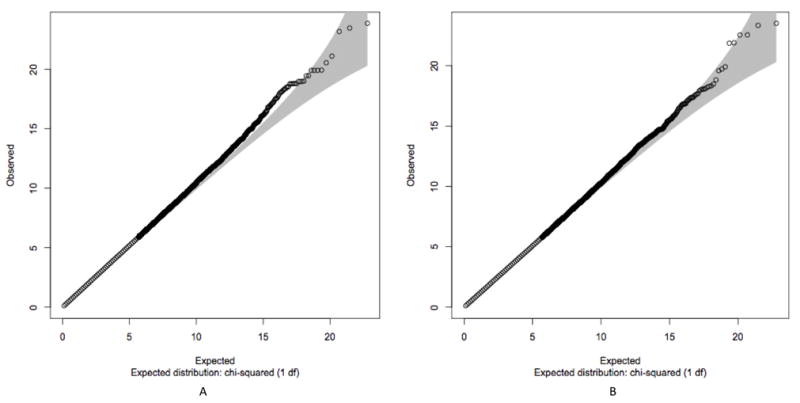
Q-Q plot of p-values obtained from the 1-degree of freedom trend test without (A) and with (B) adjustment for population structure by incorporating the top 7 principal components as covariates. This analysis was performed in the Canadian population study samples only. Deviation from the identity line is observed in the absence of covariate adjustment with the top 7 principal components, but removed with adjustment, suggesting bias in the observed p-values due to population substructure.
Discussion
This is the first study to evaluate the ethnic make-up of the North American CF population using genetic data. Our study revealed clearly defined population substructures in this CF population, and a similar structure was present across the Canadian and US CF samples. The continuous arms (instead of tight clusters) observed in the North American CF population are indicative of population admixture. In both of the US samples, substructures identified by principal component analysis showed relatively good agreement with their self-reported ethnicity; although there were individual cases where self-reported ethnicity disagreed with their genotype-inferred ethnicity.
Self-reported ethnicity is widely used in association studies to account for ancestral differences. However, it has limited reliability (14) and is inconsistent in the reporting over time (15). Self-reported ethnicity has also been shown to be insufficient in removing population stratification in genetic association analyses (16), presumably due to many of the known limitations, including those observed in this study. In populations with a large degree of complexity, such as the North American CF population, it is extremely difficult to define discrete ethnic categories that can fully capture the population diversity and the degree of admixture. Moreover, the lack of agreement between genotype-inferred ancestry and self-reported ethnicity may be due to the complexity of ethnicity itself. Ethnicity is a combination of not only genetic heritage but also one’s self-identity, making it a complex construct involving many factors.
Despite the limitations for population structure adjustment, we feel capturing detailed self-reported ethnicity is an important complement to genetic ancestry information in order to understand the ethnic make-up of a sample. This study highlights that composite ethnic categories that are highly detailed would be necessary to capture multiple ancestral backgrounds of admixed individuals.
The CEPH Caucasian, Han Chinese together with Japanese and Yoruba samples from HapMap3, representing the three major ethnic groups, ‘Caucasian’, ‘Asian’ and ‘African’, are the most commonly used reference populations in population structure analysis. In our principal component analysis, the majority of the self-reported ‘Caucasian’ samples clustered well with the CEPH Caucasian samples, as expected. There was, however, some degree of distribution away from the CEPH Caucasian cluster, highlighting both admixture and limitations of self-reported ethnicity. The two relatively homogeneous HapMap3 Asian populations, Han Chinese and Japanese did not encompass any of the North American CF samples. In addition, self-reported ‘Asian’ subjects showed no clustering with the HapMap3 Asian populations, which suggests the limitations of using pure Asian populations as reference when studying population structure in the North American CF population.
Our principal component analyses suggest that the North American CF samples lying along the CEPH Caucasian-Mexican arm are admixed with Mexican and European ancestries, and those along the CEPH Caucasian-African American arm are admixed with African and European ancestries. Individuals that scattered along the CEPH Caucasian-Gujarati Indian arm are admixed with northwestern Indian and European ancestries, and this group of CF patients was only observed in Canada. One possible explanation for the lack of admixed Indian patients in the US samples is that they do indeed exist, but they were simply not captured by the two US studies. Although the US samples included patients distributed across 48 US states, the majority of the subjects were collected from the eastern US. An alternative explanation is a diagnosis bias (17). Since only the Canadian sample was a population-based sample, we cannot purport to conclude that we have a clear ethnic representation of the US CF patients.
In admixed populations it is important to guard against biased and spurious association results by carefully estimating structure, understanding the study sample and adjusting for population stratification when possible. In our CF admixed population we have seen that we can avoid spurious findings by carefully estimating structure and adjusting for population stratification. We used genome-wide data to infer continuous ancestry to fully capture the diversity and admixture of a given population. In the absence of genome-wide data, there are other methods available to adjust for population structure in genetic association studies (4, 18).
Although predominantly Caucasian in origin, the North American CF population clearly has a complex ethnic make-up that is likely to change over time. For this reason we advocate for careful analysis of population structure in all CF genetic association studies. Moreover, these findings have implications for genetic association studies in other simple Mendelian diseases presumed to predominantly affect single ethnic groups, such as Alpha-1 Antitrypsin Deficiency and Sickle cell disease. Genetic association studies in these populations may also benefit from careful analysis of population structure.
Supplementary Material
Acknowledgments
The authors would like to thank Nicole Anderson, Katherine Keenan, Kathleen Naughton, and Rhonda Pace for coordinating patient recruitment and race/ethnicity verification; Johanna Rommens, Mike Collaco, Jaclyn Stonebraker and Jack Kent for their helpful discussions and comments on study direction; David Cutler for initial cleaning of SNP data; and the International HapMap Consortium for the genotype data. The authors sincerely appreciate the significant contribution from the CF Directors and Clinic Coordinators at each CF center that enrolled subjects and ascertained phenotype data and DNA, as part of the Canadian Cystic Fibrosis Genetic Modifier Study, the University of North Carolina/Case Western Reserve University Case-Control Study and the US CF Twin and Sibling Study. The authors express deep gratitude to all CF patients and their families.
Funding
This work was supported by Genome Canada through the Ontario Genomics Institute [2004-OGI-3-05 to P.D]; the Canadian Cystic Fibrosis Foundation [L.J.S, P.D]; the Ontario Research Foundation [L.J.S, P.D]; the Natural Sciences and Engineering Research Council of Canada [L.J.S, L.S], the National Institute of Health [HG-004314 to L.J.S]; Cystic Fibrosis Foundation [DRUMM00A0, P30 DK27651, and HL68890 to M.L.D; KNOWLE00A0, RR00046, and RR00059 to M.R.K]; National Heart Lung and Blood Institute [HL68927 to G.R.C]; and Flight Attendant Medical Research Institute [062553 to G.R.C].
Footnotes
Conflict of Interest Statement
We declare no conflict of interests.
Contributor Information
Weili Li, Child Health Evaluative Sciences Program, Hospital for Sick Children, Toronto, M5G 1X8, ON, Canada.
Lei Sun, (1) Dalla Lana School of Public Health, University of Toronto, Toronto, M5T 3M7, ON, Canada. (2) Department of Statistics, University of Toronto, Toronto, M5S 3G3, ON, Canada.
Mary Corey, (1) Child Health Evaluative Sciences Program, Hospital for Sick Children, Toronto, M5G 1X8, ON, Canada. (2) Dalla Lana School of Public Health, University of Toronto, Toronto, M5T 3M7, ON, Canada.
Fei Zou, Department of Biostatistics, School of Public Health, University of North Carolina at Chapel Hill, Chapel Hill, 27599, NC, USA.
Seunggeun Lee, Department of Biostatistics, School of Public Health, University of North Carolina at Chapel Hill, Chapel Hill, 27599, NC, USA.
Andreea L Cojocaru, Child Health Evaluative Sciences Program, Hospital for Sick Children, Toronto, M5G 1X8, ON, Canada.
Chelsea Taylor, (1) Dalla Lana School of Public Health, University of Toronto, Toronto, M5T 3M7, ON, Canada. (2) Child Health Evaluative Sciences Program, Hospital for Sick Children, Toronto, M5G 1X8, ON, Canada.
Scott M Blackman, McKusick-Nathans Institute of Genetic Medicine, Johns Hopkins University School of Medicine, Baltimore, 21287, MD, USA.
Anne Stephenson, Adult Cystic Fibrosis Program, and Keenan Research Centre of the Li Ka Shing Knowledge Institute, St. Michael’s hospital, Toronto, M5B 1W8, ON, Canada.
Andrew J Sandford, The James Hogg iCAPTURE Centre, University of British Columbia, St Paul’s Hospital, Vancouver, V6Z 1Y6, BC, Canada.
Ruslan Dorfman, Genetics and Genome Biology, Hospital for Sick Children, Toronto, M5G 1X8, ON, Canada.
Mitchell L Drumm, Departments of Pediatrics and Genetics, Case Western Reserve University, Cleveland, 44106, OH, USA.
Garry R Cutting, McKusick-Nathans Institute of Genetic Medicine, Johns Hopkins University School of Medicine, Baltimore, 21287, MD, USA.
Michael R Knowles, Pulmonary Research and Treatment Center, School of Medicine, University of North Carolina at Chapel Hill, Chapel Hill, 27599, NC, USA.
Peter Durie, Program in Physiology and Experimental Medicine, Hospital for Sick Children, Toronto, M5G 1X8, ON, Canada.
Fred A Wright, Department of Biostatistics, School of Public Health, University of North Carolina at Chapel Hill, Chapel Hill, 27599, NC, USA.
Lisa J Strug, (1) Child Health Evaluative Sciences Program, Hospital for Sick Children, Toronto, M5G 1X8, ON, Canada. (2) Dalla Lana School of Public Health, University of Toronto, Toronto, M5T 3M7, ON, Canada.
References
- 1.Kerem E, Corey M, Kerem BS, Rommens J, Markiewicz D, Levison H, Tsui LC, Durie P. The relation between genotype and phenotype in cystic fibrosis--analysis of the most common mutation (delta f508) N Engl J Med. 1990;323:1517–1522. doi: 10.1056/NEJM199011293232203. [DOI] [PubMed] [Google Scholar]
- 2.Vanscoy LL, Blackman SM, Collaco JM, Bowers A, Lai T, Naughton K, Algire M, McWilliams R, Beck S, Hoover-Fong J, et al. Heritability of lung disease severity in cystic fibrosis. Am J Respir Crit Care Med. 2007;175:1036–1043. doi: 10.1164/rccm.200608-1164OC. [DOI] [PMC free article] [PubMed] [Google Scholar]
- 3.Pritchard JK, Stephens M, Rosenberg NA, Donnelly P. Association mapping in structured populations. Am J Hum Genet. 2000;67:170–181. doi: 10.1086/302959. [DOI] [PMC free article] [PubMed] [Google Scholar]
- 4.Devlin B, Roeder K. Genomic control for association studies. Biometrics. 1999;55:997–1004. doi: 10.1111/j.0006-341x.1999.00997.x. [DOI] [PubMed] [Google Scholar]
- 5.Price AL, Patterson NJ, Plenge RM, Weinblatt ME, Shadick NA, Reich D. Principal components analysis corrects for stratification in genome-wide association studies. Nat Genet. 2006;38:904–909. doi: 10.1038/ng1847. [DOI] [PubMed] [Google Scholar]
- 6.Patterson N, Price AL, Reich D. Population structure and eigenanalysis. PLoS Genet. 2006;2:e190. doi: 10.1371/journal.pgen.0020190. [DOI] [PMC free article] [PubMed] [Google Scholar]
- 7.Drumm ML, Konstan MW, Schluchter MD, Handler A, Pace R, Zou F, Zariwala M, Fargo D, Xu A, Dunn JM, et al. Genetic modifiers of lung disease in cystic fibrosis. N Engl J Med. 2005;353:1443–1453. doi: 10.1056/NEJMoa051469. [DOI] [PubMed] [Google Scholar]
- 8.Ahmed N, Corey M, Forstner G, Zielenski J, Tsui LC, Ellis L, Tullis E, Durie P. Molecular consequences of cystic fibrosis transmembrane regulator (cftr) gene mutations in the exocrine pancreas. Gut. 2003;52:1159–1164. doi: 10.1136/gut.52.8.1159. [DOI] [PMC free article] [PubMed] [Google Scholar]
- 9.Dorfman R, Nalpathamkalam T, Taylor C, Gonska T, Keenan K, Yuan XW, Corey M, Tsui LC, Zielenski J, Durie P. Do common in silico tools predict the clinical consequences of amino-acid substitutions in the cftr gene? Clin Genet. 2010 doi: 10.1111/j.1399-0004.2009.01351.x. [DOI] [PubMed] [Google Scholar]
- 10.Purcell S, Neale B, Todd-Brown K, Thomas L, Ferreira MA, Bender D, Maller J, Sklar P, de Bakker PI, Daly MJ, et al. Plink: A tool set for whole-genome association and population-based linkage analyses. Am J Hum Genet. 2007;81:559–575. doi: 10.1086/519795. [DOI] [PMC free article] [PubMed] [Google Scholar]
- 11.The international hapmap consortium. The international hapmap project. Nature. 2003;426:789–796. doi: 10.1038/nature02168. [DOI] [PubMed] [Google Scholar]
- 12.Cattell RB. The scree test for the number of factors. Multivariate Behavioral Research. 1966;1(2):245–276. doi: 10.1207/s15327906mbr0102_10. [DOI] [PubMed] [Google Scholar]
- 13.R development core team. R: A language and environment for statistical computing. R foundation for statistical computing. vienna, austria: 2008. [Google Scholar]
- 14.Burnett MS, Strain KJ, Lesnick TG, de Andrade M, Rocca WA, Maraganore DM. Reliability of self-reported ancestry among siblings: Implications for genetic association studies. Am J Epidemiol. 2006;163(5):486–492. doi: 10.1093/aje/kwj057. [DOI] [PubMed] [Google Scholar]
- 15.Hahn RA, Truman BI, Barker ND. Identifying ancestry: The reliability of ancestral identification in the united states by self, proxy, interviewer, and funeral director. Epidemiology. 1996;7:75–80. doi: 10.1097/00001648-199601000-00013. [DOI] [PubMed] [Google Scholar]
- 16.Serre D, Montpetit A, Pare G, Engert JC, Yusuf S, Keavney B, Hudson TJ, Anand S. Correction of population stratification in large multi-ethnic association studies. PLoS One. 2008;3:e1382. doi: 10.1371/journal.pone.0001382. [DOI] [PMC free article] [PubMed] [Google Scholar]
- 17.Mei-Zahav M, Durie P, Zielenski J, Solomon M, Tullis E, Tsui L-C, Corey M. The prevalence and clinical characteristics of cystic fibrosis in south asian canadian immigrants. Arch Dis Child. 2003;90:675–679. doi: 10.1136/adc.2003.042614. [DOI] [PMC free article] [PubMed] [Google Scholar]
- 18.Gorroochurn P, Hodge SE, Heiman GA, Greenberg DA. A unified approach for quantifying, testing and correcting population stratification in case-control association studies. Hum Hered. 2007;64:149–159. doi: 10.1159/000102988. [DOI] [PMC free article] [PubMed] [Google Scholar]
Associated Data
This section collects any data citations, data availability statements, or supplementary materials included in this article.