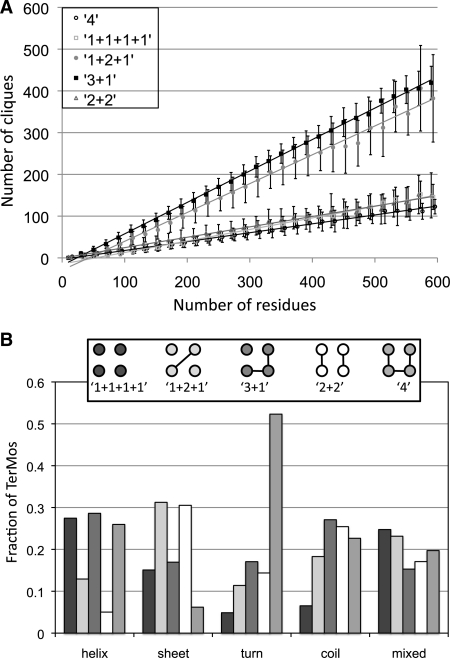
Fig. 3.
Tertiary motif propensities. (A) Linear dependence of the number of RPGs having a given sequence locality on the number of residues in a protein. Errors bars represent one standard deviation. The lines are linear fits to the data with the following equations: 1+1+1+1 y = 0.28*x − 14, R2 = 0.992; 1+2+1 y = 0.69*x − 27, R2 = 0.991; 3+1 y = 0.75*x−20, R2 = 0.999; 2+2 y = 0.25*x − 1, R2 = 0.991; and 4 y = 0.21*x − 4, R2 = 0.995. (B) Distribution of RPGs with different sequence locality as a function of secondary structural class. The helix, extended, turn, and coil classes represent RPGs in which a majority of the residues (3 or 4) are in the given secondary structure. The mixed class represents RPGs in which no secondary structure type dominates. Sequence localities are illustrated in the inset box and described in the text. Circles connected by lines represent residues that are close in sequence and unconnected circles represent residues that are not close in sequence.

