

Abstract
Intracellular signal transduction is often regulated by transient protein phosphorylation in response to external stimuli. Insulin signaling is dependent on specific protein phosphorylation events, and analysis of insulin receptor substrate-1 (IRS-1) phosphorylation reveals a complex interplay between tyrosine, serine, and threonine phosphorylation. The phosphospecific antibody-based quantification approach for analyzing changes in site-specific phosphorylation of IRS-1 is difficult due to the dearth of phospho-antibodies compared with the large number of known IRS-1 phosphorylation sites. We previously published a method detailing a peak area-based mass spectrometry approach, using precursor ions for peptides, to quantify the relative abundance of site-specific phosphorylation in the absence or presence of insulin. We now present an improvement wherein site-specific phosphorylation is quantified by determining the peak area of fragment ions respective to the phospho-site of interest. This provides the advantage of being able to quantify co-eluting isobaric phosphopeptides (differentially phosphorylated versions of the same peptide), allowing for a more comprehensive analysis of protein phosphorylation. Quantifying human IRS-1 phosphorylation sites at Ser303, Ser323, Ser330, Ser348, Ser527, and Ser531 shows that this method is linear (n = 3; r2 = 0.85 ± 0.05, 0.96 ± 0.01, 0.96 ± 0.02, 0.86 ± 0.07, 0.90 ± 0.03, 0.91 ± 0.04, respectively) over an approximate 10-fold range of concentrations and reproducible (n = 4; coefficient of variation = 0.12, 0.14, 0.29, 0.30, 0.12, 0.06, respectively). This application of label-free, fragment ion-based quantification to assess relative phosphorylation changes of specific proteins will prove useful for understanding how various cell stimuli regulate protein function by phosphorylation.
Understanding changes in protein phosphorylation in response to extracellular stimuli is vital for mapping intracellular signal transduction pathways. Conventional methods for the identification of protein phosphorylation sites, such as two-dimensional phosphopeptide mapping, are technically difficult and time-consuming. As a result, mass spectrometry techniques have been developed as effective, reliable, and faster applications for the identification and quantification of protein phosphorylation [1, 2]. In particular, Steen et al. [3] developed a label-free phosphorylation quantification method in which normalization of phosphopeptides was made relative to numerous tryptic peptides from the target protein. We modified this approach to utilize the peak-area of the reconstructed ion chromatogram for a phosphopeptide of interest and normalized this peak-area value against the average of the peak areas for selected representative non-phosphorylated peptides of the same protein that serve as endogenous internal standards [4, 5]. Peak areas for each peptide and phosphopeptide were obtained by integration of the appropriate reconstructed ion chromatograms for precursor ion masses. The trace generated in a reconstructed ion chromatogram displays the intensity (abundance) of a specified ion relative to HPLC retention time in a format that is analogous to an ultraviolet (UV) absorbance trace for an HPLC/UV run [4, 5]. Relative quantification of each phosphopeptide can then be obtained by comparing the normalized peak-area ratios for untreated and treated samples. Using this technique, we studied phosphorylation patterns of IRS-1, an adaptor protein that lies distal to the insulin receptor (IR) and acts as a key signaling protein within the insulin signaling pathway [4–6]. Insulin stimulates IR-mediated tyrosine phosphorylation of IRS-1 at multiple sites, which then acts to recruit and activate PI 3-kinase (and other proteins), ultimately relaying the insulin signal downstream [7]. While tyrosine phosphorylation of IRS-1 mimics the action of an “on/off switch,” serine/threonine phosphorylation of IRS-1 is a more complicated phenomenon, as at least 40 serine/threonine phosphorylation sites have been identified, and many of these sites modulate IRS-1 function through a multitude of mechanisms [8]. In addition, not all sites undergo insulin-stimulated phosphorylation, as some serine/threonine sites undergo an insulin stimulated decrease in phosphorylation, whereas other serine/threonine sites are nonresponsive to insulin. Furthermore, several IRS-1 serine phosphorylation sites have been shown to be hyper-phosphorylated in insulin resistant models, and this elevated serine phosphorylation of IRS-1 is thought to be involved in the pathogenesis of insulin resistance [9]. Therefore, characterizing the insulin-regulated phosphorylation of IRS-1 is vital for understanding insulin signaling. Through the use of the peak area-based quantification approach, we assessed the effect of insulin or TNFα treatment of L6 cells on the relative phosphorylation at two sites in human IRS-1 [4]. Furthermore, we used this technique to identify/quantify site-specific phosphorylation of IRS-1 in human vastus lateralis muscle obtained by needle biopsy basally, and after insulin infusion in four healthy volunteers, 22 serine/threonine phosphorylation sites were identified; 15 were quantified [5].
Our previous studies using the precursor ion, peak area-based mass spectrometry approach were successful for the quantification of 15 insulin-regulated IRS-1 serine/threonine phosphorylation sites in vivo in human muscle [5]. Unfortunately, quantification data are still lacking for a number of IRS-1 phosphorylation sites, in part because quantification for peptides containing more than one phosphorylation site can be problematic. For example, the human IRS-1 tryptic peptide corresponding to amino acids 303–325, in the monophosphorylated state, is phosphorylated at four different sites: Ser303, Ser307, Ser312, and Ser323. As a result, the majority of the monophosphorylated peptides, with the exception of the Ser312 phosphopeptide, are not sufficiently separated by HPLC to permit individual quantification. Another less complicated example would be the human IRS-1 tryptic peptide corresponding to amino acids 525–535, which can be detected as a peptide phosphorylated at either Ser527 or Ser531, and since both peptides consistently co-elute, quantification data for these IRS-1 phosphorylation sites cannot be obtained using the previously described approach.
Wolschin et al. demonstrated the relative quantification of a mono-phosphorylated peptide by integrating MS2- and MS3-extracted ion traces and observed an improved S/N ratio resulting from the MS3 ion trace as compared to the MS2 ion trace [10]. Because they only observed the loss of phosphoric acid from the peptide, their approach is not suitable for discerning co-eluting isobaric phosphopeptides. More recently, we developed an MS2 fragment ion-based phosphorylation quantification method for the ATP synthase β subunit [11]. One main reason for using MS2 fragment ions instead of precursor ions for the ATP synthase β subunit is that the MS2 ions acquired using the LTQ analyzer offered more sensitivity than the precursor ions acquired by the FTICR analyzer. Three mono-phosphorylated peptides of the ATP synthase β subunit that were resolved by HPLC were quantified using respective high intensity fragment ions with m/z values greater than that of the precursor ion. However, to the best of our knowledge, application of the label-free, unique fragment ion-based quantification approach to assess co-eluting isobaric phosphopeptide isoforms in a complex biological sample has not been reported.
In the present work, we utilized the peak area of site-specific fragment ions as an alternative to the parent ion, which allows for co-eluting isobaric phosphorylated peptides to be quantified using b and y ions unique to each phosphorylation isoform acquired using the LTQ mass analyzer. Using this approach, we show that MS2/MS3 fragment ions corresponding to phosphorylated tryptic peptides of IRS-1 can be detected in a linear and reproducible manner. We then used this new method to assess the effect of insulin treatment of Chinese hamster ovary cells overexpressing the IR (CHO/IR) on the relative phosphorylation at six sites in overexpressed human IRS-1.
Methods
Materials
The following suppliers were used: sequencing-grade trypsin, Sigma (St. Louis, MO); C18 ZipTip, Millipore (Billerica, MA, USA); anti HA.11 antibody, Covance (Berkeley, CA, USA). Chinese hamster ovary cells over-expressing the insulin receptor (CHO/IR) were a gift from Dr. Feng Liu (University of Texas Health Science Center at San Antonio, TX, USA). The cDNA encoding full-length wild-type human IRS-1 was a gift from Dr. C. Ronald Kahn (Harvard University, MA, USA). Bovine Serum Albumin (BSA) digest was obtained from Michrom BioResources (Alburn, CA, USA).
Adenoviruses
Adenoviruses encoding green fluorescence protein (GFP, as an adenovirus control) and hIRS-1 were produced by using the AdEasy system (Quantum Biotechnologies, Montreal, Canada). The cDNA encoding HA-tagged hIRS-1 (pBEX-hIRS-1 was prepared as previously described [12] was cloned into the pAdTrack-CMV transfer vector using EcoRV and Xba I restriction sites. The hIRS-1-HA encoding sequence was then transferred into the pAdEasy viral DNA plasmid by homologous recombination in the BJ5183 Escherichia coli strain. The recombinant adenoviral construct was transfected in HEK293 cells to produce viral particles. Adenoviruses were purified by CsCl gradient centrifugation. The infection efficiency was estimated for GFP expression using an Olympus (Center Valley, PA, USA) CK40 fluorescence microscope [12].
Cell Culture, Transfection, Immunoprecipitation, and Western Blot Analysis
CHO/IR cells were grown in HAM'S F-12 medium (Invitrogen, Carlsbad, CA, USA), supplemented with 10% fetal bovine serum and 1% penicillin/streptomycin. For adenovirus experiments, cells were transduced with hIRS-1 adenovirus (Ad-hIRS-1). Twenty-four hours post-transduction, cells were serum-starved for 5 h, treated with or without 100 nM insulin 15 min and lysed on ice in 300 μL of lysis buffer (50 mM HEPES, pH 7.6, 150 mM NaCl, 1% Triton X-100, 10 mM NaF, 20 mM sodium pyrophosphate, 20 mM β-glycerol phosphate, 1 mM sodium orthovanadate, 10 μg/mL leupeptin, 10 μg/mL aprotinin, and 1 mM phenylmethylsulfonyl fluoride). Cell lysates were centrifuged (10,000 × g, 4 °C, 10 min), and the clarified supernatants were used for immunoprecipitation. For immunoprecipitation, cell lysates were incubated with specific antibodies conjugated to protein G-agarose beads overnight at 4 °C with gentle rotation. Immunoprecipitates were washed extensively with ice-cold PBS and the proteins bound to beads were eluted by heating at 95 °C for 4 min in SDS sample loading buffer. Eluted proteins were separated by 10% SDS-PAGE and were stained with Coomassie blue.
In-Gel Digestion
The gel portions containing IRS-1 were excised, placed in a 0.6-mL polypropylene tube, destained twice with 300 μL of 50% acetonitrile (ACN) in 40 mM NH4HCO3 and dehydrated with 100% ACN for 15 min. After removal of ACN by aspiration, the gel pieces were dried in a vacuum centrifuge at 60 °C for 30 min. Trypsin (250 ng; Sigma Chemical Co., St. Louis, MO, USA) in 20 μL of 40 mM NH4HCO3 was added and the samples were maintained at 4 °C for 15 min before the addition of 50 μL of 40 mM NH4HCO3 containing three 10 fmol/μL peptides to serve as internal standards (Bradykinin Fragment 2–9, B1901, β-Sheet Breaker Peptide, S7563, and Anaphylatoxin C3a fragment, A8651; Sigma Chemical Co., St. Louis, MO, USA).
The digestion was allowed to proceed at 37 °C overnight and was terminated by addition of 10 μL 5% formic acid (FA). After further incubation at 37 °C for 30 min and centrifugation for 1 min, each supernatant was transferred to a clean polypropylene tube. The extraction procedure was repeated using 40 μL of 0.5% FA, and the two extracts were combined. The resulting peptide mixtures were purified by solid-phase extraction (C18 ZipTip; Millipore) after sample loading in 0.05% heptafluorobutyric acid:5% FA (vol/vol) and elution with 4 μL 50% ACN:1% FA (vol/vol) and 4 μL 80% ACN:1% FA (vol/vol), respectively. The eluates were combined and dried by vacuum centrifugation and 10 μL of 0.025%HFBA/0.1% FA:2% ACN (vol/vol) were added.
Mass Spectrometry
HPLC-ESI-MS/MSn was performed on a Thermo Finnigan (San Jose, CA, USA) LTQ-FTICR fitted with a PicoView nanospray source (New Objective, Woburn, MA, USA). On-line HPLC was performed using a Michrom BioResources Paradigm MS4 micro two-dimensional HPLC (Alburn, CA, USA) with a PicoFrit column (New Objective, 75 μm i.d., packed with ProteoPep II C18 material, 300 Å); mobile phase, linear gradient of 2% to 27% ACN in 0.1% FA in 65 min, a hold of 5 min at 27% ACN, followed by a step to 50% ACN, hold 5 min, and then a step to 80%; flow rate, 400 nL/min.
A “top-10” data-dependent MS/MS analysis was performed (acquisition of a full scan spectrum followed by collision-induced dissociation (CID) mass spectra of the 10 most abundant ions in the survey scan) to identify IRS-1 peptides and to obtain their HPLC retention times, as described before [4]. For quantification, the following multi-segment strategy was employed: one survey scan, followed by one parent-list CID scan and six targeted CID scans. Included in the parent list were the 2+ or 3+ charge states of seven representative IRS-1 peptides selected from the prominent ions reproducibly observed in the top-10 data-dependent tandem-MS analysis. These peptides were used as internal standards for IRS-1 protein content (see below). They were selected according to the following criteria: (1) detected by HPLC-ESI-MS with high intensity among IRS-1 peptides; (2) no missed cleavage observed; (3) no methionine in the sequence to avoid variability due to methionine oxidization and no N-terminal Gln residues. The 2+ or 3+ ions of the phosphopeptides of interest were placed on the target list. To assess the relative quantities of a large number of phosphopeptides in each experiment and yet still maintain acceptable mass analysis cycle times, the targeted m/z values were grouped into segments based on their expected HPLC retention times with a minimum 10-min retention time window for each peptide.
Tandem mass spectra were extracted from Xcalibur `RAW' files and charge states were assigned using the Extract_MSN script that is a component of Xcalibur 2.0 SR2 (Thermo Fisher; San Jose, CA, USA). The fragment mass spectra were then searched against the human SwissProt_v52.2 database (16,135 entries) using Mascot (Matrix Science, London, UK; version 2.1). The search variables that were used were: 5 ppm mass tolerance for precursor ion masses and 0.5 Da for product ion masses; digestion with trypsin; a maximum of two missed tryptic cleavages; variable modifications of oxidation of methionine and phosphorylation of serine, threonine, and tyrosine. Cross-correlation of Mascot search results with X! Tandem was accomplished with Scaffold (version Scaffold-01_06_19; Proteome Software, Portland, OR, USA). Probability assessment of peptide assignments and protein identifications were made through the use of Scaffold. Only peptides with ≥95% probability were considered. Assignments of the phosphopeptides were confirmed by manual comparison of the tandem mass spectra with the predicted fragmentation generated in silico by the MS-Product component of Protein Prospector (http://prospector.ucsf.edu).
Peak areas for each peptide were obtained by integration of the appropriate reconstructed ion chromatograms with 5 ppm error tolerance for precursor ion masses acquired using the FTICR and 0.5D for the fragment ions acquired using the LTQ mass analyzer. The reconstructed ion chromatograms allow one to express the intensity (abundance) of ions relative to HPLC retention times in chromatogram form, analogous to analysis of UV absorbance during an HPLC run. The peak areas (using MS2/MS3 fragment ions) for the phosphopeptides were then normalized against the average peak area (using precursor ions) for the seven representative IRS-1 peptides (endogenous standards). Relative quantification of each phosphopeptide was obtained by comparing normalized peak-area ratios for control and insulin treated samples.
Results and Discussion
Analysis of Phosphopeptides Derived from Human IRS-1
IRS-1 was isolated from CHO/IR cells and mass spectrometry analysis was performed as described in Methods. Table 1 lists the IRS-1 phosphopeptides detectable by MS and their respective predominant phosphorylation sites. In addition to these phosphopeptides, we chose seven non-phosphorylated peptides of IRS-1 that were detected in all MS analyses, and these peptides served as endogenous internal standards as a measure of the abundance of total IRS-1 present per sample (Table 2). Analysis of IRS-1 expressed in CHO/IR cells revealed that although some phospho-IRS-1 peptides exist predominantly as a single, monophosphorylated peptide (aa494–520, pThr495), several IRS-1 tryptic peptides, such as aa303–325, aa328–353, aa525–535, and aa627–638, for example, contain multiple phosphorylation sites (Figure 1). This presents a problem, as the different monophosphorylated versions of the same peptide possess the same mass/charge value, rendering them indistinguishable from each other during peak area analysis of precursor ions if they co-elute. As a result, we chose to target the mass/charge value of the parent ions of the particular phosphopeptides, and use the resulting peak areas of the fragment b and y ions specific to the sites of interest for quantification of phosphorylation. A list of the fragment b and y ions that were found to be suitable for analysis for each phospho-site within each phospho-peptide of interest is shown in Table 3. It is noted that for some phosphopeptides, fragment ions from MS2 spectra gave high-quality quantification results, while for other phosphopeptides, fragment ions from MS3 were superior.
Table 1.
IRS-1 phosphopeptides
| Start | Stop | Peptide sequence | Phosphorylation site |
|---|---|---|---|
| 303 | 325 | pSRTEpSITATpSPASMVGGKPGpSFR | Ser303, Ser307, Ser312, Ser323 |
| 328 | 353 | ASpSDGEGTMSRPASVDGSPVpSPSTNR | Ser330, Ser348 |
| 444 | 457 | SVpTPDSLGHpTPPAR | Thr446, Thr453 |
| 494 | 520 | CpTPGTGLGTSPALAGDEAASAADLDNR | Thr495 |
| 525 | 538 | THpSAGTpSPTITHQK | Ser527, Ser531 |
| 627 | 638 | KGpSGDYMPMpSPK | Ser629, Ser636 |
| 892 | 922 | pSPGEYVNIEFGSDQSGYLSGPVAFHSSPSVR | Ser892 |
| 999 | 1016 | QSYVDTpSPAAPVSYADMR | Ser1005 |
| 1075 | 1081 | VNLpSPNR | Ser1078 |
| 1098 | 1112 | RHpSSETFSSTPSATR | Ser1100 |
| 1099 | 1112 | HSpSETFSSTPSATR | Ser1101 |
| 1141 | 1161 | HpSpSApSFENVWLRPGELGGAPK | Ser1142, Ser1143, Ser1145 |
| 1221 | 1236 | RpSpSEDLSAYASISFQK | Ser1222, Ser1223 |
Table 2.
IRS-1 internal standard peptides
| Start | Stop | Peptide sequence | Theoretical +1H peptide mass (AMU) | Quantified m/z value | Quantified peptide charge state | Elution time (min) |
|---|---|---|---|---|---|---|
| 82 | 89 | HLVALYTR | 972.56 | 486.79 | 2 | 33.3 |
| 178 | 184 | NLIGIYR | 848.50 | 424.75 | 2 | 40.7 |
| 287 | 301 | HHLNNPPPSQVGLTR | 1666.88 | 556.30 | 3 | 31.4 |
| 639 | 651 | SVSAPQQIINPIR | 1422.80 | 711.91 | 2 | 48.5 |
| 876 | 891 | EQQQQQQPLLHPPEPK | 1924.99 | 642.33 | 3 | 36.9 |
| 1017 | 1028 | TGIAAEEVSLPR | 1242.67 | 621.84 | 2 | 46.6 |
| 1113 | 1140 | VGNTVPFGAGAAVGGGGGSSSSSEDVKR | 2507.21 | 836.41 | 3 | 43.2 |
Figure 1.

IRS-1 phosphopeptides containing multiple monophosphorylation sites.
Table 3.
IRS-1 fragment ions for quantification
| Start | Stop | Peptide sequence | Phosphorylation site | MS2 or MS3? | Product ion (charge state) | Mass | Elution time (min) |
|---|---|---|---|---|---|---|---|
| 303 | 325 | pSRTESITATSPASMVGGKPGpSFR | Ser303 | MS3 | y21 (+2) | 1049.02 | 43 |
| Ser323 | MS3 | b14 (+1) | 1436.67 | 42.7 | |||
| MS3 | y9 (+1) | 886.49 | 42.7 | ||||
| 328 | 353 | ASpSDGEGTMSRPASVDGSPVpSPSTNR | Ser330 | MS2 | y20 (+2) | 1009.98 | 35.6 |
| MS2 | y22 (+2) | 1103.01 | 35.6 | ||||
| MS2 | y11 (+1) | 1116.53 | 35.6 | ||||
| Ser348 | MS2 | y8 (+1) | 937.41 | 34.8 | |||
| MS2 | y20 (+2) | 1049.96 | 34.8 | ||||
| MS2 | b11 (+1) | 1095.44 | 34.8 | ||||
| 525 | 538 | THpSAGTpSPTITHQK | Ser527 | MS3 | y11 (+1) | 1140.60 | 24.5 |
| Ser531 | MS3 | y11 (+1) | 1122.59 | 24.4 | |||
| 627 | 638 | KGpSGDYMPMpSPK | Ser629 | MS3 | [M+2H-98-64]2+ | 624.29* | 25.1 |
| Ser636 | MS3 | [M+2H-98-64]2+ | 624.29* | 23.1 |
The highest fragment ion in the MS3 spectrum, loss of phosphoric acid (98D) and S0CH4 (64D) from the parent ion. Peptides containing pSer629 and pSer636 were resolved by HPLC.
Linearity and Reproducibility of MS3 Product Ions from Synthetic Phosphopeptides Corresponding to the Tryptic Phosphopeptides of IRS-1 Phosphorylated at Either Ser527 or Ser531
To confirm the validity of the MS2/MS3-based phospho-quantification approach, linearity and reproducibility experiments were performed using synthetic phosphopeptides corresponding to the tryptic phosphopeptides of IRS-1 phosphorylated at either Ser527 or Ser531. We performed linearity experiments using these synthetic phosphopeptides mixed with a tryptic digest of bovine serum albumin (BSA), where the amount of phosphopeptides was varied from 50 to 400 fmol while the amount of BSA digest was held constant at 200 fmol. We found that doubling the amount of either the pSer527 or pSer531 peptides resulted in an increase in the ratio of the phosphorylated peptide to the internal standards (BSA digests) by a factor of 1.92 ± 0.22 and 1.87 ± 0.09, respectively (Supplemental Table 1, which can be found in the electronic version of this article). These results suggest that the changes in phosphorylation observed using this method are representative of relative fold changes in the amount of phosphorylation a protein undergoes at specific sites under various cellular stimuli. The quantification by peak area of product of b and y ions from both the pSer527 and pSer531 phosphopeptides displayed a linear relationship over the ten-fold concentration range (Figure 2). We also tested the reproducibility of peak area assignment values for the MS3 fragment b and y ions. Equal amounts (400 fmol) of the pSer527 and pSer531 synthetic phosphopeptides were combined with 200 fmol of BSA digest and the mixtures were analyzed by HPLC-ESI-MS/MS as described in the Methods section. The peak area values obtained for the pSer527 or the pSer531 phosphopeptide were normalized to the average peak areas for the BSA digest peptides for each of the four experiments, and a coefficient of variation was calculated for each phosphorylation site. The coefficients of variation for the normalized peak area values of the MS3 product ions for the synthetic phosphopeptides corresponding to pSer527 and pSer531 were 14% and 11%, respectively, suggesting that the use of the peak area values of product b and y ions provides a reproducible approach to quantify phosphorylation of different sites within the same peptide (Supplemental Table 2).
Figure 2.
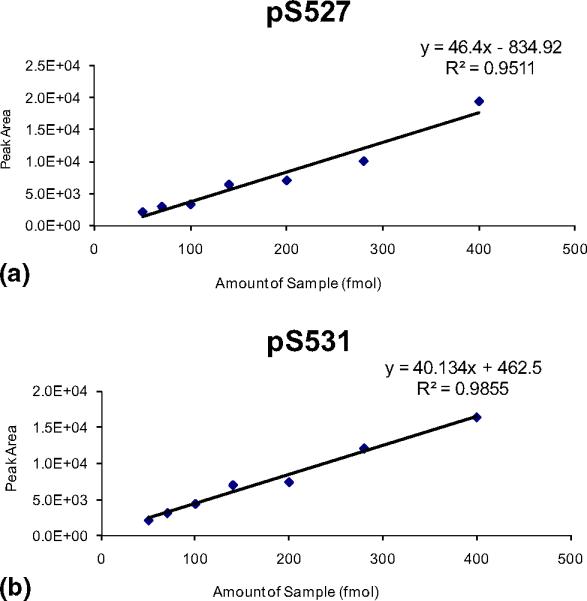
Linearity of MS3-based quantification of phosphorylation for synthetic phosphopeptides.
Reproducibility of MS2/MS3 Product Ions for the Quantification of Phosphorylation
To confirm the validity of the MS2/MS3-based phospho-quantification approach in a complex biological system, we tested the reproducibility of peak area assignment values for the MS2/MS3 fragment b and y ions. IRS-1 was isolated from CHO/IR cells as described in Methods and equal amounts of the same sample were separated by SDS-PAGE in four separate lanes. The bands corresponding to IRS-1 were excised and prepared as described in the Methods section, and each IRS-1 tryptic digest was analyzed by HPLC-ESI-MS/MS as described in Methods. Table 4 summarizes the results for the four independent experiments. For the seven non-phosphorylated IRS-1 standard peptides, an average of the peak area values for the precursor ions acquired in the FTICR was taken and the coefficient of variation was determined to be 11%. The average peak area values obtained for the seven IRS-1 peptides for each experiment were then used for normalization of phosphopeptide peak areas for each of the 4 experiments, and a coefficient of variation was calculated for each phosphorylation site (Table 4). The coefficients of variation for the normalized peak area values of the MS2/MS3 product ions for pSer303, pSer323, pSer330, pSer348, pSer527, pSer531 were: 12%, 14%, 29%, 30%, 12%, and 6%, respectively. In comparison, the two phosphorylation sites (pSer629 and pSer636) for which we used the loss of phosphoric acid (98D) and SOCH4 (64D) from the parent ion for phosphorylation quantification, compared with the product b and y ions, had coefficients of variation of 6 and 9%, respectively. In all analyses, the tandem mass spectra obtained for each peptide of interest were used to verify identity of the phosphorylation site. The relatively low coefficients of variance for the results in Table 4 demonstrate that the use of peak area values of product b and y ions provides a reproducible approach to quantify phosphorylation of different sites within the same phosphopeptide.
Table 4.
Coefficients of variation for reproducibility experiments
| Expt. 1 | Expt. 2 | Expt. 3 | Expt. 4 | AVE | C.V. | |
|---|---|---|---|---|---|---|
| STDs | 4.64E+07 | 5.91E+07 | 5.72E+07 | 5.92E+07 | 5.55E+07 | 0.11 |
| S303 | 9.42E−05 | 9.25E−05 | 9.63E−05 | 1.18E−04 | 1.00E−04 | 0.12 |
| S323 | 1.09E−04 | 8.05E−05 | 8.89E−05 | 1.06E−04 | 9.60E−05 | 0.14 |
| S330 | 4.87E−03 | 3.03E−03 | 2.58E−03 | 4.40E−03 | 3.72E−03 | 0.29 |
| S348 | 2.02E−03 | 1.25E−03 | 1.14E−03 | 2.03E−03 | 1.61E−03 | 0.30 |
| S527 | 6.26E−04 | 5.79E−04 | 6.42E−04 | 4.84E−04 | 5.83E−04 | 0.12 |
| S531 | 1.19E−04 | 1.15E−04 | 1.05E−04 | 1.08E−04 | 1.12E−04 | 0.06 |
| S629 | 1.27E−03 | 1.39E−03 | 1.22E−03 | 1.34E−03 | 1.30E−03 | 0.06 |
| S636 | 1.13E−03 | 1.15E−03 | 1.28E−03 | 1.36E−03 | 1.23E−03 | 0.09 |
Linearity of MS2/MS3 Product Ions for the Quantification of Phosphorylation
To determine linearity of this approach, three separate tryptic digests of IRS-1 were independently analyzed by HPLC-ESI-MS/MS over an approximate 10-fold concentration range (achieved by serial dilution of each tryptic digest). There was a linear relationship for the average peak areas of the seven IRS-1 peptide standards in the three experiments performed, and the regression equations were y = 1e+06 x + 8.6e+04, y = 1e+06 x + 4.5e+05, and y = 6e+05 x − 9.5e+04, with r2 = 0.99, 0.88, and 0.99, respectively. Table 5 shows the r2 values for the three experiments performed, and Figure 3 shows representative linearity graphs for both the standard peptides and all phosphorylation sites quantified by peak area of product b and y ions. Each phosphorylation site quantified by peak area of product of b and y ions displayed a linear relationship over the ten-fold concentration range.
Table 5.
r2 Values for linearity experiments
| Expt. 1 | Expt. 2 | Expt. 3 | AVE | SEM | |
|---|---|---|---|---|---|
| STDs | 0.99 | 0.88 | 0.99 | 0.95 | 0.04 |
| S303 | 0.76 | 0.85 | 0.95 | 0.85 | 0.05 |
| S323 | 0.98 | 0.93 | 0.97 | 0.96 | 0.01 |
| S330 | 1.00 | 0.93 | 0.97 | 0.96 | 0.02 |
| S348 | 0.95 | 0.71 | 0.92 | 0.86 | 0.07 |
| S527 | 0.94 | 0.93 | 0.85 | 0.90 | 0.03 |
| S531 | 0.82 | 0.96 | 0.95 | 0.91 | 0.04 |
| S629 | 0.96 | 0.92 | 0.91 | 0.93 | 0.01 |
| S636 | 0.68 | 0.97 | 0.88 | 0.84 | 0.09 |
Figure 3.

Linearity of MS2/MS3-based quantification of IRS-1 phosphorylation.
MS2/MS3-Based Quantification of Insulin Stimulated IRS-1 Phosphorylation
Since the peak area of the MS2/MS3 product ions exhibited both linearity and reproducibility, we used this method to quantify the effects of insulin on IRS-1 phosphorylation in CHO/IR cells. Adenoviruses encoding human IRS-1 were used to infect CHO/IR cells, and 24 h later the cells were serum-starved for 5 h and treated with 10−7M insulin for 10 min. IRS-1 was immunoprecipitated and phosphorylation was analyzed by HPLC-ESI-MS/MS as described in the Methods section. Insulin-stimulated changes in relative phosphorylation of IRS-1 from three independent experiments were expressed as the fold change over basal (Figure 4). The normalized peak areas for the MS3 fragment ions containing either pSer303, pSer323, or pSer330 of IRS-1 were only slightly affected by insulin: 1.07 ± 0.13, 0.91 ± 0.03, 0.94 ± 0.26, respectively. In contrast, there was a 50% decrease in the normalized peak area for pSer348 specific MS2-fragment ions isolated from insulin treated cells compared to untreated cells (0.47 ± 0.14), whereas Ser629 underwent a 20% decrease upon insulin stimulation (0.80 ± 0.09). On the other hand, insulin increased the phosphorylation of Ser527, Ser531, and Ser636: 1.56 ± 0.08, 1.27 ± 0.09, and 1.32 ± 0.07 fold, respectively.
Figure 4.

Quantification of insulin stimulated IRS-1 phosphorylation.
Conclusions
In our previous reports quantifying the effects of insulin on IRS-1 phosphorylation, our efforts were limited to studying phosphorylated peptides that did not co-elute. This presents a problem for a protein like IRS-1, which has at least 40 phosphorylation sites, with a number of these sites residing in the same tryptic peptide. In the case of IRS-1, the tryptic phosphopeptides that possess multiple phosphorylation sites are not usually detected as multi-phosphorylated peptides but, rather, appear as a collection of differentially monophosphorylated peptides, all of which possess identical m/z values. This property renders the phosphopeptides indistinguishable using the previous, precursor ion-based quantification approach, unless sufficient HPLC separation is achieved (as is the case for the pSer629 and pSer636 containing peptide). For example, Ser303 and Ser323 are found in the aa303–325 tryptic peptide, and both have a mass/charge value of m/z 807.38 (+3). By analyzing the peak area of the MS3 product ions created from targeting the m/z 807.38 parent ion, quantification data can be obtained for each of the sites. Unfortunately, there are limits to this approach, as fragment ions from a phosphorylation site that lies between 2 other phosphorylation sites within the same peptide cannot be distinguished by mass/charge values. MS4 or higher order of MSn may be needed to quantify those sites. It is also important to note that phosphopeptide fragmentation is variable, and both MS2 and MS3-based targeting approaches must be tested for each site of interest, since some fragment b and y ions are more easily detected by MS2 versus MS3 and vice versa. A major advantage of this approach is that it is relatively straight forward, compared with alternative mass spectrometry-based phosphorylation quantification strategies, which include the use of stable isotope labeled synthetic peptide analog internal standards [13, 14], metabolic labeling [15–18], derivatization [19 –21], and evaluation of MS peak intensities of peptide(s) derived from proteins added before digestion [22] or from the protein of interest [3, 23]. One major difference between the MS2-based approach we described previously for ATP synthase β phosphorylation and the present approach is that unique, monophosphorylated peptides were quantified for ATP synthase β, while in the present approach, the unique ions for a specific phosphopeptide isoform were selected due to the issue of co-eluting isobaric phosphopeptides.
In conclusion, we report here an improvement to our previously established, MS-based relative quantification of protein phosphorylation method. This new method utilizes the normalized peak area of MS2/MS3 derived fragment ions specific to individual phosphopeptide isoforms. This improvement provides the additional advantage of quantifying changes in the relative phosphorylation of co-eluting isobaric phosphopeptides, allowing for a more comprehensive understanding of protein phosphorylation. Obviously, it can be also used to quantify phosphopeptides that were resolved by HPLC, as MS2/MS3 derived fragment ions may offer higher sensitivity as compared to using precursor ions. We present data supporting both the reproducibility and linearity of this approach, and in addition, we present phospho-quantification data for IRS-1 in a typical signaling experiment under basal and insulin stimulated conditions. The fact that this approach can be used to quantify multiple phosphorylation sites simultaneously without the use of phosphorylation site-specific antibodies makes this an ideal technique for understanding complex patterns of protein phosphorylation.
Supplementary Material
Acknowledgments
This work was supported in part by NIH grants R01DK47936 and R01DK66483, (L.J.M.), R01DK081750 (Z.Y.), and the American Diabetes Association 7-09-CT-56 (Z.Y.).
Footnotes
Appendix A Supplementary Material Supplementary material associated with this article may be found in the online version at doi:10.1016/j.jasms.2010.05.009.
References
- 1.Boersema PJ, Mohammed S, Heck AJ. Phosphopeptide Fragmentation and Analysis by Mass Spectrometry. J. Mass Spectrom. 2009;44:861–878. doi: 10.1002/jms.1599. [DOI] [PubMed] [Google Scholar]
- 2.Blackburn K, Goshe MB. Challenges and Strategies for Targeted Phosphorylation Site Identification and Quantification Using Mass Spectrometry Analysis. Brief Funct. Genomics Proteomics. 2009;8:90–103. doi: 10.1093/bfgp/eln051. [DOI] [PubMed] [Google Scholar]
- 3.Steen H, Jebanathirajah JA, Springer M, Kirschner MW. Stable Isotope-Free Relative and Absolute Quantitation of Protein Phosphorylation Stoichiometry by MS. Proc. Natl. Acad. Sci. U.S.A. 2005;102:3948–3953. doi: 10.1073/pnas.0409536102. [DOI] [PMC free article] [PubMed] [Google Scholar]
- 4.Yi Z, Luo M, Mandarino LJ, Reyna SM, Carroll CA, Weintraub ST. Quantification of Phosphorylation of Insulin Receptor Substrate-1 by HPLC-ESI-MS/MS. J. Am. Soc. Mass Spectrom. 2006;17:562–567. doi: 10.1016/j.jasms.2005.12.010. [DOI] [PubMed] [Google Scholar]
- 5.Yi Z, Langlais P, De Filippis EA, Luo M, Flynn CR, Schroeder S, Weintraub ST, Mapes R, Mandarino LJ. Global Assessment of Regulation of Phosphorylation of Insulin Receptor Substrate-1 by Insulin In Vivo in Human Muscle. Diabetes. 2007;56:1508–1516. doi: 10.2337/db06-1355. [DOI] [PubMed] [Google Scholar]
- 6.Luo M, Langlais P, Yi Z, Lefort N, De Filippis EA, Hwang H, Christ-Roberts CY, Mandarino LJ. Phosphorylation of Human Insulin Receptor Substrate-1 at Serine 629 Plays a Positive Role in Insulin Signaling. Endocrinology. 2007;148:4895–4905. doi: 10.1210/en.2007-0049. [DOI] [PMC free article] [PubMed] [Google Scholar]
- 7.Boura-Halfon S, Zick Y. Phosphorylation of IRS proteins, insulin action, and insulin resistance. Am. J. Physiol. Endocrinol. Metab. 2009;296:E581–591. doi: 10.1152/ajpendo.90437.2008. [DOI] [PubMed] [Google Scholar]
- 8.Boura-Halfon S, Zick Y. Serine Kinases of Insulin Receptor Substrate Proteins. Vitam. Horm. 2009;80:313–349. doi: 10.1016/S0083-6729(08)00612-2. [DOI] [PubMed] [Google Scholar]
- 9.Sun XJ, Liu F. Phosphorylation of IRS Proteins Yin-Yang Regulation of Insulin Signaling. Vitam. Horm. 2009;80:351–387. doi: 10.1016/S0083-6729(08)00613-4. [DOI] [PubMed] [Google Scholar]
- 10.Wolschin F, Lehmann U, Glinski M, Weckwerth W. An Integrated Strategy for Identification and Relative Quantification of Site-Specific Protein Phosphorylation Using Liquid Chromatography Coupled to MS2/MS3. Rapid Commun. Mass Spectrom. 2005;19:3626–3632. doi: 10.1002/rcm.2236. [DOI] [PubMed] [Google Scholar]
- 11.Hojlund K, Yi Z, Lefort N, Langlais P, Bowen B, Levin K, Beck-Nielsen H, Mandarino LJ. Human ATP Synthase β is Phosphorylated at Multiple Sites and Shows Abnormal Phosphorylation at Specific Sites in Insulin-Resistant Muscle. Diabetologia. 2009 doi: 10.1007/s00125-009-1624-0. Epub ahead of print. [DOI] [PubMed] [Google Scholar]
- 12.Luo M, Reyna S, Wang L, Yi Z, Carroll C, Dong LQ, Langlais P, Weintraub ST, Mandarino LJ. Identification of Insulin Receptor Substrate 1 Serine/Threonine Phosphorylation Sites Using Mass Spectrometry Analysis: Regulatory Role of Serine 1223. Endocrinology. 2005;146:4410–4416. doi: 10.1210/en.2005-0260. [DOI] [PubMed] [Google Scholar]
- 13.Gerber SA, Rush J, Stemman O, Kirschner MW, Gygi SP. Absolute Quantification of Proteins and Phosphoproteins from Cell Lysates by Tandem MS. Proc. Natl. Acad. Sci. U.S.A. 2003;100:6940–6945. doi: 10.1073/pnas.0832254100. [DOI] [PMC free article] [PubMed] [Google Scholar]
- 14.Kirkpatrick DS, Gerber SA, Gygi SP. The Absolute Quantification Strategy: A General Procedure for the Quantification of Proteins and Post-Translational Modifications. Methods. 2005;35:265–273. doi: 10.1016/j.ymeth.2004.08.018. [DOI] [PubMed] [Google Scholar]
- 15.Ballif BA, Roux PP, Gerber SA, MacKeigan JP, Blenis J, Gygi SP. Quantitative Phosphorylation Profiling of the ERK/p90 Ribosomal S6 Kinase-Signaling Cassette and Its Targets, the Tuberous Sclerosis Tumor Suppressors. Proc. Natl. Acad. Sci. U.S.A. 2005;102:667–672. doi: 10.1073/pnas.0409143102. [DOI] [PMC free article] [PubMed] [Google Scholar]
- 16.Hinsby AM, Olsen JV, Mann M. Tyrosine Phosphoproteomics of Fibroblast Growth Factor Signaling: A Role for Insulin Receptor Substrate-4. J. Biol. Chem. 2004;279:46438–46447. doi: 10.1074/jbc.M404537200. [DOI] [PubMed] [Google Scholar]
- 17.Ibarrola N, Kalume DE, Gronborg M, Iwahori A, Pandey A. A Proteomic Approach for Quantitation of Phosphorylation Using Stable Isotope Labeling in Cell Culture. Anal. Chem. 2003;75:6043–6049. doi: 10.1021/ac034931f. [DOI] [PubMed] [Google Scholar]
- 18.Oda Y, Huang K, Cross FR, Cowburn D, Chait BT. Accurate Quantitation of Protein Expression and Site-Specific Phosphorylation. Proc. Natl. Acad. Sci. U.S.A. 1999;96:6591–6596. doi: 10.1073/pnas.96.12.6591. [DOI] [PMC free article] [PubMed] [Google Scholar]
- 19.Goshe MB, Conrads TP, Panisko EA, Angell NH, Veenstra TD, Smith RD. Phosphoprotein Isotope-Coded Affinity Tag Approach for Isolating and Quantitating Phosphopeptides in Proteome-Wide Analyses. Anal. Chem. 2001;73:2578–2586. doi: 10.1021/ac010081x. [DOI] [PubMed] [Google Scholar]
- 20.Qian WJ, Goshe MB, Camp DG, II, Yu LR, Tang K, Smith RD. Phosphoprotein Isotope-Coded Solid-Phase Tag Approach for Enrichment and Quantitative Analysis of Phosphopeptides from Complex Mixtures. Anal. Chem. 2003;75:5441–5450. doi: 10.1021/ac0342774. [DOI] [PubMed] [Google Scholar]
- 21.Weckwerth W, Willmitzer L, Fiehn O. Comparative Quantification and Identification of Phosphoproteins Using Stable Isotope Labeling and Liquid Chromatography/Mass Spectrometry. Rapid Commun. Mass Spectrom. 2000;14:1677–1681. doi: 10.1002/1097-0231(20000930)14:18<1677::AID-RCM84>3.0.CO;2-N. [DOI] [PubMed] [Google Scholar]
- 22.Cutillas PR, Geering B, Waterfield MD, Vanhaesebroeck B. Quantification of Gel-Separated Proteins and Their Phosphorylation Sites by LC-MS Using Unlabeled Internal Standards: Analysis of Phosphoprotein Dynamics in a B-Cell Lymphoma Cell Line. Mol. Cell. Proteom. 2005;4:1038–51. doi: 10.1074/mcp.M500078-MCP200. [DOI] [PubMed] [Google Scholar]
- 23.Ruse CI, Willard B, Jin JP, Haas T, Kinter M, Bond M. Quantitative Dynamics of Site-Specific Protein Phosphorylation Determined Using Liquid Chromatography Electrospray Ionization Mass Spectrometry. Anal. Chem. 2002;74:1658–1664. doi: 10.1021/ac0157122. [DOI] [PubMed] [Google Scholar]
Associated Data
This section collects any data citations, data availability statements, or supplementary materials included in this article.