

Abstract
Correlative light and electron microscopy (CLEM) has facilitated study of intracellular trafficking. Routine application of CLEM would be advantageous for many laboratories but previously described techniques are particularly demanding, even for those with access to laser scanning confocal microscopy (LSCM) and transmission electron microscopy (TEM). We describe streamlined methods for TEM of GFP-labeled organelles after imaging by LSCM using gridded glass bottom imaging dishes. GFP-MAP 1A/1B LC3 (GFP-LC3) transfected cells were treated with rapamycin, fixed and imaged by LSCM. Confocal image stacks were acquired enabling full visualization of each GFP-LC3 labeled organelle. After LSCM, cells were embedded for TEM using a simplified two step method that stabilizes the glass bottom such that the block can be separated from the glass by mild heating. All imaging and TEM processing are performed in the same dish. The LSCM imaged cells were relocated on the block and serial sectioned. Correlation of LSCM, DIC and TEM images was facilitated by cellular landmarks. All GFP labeled structures were successfully reidentified and imaged by serial section TEM. This method could make CLEM more accessible to non-specialized laboratories with basic EM expertise and could be used routinely to confirm organelle localization of fluorescent puncta.
Keywords: organelle, green fluorescent protein, live imaging, autophagosome, vesicle, trafficking
Introduction
Correlative light and electron microscopy (CLEM) is light level imaging of fluorescently tagged molecules followed by transmission electron microscopic (TEM) analysis of the labeled protein and its associated organelle, subcellular location and environment (Razi & Tooze, 2009). A variant incorporating time-lapse imaging prior to TEM is called correlative video light and electron microscopy (CVLEM) (Polishchuk & Mironov, 2001). A significant benefit for combining light and electron microscopy is that one can observe dynamic events such as intracellular trafficking and organelle biogenesis over time and then characterize and/or verify the same organelles with the resolution of TEM.
The use of light-level techniques alone, such as fluorescent fusion protein tagging or fluorophore antibody-conjugated immunohistochemistry, allows one to make some assumptions about the possible cellular location of the protein of interest but lack the resolution needed to characterize the subcellular microenvironment and organelle morphology. TEM in contrast, is a common way to determine ultrastuctural localization and can be used with immunolabeling with HRP or gold-conjugated antibodies (Mironov & Beznoussenko, 2009). However, in particle-based methods such as immunogold, the resolution is determined by the protein bridges plus the size of the gold particles, in the range of 10–20 nm (Griffiths, et al., 1993; Roth, et al., 1996), may mask the ultrastructure environment of the target. In addition, in many cases of immuno-electron microscopy, cellular organelle morphology is suboptimal due to the permeabilizing detergents used (Griffiths, et al., 1993) and embedding without osmication.
Therefore CLEM, in the absence of detergent permeabilization for immunolabeling, might be the preferred method to obtain ultrastructural information about organelles harboring marker proteins. However, when performing CLEM without labeling prior to TEM, it may be difficult to relocate the organelle of interest. Confocal/TEM overlay (CTO), in which precise maps of GFP fluorescence are obtained from a resin embedded section which can be digitally overlayed on TEM images from adjacent sections (Keene, et al., 2008) may be adequate to solve this problem. An additional way to relocate organelles imaged by fluorescence under the EM is by a tetracystein tag (Gaietta, et al., 2006). However, it is clear that labeling with antibodies or other agents prior to TEM not only compromises morphology but also increases the complexity of the procedure and makes it less routine. We found that if the labeled protein of interest is associated with an easily identifiable or prominent organelle, such as GFP tagged MAP 1A/1B LC3 (GFP-LC3), a putative marker of autophagosomes, it may not be necessary to perform any post-light level labeling for enhancement of electron microscopic visualization. When distinctive cellular landmarks are visible by both light and electron microscopes, the lack of permeabilization and more robust fixation would allow for precise morphological characterization of the organelle and its surroundings. Furthermore, we sought to simplify the TEM processing such that CLEM might be performed on a routine basis for many samples and as a primary assay system to perform structure function analyses on mutated constructs.
Here we describe a CLEM protocol for embedding cell monolayers on live imaging dishes after imaging of transfected GFP tagged proteins using laser scanning confocal microscopy (LSCM). This allows rapid EM processing without the requirement of specialized equipment other than that needed for LSCM and EM. Imaging, processing and embedding are all performed in the same dish without having to transfer samples (Razi & Tooze, 2009). Reliable and clean separation of the resin block from the glass surface is accomplished by mild heating rather than by freezing (Razi & Tooze, 2009) or acid (Polishchuk & Mironov, 2001). Morphological preservation of organelles is maximized by using a high aldehyde concentrated fixative and excluding any detergents. We find using this method that the majority of GFP-LC3 labeled organelles observed by LSCM can be easily relocated by TEM and allow confirmation of ultrastructural localization.
Materials and Methods
Cell Culture
HEK293 cells were plated on uncoated gridded glass bottom dishes (P35G-2-14-C-GRID, or P35G-2-14-CGRD, MatTek Corp, Ashland, MA). These dishes have a No. 2 coverslip installed over a hole in the bottom of the dish. On this coverslip is etched a alphanumeric grid which enables cell relocation by light and electron microscopy (see Fig. 2). Although the optimal coverslip for most objectives is a No. 1.5, we have found that the thicker coverslip in these dishes still allows acceptable imaging of cells grown on its surface. Some objectives have a correction collar that can correct for coverslip thickness if necessary. Cells were grown in DMEM plus 10% fetal bovine serum. Cells were transfected with GFP-LC3 (obtained from Dr. Zhenyu Yue, Mount Sinai School of Medicine) using Lipofectamine 2000 (Invitrogen, Carlsbad, CA) according to manufacturers directions. Following transfection, cells were treated for two days with 100 nm rapamycin to induce autophagic vesicles. Cells were then fixed with 4% glutaraldehyde (in 0.1 M sodium cacodylate, pH 7.4) including 1 mM CaCl2 at 4 °C for 20 minutes. Cells were then washed with 0.1 M sodium cacodylate, pH 7.4 at 4 °C. Cells were maintained up to 2 weeks at 4 °C in this buffer until LSCM imaging. This fixation was found to maintain GFP fluorescence when imaging various GFP tagged proteins in HEK293 cells. The high level of expression of transfected constructs in HEK293 cells permitted the visualization of GFP fusions despite the increased autofluorescence as a result of glutaraldehyde fixation (Hanson, et al., 2010). However, in transfected primary neurons, it was necessary to image the tagged molecules live prior to fixation because the autofluorescence precluded visualization of transfected constructs (Fernandez-Monreal, et al., 2010). Also we found that RFP tagging is incompatible with glutaraldehyde which necessitated live imaging (Hanson, et al., 2010). These modifications did not affect the basic procedure as outlined.
Figure 2.

Fidelity of transfer of cells from culture surface to resin block. (A) Cells visualized by low power brightfield microscopy to document the location of the cells with respect to the grid. (B) High power DIC image of same cells. (C) Low power image of same cells after transfer to resin block. Cells and grid are clearly visible. (D) High power image of cells after transfer to resin block. Morphology is very similar to DIC image.
LSCM imaging
During LSCM-imaging, the cells were maintained in 0.1 M sodium cacodylate, pH 7.4. An inverted Zeiss LSM 510 META laser scanning confocal microscope, equipped with a stage for mounting the live imaging dishes, was used. Cells containing GFP-LC3 labeled spots were identified at low-magnification using the fluorescent light source. To orient the cells of interest with the gridded coverslip, brightfield and GFP LSCM single-plane images were taken using a 10× objective (0.3 NA, air) such that the grid was clearly visible in the image (see Fig. 2A). The GFP was excited by 488 nm wavelength argon laser light and its emission detected through a long pass 505 nm filter. The 10× brightfield revealed both the grid and all cells in the field while, in the 10× GFP image, only GFP-LC3 spots were visible in the field. From these images, the location of the cells relative to the grid coordinates on the glass surface could be ascertained.
After documenting the location of the cells of interest relative to the grid both DIC and GFP LSCM z-stack images were taken using a 63× objective (Plan-Apo 1.4NA, oil). These 63× DIC and GFP images cover 143×143 μm in 1024×1024 pixel mode and were scanned at a speed of 1.60 μs/pixel with 2 line averaging for DIC and 4 line averaging for GFP. In some cases, the 63× z-stack slices are set to 0.7 μm thick (due to pinhole set at 1 Airy unit) and spaced in 0.14 μm z-steps (as measured from the thickness midpoint). This z-step size produces “voxelated” images because it matches the XY resolution of 0.14 μm/pixel and allows accurate 3D reconstruction of the confocal stack (Rodriguez, et al., 2003; Rodriguez, et al., 2008).
Preparation for TEM
After LSCM imaging is complete the material was washed in sodium cacodylate buffer and treated with 1% osmium tetroxide, 1.5 % potassium ferracyanide in 0.1 M cacodylate buffer for 1 hour at 4°C. The cells were then dehydrated in solutions of ethanol at increasing concentrations of 50%, 60%, and 70%, kept in 2 ml of 3% uranyl acetate in 70% ethanol for 12 hours at 4°C, washed in 70% ethanol and further dehydrated with increasing concentrations of 80%, 90%, and 100% ethanol. The live imaging dishes are incompatible with propylene oxide. We therefore used a second 100% ethanol wash as the final dehydration step. After dehydration, cells were infiltrated with a 1:1 solution of resin (Embed 812 kit, Electron Microscopy Sciences, Hatfield, PA) and 100% ethanol for 24 hours at 4 °C with the dishes sealed. The recipe for mixing the resin using the Embed 812 kit was as follows: 10 ml of resin mixture “A” (45 ml Embed 812 plus 50 ml DDSA) was thoroughly mixed with 10 ml resin mixture “B” (50 ml Embed 812 plus 45 ml NMA) and 0.3 ml DMP-30.
Prior to adding the resin/ethanol, the approximate location of the cell of interest relative to the grid was noted on the coverslip (see Fig. 1) as the resin fills the etched grid making it unidentifiable. After infiltration overnight, the resin/ethanol was replaced with a ~1 ml layer of pure resin, which when solidified stabilizes the glass grid. Prior to solidification, an open ended embedding capsule with a 1 × 1 cm face (Electron Microscopy Sciences, Hatfield, PA) was placed on the dish surrounding the cell of interest. The resin was then polymerized in a vacuum oven at of 65 °C for 8–12 hours. After the first layer was solidified, the capsule was topped off with more resin and put back in the oven for another 8–12 hours. To separate the block from the dish, a hot plate was heated to 60°C and the dish was placed directly on a pre-heated hot plate for exactly 3 minutes and 30 seconds. The dish was removed from the hot plate and the capsule carefully dislodged free from the dish. Once separated, the block face retains all the cells and an imprint of the etched grid.
Figure 1.

Procedure for embedding cell of interest. (A) Dish is placed on plastic support and is adjusted such that cell of interest is located over mark (square) drawn on plastic support. Position of dish on plastic support is recorded by markings on the side. A thin layer of resin can then be applied to the dish. (B) Open ended capsule is placed on dish with cell of interest in the center. Dish is placed in vacuum oven to solidify resin. (C) After first solidification, capsule is topped of with more resin and placed back in oven. (D) Dish is heated on hot plate and capsule is gently dislodged from dish by using fingers to apply even pressure.
The block was coarsely trimmed with a double-edged razorblade, making sure not to cut too close to the cell of interest, and a Diatome cryotrim 45° mesa trimming knife (Electron Microscopy Sciences, Hatfield, PA) was used to finely trim the block around the cell. Next, 70 nm serial ultrathin sections were cut from the block surface using a Reichardt Ultracut E ultramicrotome. All sections coming off the block face were collected. Ribbons of 6–10 sections were collected using a Perfect Loop (Electron Microscopy Sciences, Hatfield, PA) and transferred to a 2 × 1 mm carbon reinforced slot grid (Electron Microscopy Sciences, Hatfield, PA). The sample was dried on the grid and transferred to Hiraoka Staining Mats (Electron Microscopy Sciences, Hatfield, PA) for heavy metal staining. Grids were stained with 3% urnayl acetate in water for 40 minutes, washed and stained with Reynold’s lead citrate for 3 minutes, washed and allowed to dry.
Other methods for flat embedding of cells on coverslips for TEM identification of autophagosomes have been described (Eskelinen, 2008a). These methods differ in fixation and heavy metal treatment and may result in autophagosomes with slightly different morphology.
Electron microscopy
Cells are viewed at low-magnification and low beam to identify the cell of interest based on comparison of the cell morphology under the EM with the confocal GFP image. Serial sections of cells and organelles of interest were then imaged at 10–30,000× magnification.
Results
Resin infiltration and separation of the block from the glass surface
Gridded glass bottom live imaging dishes are most suitable for high resolution live imaging due to the superior optics of glass. Furthermore most cell culture studies have been pre-optimized for glass surfaces when imaging is involved and primary neurons, in particular, are sensitive to changes in the culture surface. Therefore, we sought to work out methodology in which cells grown on gridded glass bottom live imaging dishes could be imaged, processed for TEM and relocated under the electron microscope in a robust yet simple way such that many samples could be processed simultaneously (Hanson, et al., 2010). Such methods could conceivably enable CLEM to become a primary assay system even in a non-EM specialized laboratory with access to both LSCM and basic EM facilities.
After fixation, LSCM imaging, osmication and dehydration in ethanol (see Materials and Methods), the location of the cell of interest was documented by placing the live imaging dish on top of a plastic support on which a dot or square was drawn (arrow, Fig. 1A). The dish was positioned such that the cell was placed exactly on top and in the center of the mark. The position of the dish relative to the mark was then noted by marking the sides of the dish and the plastic surface (arrowheads, Fig. 1). It is important that the cell of interest be located prior to the application of resin or resin/ethanol because the resin makes the coverslip grid invisible and it would be difficult to place the capsule such that the cell of interest is in the middle. This method of capsule placement is simpler in that it ensures that the correct cell is embedded and avoids having to relocate the cell in a large resin surface, trim it under a microscope and the re-embed it onto another block for placement into the ultramicrotome holder.
The oriented dishes were then infiltrated with a resin/ethanol mixture overnight followed by application of a very thin layer of pure resin (Fig. 1A). An open ended BEEM capsule was then placed on the dish with the cell of interest in the middle (Fig. 1B). The thin resin layer was then solidified after which the block was topped off with more resin (Fig. 1C) and again solidified. Gentle heating combined with finger pressure applied to the block resulted in clean separation of the block from the glass surface (Fig. 1D). Only rarely did the glass coverslip break and remain attached to the block. However, if this occurred, the glass coverslip on the block was affixed to a microscope slide using super glue and the heating and separation process was repeated.
Transfer of cells from culture surface to block face was extremely reliable and rarely, if ever, were cells lost during the procedure. Cells located with respect to the grid by brightfield (Fig. 2A) are easily relocated in the block face due to the fact that the grid pattern is transferred from coverslip to the block face (Fig. 2C). This allows precise trimming of the resin around the cell of interest. Morphology of cells was preserved after embedment (compare Fig. 2B and D).
TEM reidentification of GFP-LC3 labeled organelles
HEK293 cells were transfected with GFP-LC3 and treated with 100 nm rapamycin for 2 days, to maximize the number of LC3-labeled organelles with minimum cellular toxicity. The cells were fixed with glutaraldehyde and imaged by LSCM. Prior to fluorescent imaging, the location of the cells of interest (box, Fig. 3) was documented with respect to the gridded coverslip. Using a 10× objective and brightfield illumination both the cells and the grid outline can be clearly seen.
Figure 3.

Low power brightfield micrograph showing the cells of interest with respect to the gridded coverslip. Boxed region was chosen for high magnification DIC/GFP and TEM imaging. Arrowheads point to the grid. The sideways letter “N” is visible under the cells. This grid imprint is also visible on the block face after embedding in resin.
Confocal stacks of the cells, including GFP fluorescence and DIC, were acquired followed by TEM embedding, sectioning and imaging (see Materials and Methods). Two different confocal sections are shown, both with a TEM section that approximately corresponds to the confocal section. Nuclei (numbered in Fig. 4), nucleoli and other large structures were visible in both DIC and TEM sections facilitating the alignment and orientation of the two images. Each GFP-LC3 fluorescent signal (arrowheads, middle panel, Fig. 4) could be mapped onto the corresponding TEM image (arrowheads, right panel, Fig. 4). By LSCM, 6 GFP-LC3 positive profiles (a-f) are visible in section 1 but only 3 (b, e, f) are visible in section 2. In the corresponding low magnification TEM sections shown at right, most of the same LC3 positive organelles are visible. All GFP-LC3 positive profiles were visible in multiple TEM sections making serial analysis possible. Those not visible in the EM sections shown in Fig. 4 were identified in other sections.
Figure 4.

Higher magnification DIC/GFP and TEM images of boxed region in Fig. 3. Cell nuclei are numbered and GFP-LC3 positive autophagosomes are lettered. Individual serial sections are shown in the top and bottom rows. The TEM sections approximate those from LSCM. Profile “f” is not seen in either TEM section but was located in other sections (see Fig. 7).
Serial TEM and confocal sections of GFP-LC3 labeled profile “b” are shown in Fig. 5. Serial sectioning through organelle “b” revealed a complex morphology consisting of several distinct or possibly fusing autophagosome-like organelles. This morphology was evident in multiple sections in both the TEM and LSCM images (Fig. 5).
Figure 5.

Serial TEM and LSCM images through profile “b” shown in Fig. 4. Multiple organelles are seen undergoing a possible fusion process. Inset is higher magnification of area denoted by the arrowhead and shows rough ER in association with a mitochondrion which was frequently observed near sites LC3 positive profiles.
Serial sections of 5 other GFP-LC3 profiles are shown in Figs. 6 and 7. The double membrane structure is shown in the inset in Fig. 6. It should be noted that for many of the GFP-LC3 labeled organelles, there was a juxtaposition of rough ER or mitochondria (arrowheads and asterisks, respectively, Figs. 6 and 7) as has been previously noted (Eskelinen, 2005) in agreement with the potential involvement of these organelles in the biogenesis of autophagosomes.
Figure 6.

Serial TEM images through profiles “a”, “c” and “d” shown in Fig. 4. Magnified inset of box region in top row shows double membrane structure. Asterisks and arrowheads denote mitochondria and rough ER, respectively.
Figure 7.

Serial TEM images through profiles “e” and “f” shown in Fig. 4. Asterisks and arrowheads denote mitochondria and rough ER, respectively.
Highly electron dense material was present inside each GFP-LC3 positive organelle imaged by TEM (Fig. 8) which was mostly amorphous and granular. The morphology of the material inside the autophagosomes was also suggestive of mitochondrial degradation with apparent cristae visible in some cases and the dense amorphous material may also be of ribosomal origin as has been noted (Eskelinen, 2008a; Eskelinen, 2008b).
Figure 8.
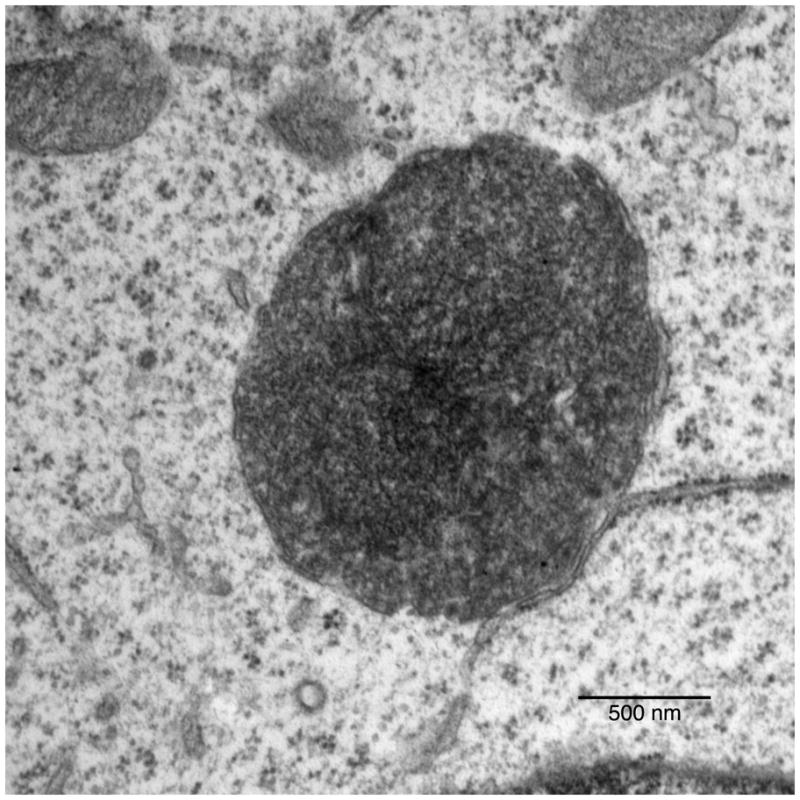
High magnification of GFP-LC3 labeled organelle showing granular material and association with rough ER.
Discussion
We describe here a method for CLEM that makes use of commercially available gridded glass bottom live imaging dishes and simplified embedment and separation of the block from the glass substrate. The use of the gridded live imaging dishes bypasses the need for fabricating gridded substrates (Mironov & Beznoussenko, 2009), allows live imaging before TEM processing, and the two stage block solidification eliminates the transfer and remounting of coverslips or small blocks onto larger stubs (Razi & Tooze, 2009). The use of heat to facilitate separation of the block from the glass substrate also is more effective, does not leave glass behind on the block, and requires less equipment than other methods. For easily identifiable organelles, no post-light level labeling is required, further streamlining the process. This method might be of use to laboratories studying intracellular trafficking of GFP tagged proteins and organelles, in particular, laboratories with access to LSCM and EM facilities and with basic EM expertise. The simplicity of this method allows for routine processing of many samples (Hanson, et al., 2010), keeping them in the same dish all the way through making this streamlined method valuable as a primary assay system. It is conceivable that structure/function studies involving mutant tagged cDNA constructs, and their effects on organelle trafficking or biogenesis, could be facilitated by this method.
Many variations for CLEM have been described each with their own advantages. Some incorporate pre- or post-embed immunolabeling or other enhancement to aid in relocating the organelles of interest after light microscopy. This may be necessary if these organelles are small or relatively sparse. On the other hand we show here that for LC3 positive organelles such as autophagosomes, or for other structures such as lysosomal derived tubules (Hanson, et al., 2010), such immunolabeling is unnecessary and instead the simpler and more robust protocol can be used here and many samples can be processed in a relatively short period of time.
Regarding autophagy, tracking autophagosomes visually by marking with GFP-LC3 has been critical to understanding autophagic induction processes. However, GFP-LC3 can cluster non-specifically, in a manner independent of lipidation, at protein aggregates (Kuma, et al., 2007; Tanida, et al., 2008) and distorted endoplasmic reticulum (Korkhov, 2009). Furthermore the possibility of lipidation-dependent, non-autophagic functions for LC3 is beginning to emerge (Baisamy, et al., 2009; Hanson, et al., 2010). TEM is more reliable for identification of autophagosomes in cells but misidentification of other organelles as autophagosomes can occur (Eskelinen, 2008b). We show here that our method is useful for GFP-LC3 labeled organelles in culture and technically should not be beyond the means of laboratories with access to LSCM and TEM microscopes.
Conclusions
This method should enhance the ability to correctly identify autophagosomes in cultures for quantification and could potentially be used to understand the biogenesis of autophagosomes and their relationship to other organelle systems. Because our method is simple, and can account for and document virtually every GFP-LC3 labeled organelle in a sample, it could potentially be used to supplement one of the standard assays for the verification of GFP-LC3 labeled structures (Klionsky, et al., 2007).
Acknowledgments
We thank Alice Elste for technical advice. Supported by NS051238 and an Irma T. Hirschl Award to GRP.
References
- Baisamy L, Cavin S, Jurisch N, Diviani D. The ubiquitin-like protein LC3 regulates the Rho-GEF activity of AKAP-Lbc. J Biol Chem. 2009;284(41):28232–42. doi: 10.1074/jbc.M109.054668. [DOI] [PMC free article] [PubMed] [Google Scholar]
- Eskelinen EL. Maturation of autophagic vacuoles in Mammalian cells. Autophagy. 2005;1(1):1–10. doi: 10.4161/auto.1.1.1270. [DOI] [PubMed] [Google Scholar]
- Eskelinen EL. Fine structure of the autophagosome. Methods Mol Biol. 2008a;445:11–28. doi: 10.1007/978-1-59745-157-4_2. [DOI] [PubMed] [Google Scholar]
- Eskelinen EL. To be or not to be? Examples of incorrect identification of autophagic compartments in conventional transmission electron microscopy of mammalian cells. Autophagy. 2008b;4(2):257–60. doi: 10.4161/auto.5179. [DOI] [PubMed] [Google Scholar]
- Fernandez-Monreal M, Oung T, Hanson HH, O’Leary R, Janssen WG, Dolios G, Wang R, Phillips GR. Gamma-protocadherins are enriched and transported in specialized vesicles associated with the secretory pathway in neurons. Eur J Neurosci. 2010 doi: 10.1111/j.1460-9568.2010.07386.x. In Press. [DOI] [PMC free article] [PubMed] [Google Scholar]
- Gaietta GM, Giepmans BN, Deerinck TJ, Smith WB, Ngan L, Llopis J, Adams SR, Tsien RY, Ellisman MH. Golgi twins in late mitosis revealed by genetically encoded tags for live cell imaging and correlated electron microscopy. Proc Natl Acad Sci U S A. 2006;103(47):17777–82. doi: 10.1073/pnas.0608509103. [DOI] [PMC free article] [PubMed] [Google Scholar]
- Griffiths G, Parton RG, Lucocq J, van Deurs B, Brown D, Slot JW, Geuze HJ. The immunofluorescent era of membrane traffic. Trends Cell Biol. 1993;3(7):214–9. doi: 10.1016/0962-8924(93)90114-g. [DOI] [PubMed] [Google Scholar]
- Hanson HH, Kang S, Fernandez-Monreal M, Oung T, Yildirim M, Lee R, Suyama K, Hazan RB, Phillips GR. LC3-dependent intracellular membrane tubules induced by gamma-protocadherins A3 and B2: A role for intraluminal interactions. J Biol Chem. 2010;285:20982–20992. doi: 10.1074/jbc.M109.092031. [DOI] [PMC free article] [PubMed] [Google Scholar]
- Keene DR, Tufa SF, Lunstrum GP, Holden P, Horton WA. Confocal/TEM overlay microscopy: a simple method for correlating confocal and electron microscopy of cells expressing GFP/YFP fusion proteins. Microsc Microanal. 2008;14(4):342–8. doi: 10.1017/S1431927608080306. [DOI] [PubMed] [Google Scholar]
- Klionsky DJ, Cuervo AM, Seglen PO. Methods for monitoring autophagy from yeast to human. Autophagy. 2007;3(3):181–206. doi: 10.4161/auto.3678. [DOI] [PubMed] [Google Scholar]
- Korkhov VM. GFP-LC3 labels organised smooth endoplasmic reticulum membranes independently of autophagy. J Cell Biochem. 2009;107(1):86–95. doi: 10.1002/jcb.22103. [DOI] [PMC free article] [PubMed] [Google Scholar]
- Kuma A, Matsui M, Mizushima N. LC3, an autophagosome marker, can be incorporated into protein aggregates independent of autophagy: caution in the interpretation of LC3 localization. Autophagy. 2007;3(4):323–8. doi: 10.4161/auto.4012. [DOI] [PubMed] [Google Scholar]
- Mironov AA, Beznoussenko GV. Correlative microscopy: a potent tool for the study of rare or unique cellular and tissue events. J Microsc. 2009;235(3):308–21. doi: 10.1111/j.1365-2818.2009.03222.x. [DOI] [PubMed] [Google Scholar]
- Polishchuk RS, Mironov AA. Correlative video light/electron microscopy. Curr Protoc Cell Biol. 2001;Chapter 4(Unit 4):8. doi: 10.1002/0471143030.cb0408s11. [DOI] [PubMed] [Google Scholar]
- Razi M, Tooze SA. Correlative light and electron microscopy. Methods Enzymol. 2009;452:261–75. doi: 10.1016/S0076-6879(08)03617-3. [DOI] [PubMed] [Google Scholar]
- Rodriguez A, Ehlenberger D, Kelliher K, Einstein M, Henderson SC, Morrison JH, Hof PR, Wearne SL. Automated reconstruction of three-dimensional neuronal morphology from laser scanning microscopy images. Methods. 2003;30(1):94–105. doi: 10.1016/s1046-2023(03)00011-2. [DOI] [PubMed] [Google Scholar]
- Rodriguez A, Ehlenberger DB, Dickstein DL, Hof PR, Wearne SL. Automated three-dimensional detection and shape classification of dendritic spines from fluorescence microscopy images. PLoS ONE. 2008;3(4):e1997. doi: 10.1371/journal.pone.0001997. [DOI] [PMC free article] [PubMed] [Google Scholar]
- Roth J, Zuber C, Komminoth P, Sata T, Li WP, Heitz PU. Applications of immunogold and lectin-gold labeling in tumor research and diagnosis. Histochem Cell Biol. 1996;106(1):131–48. doi: 10.1007/BF02473207. [DOI] [PubMed] [Google Scholar]
- Tanida I, Yamaji T, Ueno T, Ishiura S, Kominami E, Hanada K. Consideration about negative controls for LC3 and expression vectors for four colored fluorescent protein-LC3 negative controls. Autophagy. 2008;4(1):131–4. doi: 10.4161/auto.5233. [DOI] [PubMed] [Google Scholar]