Abstract
The magnetic resonance contrast of a neuroimaging data set has strong impact on the utility of the data in image analysis tasks, such as registration and segmentation. Lengthy acquisition times often prevent routine acquisition of multiple MR contrast images, and opportunities for detailed analysis using these data would seem to be irrevocably lost. This paper describes an example based approach which uses patch matching from a multiple contrast atlas with the intended goal of generating an alternate MR contrast image, thus effectively simulating alternative pulse sequences from one another. In this paper, we deal specifically with Fluid Attenuated Inversion Recovery (FLAIR) sequence generation from T1 and T2 pulse sequences. The applicability of this synthetic FLAIR for estimating white matter lesions segmentation is demonstrated.
Index Terms: Classification, Image resolution, Image segmentation, MRI
1. INTRODUCTION
A principal goal of the collaboration between the neuroscience and medical imaging communities is the accurate segmentation of brain structures, with a view towards offering insight about the normal and abnormal features of a brain. Several methods [1, 2] have been proposed to find cortical and sub-cortical structures. These methods are intrinsically dependent on the modality and the contrast between tissues. In this paper, we propose a method to alter the modality of a magnetic resonance (MR) image, thereby changing intrinsic contrast.
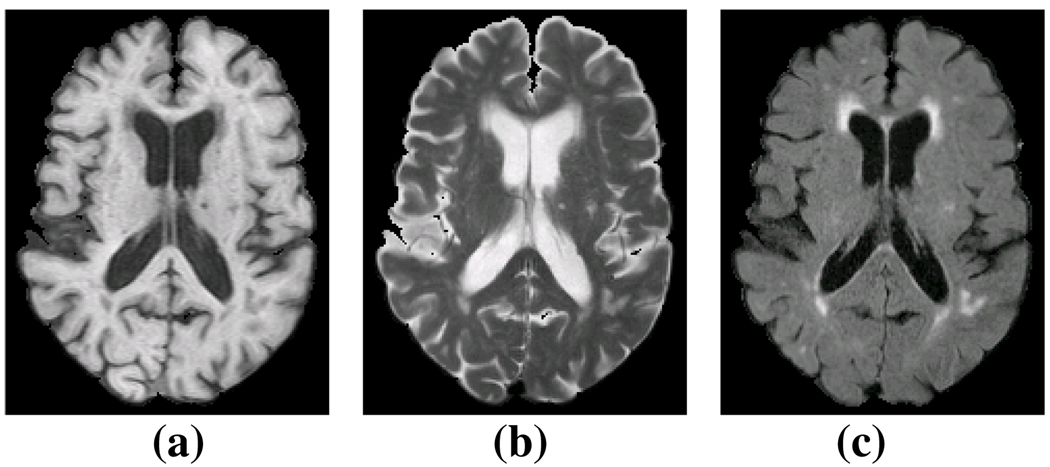
Image contrast is the cornerstone of many tissue classification algorithms. Recent research has demonstrated that knowledge of all modalities [3] or imaging parameters [4] can improve the segmentation quality, but this is not an optimal solution for many studies. Often, not all MR modalities of an image are acquired for reasons such as cost and time constraints, thus losing an opportunity for detailed multi-modal analysis. In the case of medical imaging of the brain, there is a huge variability in the structures and tissues under observation and the choice of acquisition protocol and underlying image contrast can affect the viability of data. More specifically, it is well established that white matter lesions (WML) are most prominent in Fluid Attenuated Inversion Recovery (FLAIR) images, while conventional T1, T2, and PD weighted sequences provide relatively poor contrast for WML [5]. Fig. 1(c) shows the contrast of lesions in a FLAIR image compared to its T1 (Fig. 1(a)) and T2 (Fig. 1(b)). Most recent lesion segmentation algorithms try to use the lesion information from FLAIR [6, 7], although some use T1, T2, and PD to detect lesions [8]. In this paper, we show how to synthesize images that have FLAIR-like contrast for enhanced lesion detection.
Fig. 1.
(a) a T1 weighted spoiled gradient recalled (SPGR) image, (b) the T2 and (c) FLAIR acquisitions of the same subject.
Our approach is based upon the technique known as image hallucination. Image hallucination [9] is typically used to generate a high-resolution image from multiple low-resolution acquisitions; in contrast, we use multiple modalities to generate an alternate modality. The image hallucination approach can be grouped into two major categories, Bayesian [10] and example-based [11]. Bayesian approaches are often formulated as a constrained optimization problem where the imaging process is known and the high resolution image is the maximum likelihood estimator of a cost function given one or more low resolution images. Example-based hallucination techniques rely on training data from a codebook or atlas [12] consisting of one or more high resolution images. These methods are learning based, where the training data at high resolution informs the algorithm how to extract fine details from the low resolution data.
In this paper, we build upon concepts borrowed from image hallucination to generate synthetic FLAIR images from a set of T1 and T2 acquisitions. We first describe our example based image hallucination technique, then we validate the usefulness of synthetic FLAIRs by comparing the lesions computed from both the synthetic FLAIR and a true FLAIR by using a WML segmentation tool [7]. We also show that the lesion segmentations obtained with synthetic FLAIRs are consistent with segmentations produced using real FLAIR images.
2. METHODS
2.1. FLAIR Synthesis
Given two registered images with T1 and T2-weighted MR contrasts, fT1 and fT2, we want to generate the corresponding FLAIR image, fFL. The images are related by a function W, which depends on underlying T1, T2 relaxation times, and other intrinsic acquistion based parameters such as pulse repetition time and flip angle. This can be expressed as
| (1) |
where η is noise. If W and the underlying parameters are known then fFL can be directly estimated [4]. However, for most studies these quantities are not precisely known, and the complexity of the acquisition process is difficult to precisely model; thus W is rarely known. For this reason, our strategy is to estimate fFL from fT1 and fT2 using an atlas.
We define an atlas as a set of co-registered images 𝒜 = {gT1, gT2, gFL, hL} acquired from a “model” subject g, where gT1, gT2 and gFL are T1, T2, and FLAIR images and hL is a hard segmentation of the lesions. Assume that both f and g are composed of patches fT1(i), fT2(i), and gT1(j), gT2(j), gFL(j), centered at voxels i ∈ Ωf, j ∈ Ωg, where Ωf and Ωg are the image domains of f and g respectively. In our experiments, we have used a regular partitioning of the image domains by 3 × 3 × 2 non-overlapping patches.
We can then generate a synthetic FLAIR image f̂FL from the collection of patches f̂FL(i), i ∈ Ωf, as
| (2) |
where ℱ is a non-local means (NLM) operator [12, 13] and
| (3) |
Here, λ is a smoothing weight, ℛ is a smoothing function on the atlas gT1 and gT2, and wT1 and wT2 are spatially varying weighting functions, explained later. ℛ makes sure that the patches gT1(j) and gT2(j) are chosen such that the boundaries between two neighboring patches in the reconstructed f̂FL remain smooth [12]. We use the following smoothness function:
| (4) |
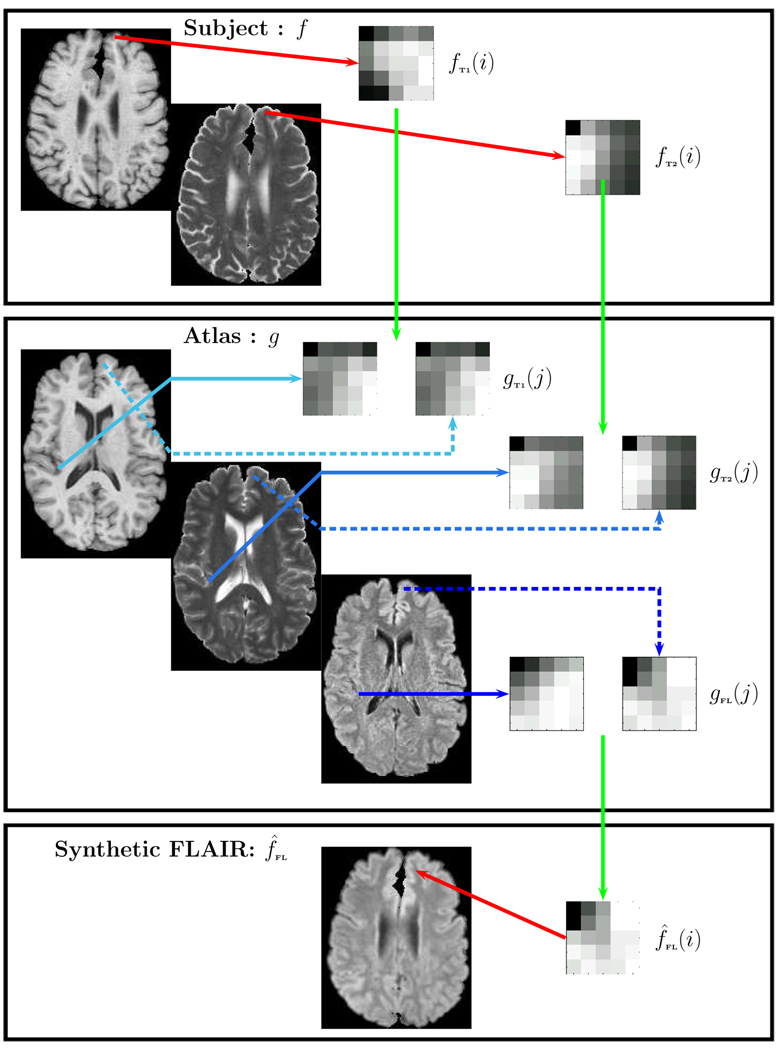
Ni and Nj are the neighborhoods of i and j in their respective image domains. Eq. 2 is solved using a search on all the patch pairs {gT1(j), gT2(j)}, j ∈ Ωg. The algorithm is visually explained in Fig. 2. Instead of just taking any patch that minimizes Eqn. 2, a weighted average of the “best matching patches” on Ωg are used. They are defined to be those patches for which the errors from Eqn. 3 are the lowest 1% obtained from all the patches. Define Ω as the set of all “best matching patches”, with Ω ⊂ Ωg, for the patch pair {fT1(i), fT2(i)} obtained from Eqn. 2. The non-local means filtered patch is obtained from:
where,
and β1 and β2 are empirically chosen smoothing parameters for NLM and Z is a normalizing constant such that ∑k ∈ Ω wNLM(k, i) = 1. Thus, the algorithm can be described as:
For the ith patch pair {fT1(i), fT2(i)} in f, search in Ωg for the best matching patches {gT1(j), gT2(j); j ∈ Ωg} from g to solve Eqn. 2.
Construct the ith patch in f̂FL as a non-local weighted average of gFL(j)’s, j ∈ Ω ⊂ Ωg.
Fig. 2.
From the subject we take the ith patch pair {fT1(i), fT2(i)} and identify the best possible matching pairs {gT1(j), gT2(j); j ∈ Ω}. The corresponding FLAIR patches {gFL(j); j ∈ Ω} are recombined using a non-local means approach to generate the synthetic FLAIR patch f̂FL(i). The merging of all such patches generate the synthetic FLAIR f̂FL.
2.2. Choice of atlas and weighting functions wT1 and wT2
Our atlas consists of a set of registered T1, T2, and FLAIR images of a subject with WML and the segmentation of WML in the atlas is known beforehand in hL. The search of optimal patches in the atlas space Ωg depends on the choice of weighting functions wT1 and wT2. Given that the lesions in T1 and T2 have similar intensity as cerebrospinal fluid (CSF), we impose a spatial prior onto the search space of Ωg. We use the fact that lesions mostly occur near ventricles or inside WM. This motivates the use of the hard segmentation of fT1 as the spatial prior. We use the Topology Preserving Anatomy Driven Segmentation (TOADS) method [2] to find a coarse hard segmentation. TOADS is an atlas based topology preserving approach and by increasing the atlas weighting of the algorithm, lesions are classified as white matter (WM). To distinguish between true CSF and lesions, we impose the following conditions on the search space,
3. RESULTS
3.1. Validation on Lesion Free Data
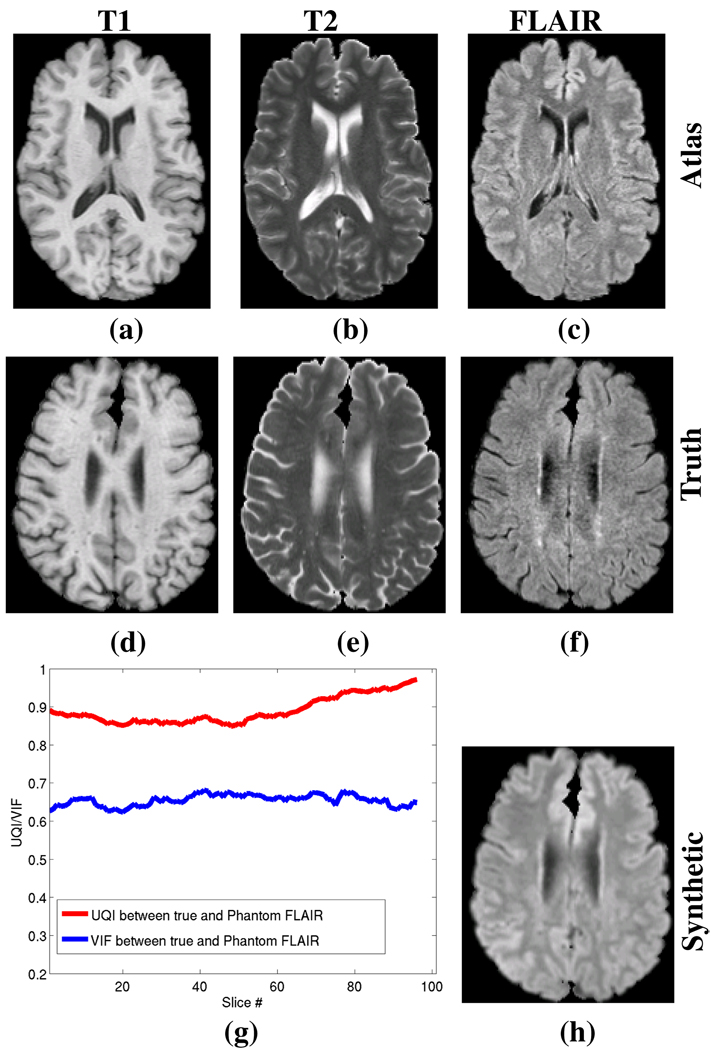
Our first validation experiment is to generate a synthetic FLAIR from a subject for which we have a true FLAIR which we use for comparison. This subject is known to be lesion free. Fig. 3 shows the subject without lesions and the atlas used to generate the synthetic FLAIR. To evaluate their differences, we use the universal image quality index (UQI) [14] and the visual information fidelity (VIF) [15] as similarity metrics between the two images. The UQI and VIF are two metrics that replicate the behavior of human visual system models and both are considered consistent with subjective quality measurements. Fig. 3(g) shows the VIF and the UQI between Fig. 3(f) and Fig. 3(h) for each of the slices.
Fig. 3.
Synthetic FLAIR generation from real data for a subject with no lesions. (a) T1 atlas (gT1), (b) T2 atlas (gT2), (c) FLAIR atlas (gFL), (d) subject T1 (fT1), (e) subject T2 (fT2), (f) subject true FLAIR (fFL), (h) Synthetic FLAIR (f̂FL) generated from the subjects T1 and T2. (g) shows the Universal Image Quality Index (UQI) and the Visual Information Fidelity (VIF) between the true and synthetic FLAIRs for each slice of the image volume. The maximum possible score for each measure is 1.
3.2. Lesion Data
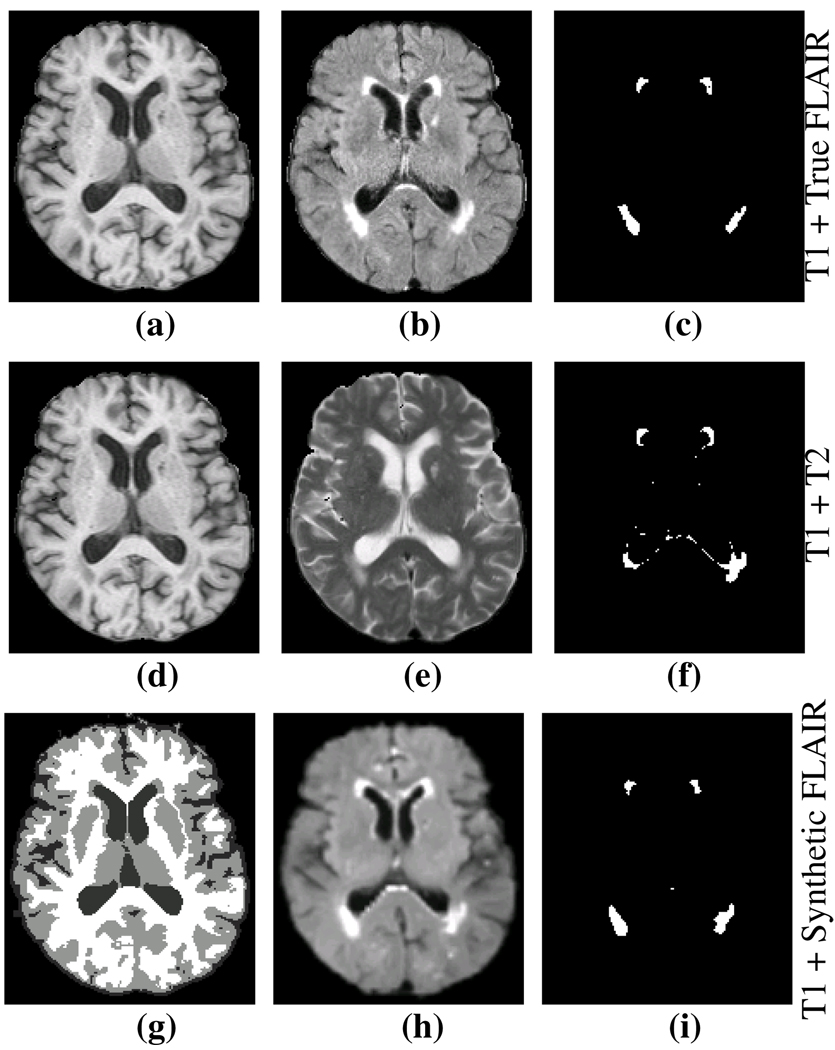
We applied our algorithm to real data with lesions to show that the lesion segmentation provides FLAIR-like results when using the combination of synthetic FLAIR and T1 as input channels in comparison to input channels of T1 and T2. All of the lesion segmentations were generated using a validated multi-channel lesion segmentation tool [7]. Fig. 4(c) shows the results of using the combinations of T1 and true FLAIR, which we use as the reference standard. Fig. 4(f) shows the lesion segmentation from T1 and T2 as input channel. Finally Fig. 4(i) shows the lesion segmentation from T1 and synthetic FLAIR as input channels. For Fig. 4(f) and (i), we computed the Dice coefficient [16] with the reference Fig. 4(c). For the data set shown in Fig. 4, the Dice coefficient of lesion segmentation between the T1 and T2 compared to the reference was 0.49, while the T1 and synthetic FLAIR compared to the reference was 0.75. We repeated this experiment on an additional 14 subjects with the results shown in Table 1. Because of their challenging nature, Dice scores of 0.6–0.7 for lesion segmentation are considered quite successful [17].
Fig. 4.
(a) Subject T1, (b) true FLAIR, (c) segmented lesions using T1 + true FLAIR, (d) T1, (e) T2, (f) segmented lesions using T1 + T2, (g) Segmentation of T1 which is the spatial prior, (h) Synthetic FLAIR, (i) segmented lesions using the T1 + synthetic FLAIR. The Dice coefficient between (c) and (f) is 0.49, while it is 0.75 between (c) and (i).
Table 1.
The table shows the results of comparing the best available lesion segmentation reference (using T1 + true FLAIR data) compared to T1 + T2 and T1 + synthetic FLAIR on 14 subjects. Our synthetic FLAIR almost doubles the accuracy in estimating the lesions.
| Dice | Mean | Std. Dev. |
|---|---|---|
| T1 + T2 | 0.338 | 0.140 |
| T1 + Synthetic FLAIR | 0.653 | 0.095 |
4. DISCUSSION AND CONCLUSION
We have proposed an atlas based image synthesis technique to synthesize an alternate modality of an MR image. We focused this paper on the application to enhancing lesion detection in the absence of an appropriate lesion distinguishing modality, namely FLAIR, though we believe there is broader applicability of this type of image hallucination from a rich atlas set. We expect that increasing the training set to include multiple number of atlases would further improve results significantly.
ACKNOWLEDGMENTS
This research was supported in part by the Intramural Research Program of the NIH, National Institute on Aging. We are grateful to Dr. Susan Resnick and all the participants of the Baltimore Longitudinal Study on Aging, as well as the neuroimaging staff for their dedication to these studies.
This work was supported by the NIH/NINDS under grant 5R01NS037747.
Contributor Information
Snehashis Roy, Email: snehashisr@jhu.edu.
Aaron Carass, Email: aaron_carass@jhu.edu.
Navid Shiee, Email: navid@jhu.edu.
Dzung L. Pham, Email: pham@jhu.edu.
Jerry L. Prince, Email: prince@jhu.edu.
REFERENCES
- 1.Dale AM, Fischl B, Sereno MI. Cortical Surface-Based Analysis i: Segmentation and Surface Reconstruction. NeuroImage. 1999;vol. 9(no. 2):179–194. doi: 10.1006/nimg.1998.0395. [DOI] [PubMed] [Google Scholar]
- 2.Bazin PL, Pham DL. Topology-Preserving Tissue Classification of Magnetic Resonance Brain Images. IEEE Trans. on Med. Imag. 2007;vol. 26(no. 4):487–498. doi: 10.1109/TMI.2007.893283. [DOI] [PubMed] [Google Scholar]
- 3.Hong X, McClean S, Scotney B, Morrow P. Model-Based Segmentation of Multimodal Images. Comp. Anal. of Images and Patterns. 2007;vol. 4672:604–611. [Google Scholar]
- 4.Fischl B, Salat DH, van der Kouwe AJW, Makris N, Segonne F, Quinn BT, Dale AM. Sequence-independent Segmentation of Magnetic Resonance Images. NeuroImage. 2004;vol. 23:S69–S84. doi: 10.1016/j.neuroimage.2004.07.016. [DOI] [PubMed] [Google Scholar]
- 5.Filippi M, Yousry T, Baratti C, Horsfield MA, Mammi S, Becker C, Voltz R, Spuler S, Campi A, Reiser MF, Comi G. Quantitative Assessment of MRI Lesion Load in Multiple Sclerosis, A comparison of conventional spin-echo with fast fluidattenuated inversion recovery. Brain. 1996;vol. 119:1349–1355. doi: 10.1093/brain/119.4.1349. [DOI] [PubMed] [Google Scholar]
- 6.Lecoeur J, Ferr JC, Barillot C. Optimized Supervised Segmentation of MS Lesions from Multispectral MRIs. MICCAI workshop on Med. Image Anal. on Multiple Sclerosis. 2009 [Google Scholar]
- 7.Shiee N, Bazin PL, Ozturk A, Reich DS, Calabresi PA, Pham DL. A Topology-Preserving Approach to the Segmentation of Brain Images with Multiple Sclerosis Lesions. NeuroImage. 2009 doi: 10.1016/j.neuroimage.2009.09.005. [DOI] [PMC free article] [PubMed] [Google Scholar]
- 8.Harmouche R, Collins L, Arnold D, Francis S, Arbel T. Bayesian MS Lesion Classification Modeling Regional and Local Spatial Information; IEEE Intl. Conf. Patt. Recog; 2006. pp. 984–987. [Google Scholar]
- 9.Hunt BR. Super-Resolution of Images: Algorithms, Principles, Performance. Intl. Journal of Imag. Sys. and Tech. 1995;vol. 6(no. 4):297–304. [Google Scholar]
- 10.Sun J, Zheng NN, Tao H, Shum HY. Image Hallucination with Primal Sketch Priors; IEEE Conf. Comp. Vision and Patt. Recog; 2003. pp. 729–736. [Google Scholar]
- 11.Freeman WT, Jones TR, Pasztor EC. Example-Based Super-Resolution. IEEE Comp. Graphics. 2002;vol. 22(no. 2):56–65. [Google Scholar]
- 12.Rousseaui F. Brain Hallucination; European Conf. on Comp. Vision; 2008. pp. 497–508. [Google Scholar]
- 13.Buades A, Coll B, Morel JM. A Non-Local Algorithm for Image Denoising. IEEE Comp. Vision and Patt. Recog. 2005;vol. 2:60–65. [Google Scholar]
- 14.Sheikh HR, Bovik AC, de Veciana G. An Information Fidelity Criterion for Image Quality Assessment using Natural Scene Statistics. IEEE Trans. on Image Proc. 2005;vol. 14(no. 12):2117–2128. doi: 10.1109/tip.2005.859389. [DOI] [PubMed] [Google Scholar]
- 15.Wang Z, Bovik AC. A Universal Image Quality Index. IEEE Signal Proc. Letters. 2002;vol. 9(no. 3):81–84. [Google Scholar]
- 16.Dice LR. Measure of the amount of ecological association between species. Ecology. 1945;vol. 26:297–302. [Google Scholar]
- 17.Zijdenbos AP, Forghani R, Evans AC. Automatic ”Pipeline” Analysis of 3-D MRI Data for Clinical Trials: Application to Multiple Sclerosis. IEEE Trans. Med. Imaging. 2002;vol. 21(no. 10):1280–1291. doi: 10.1109/TMI.2002.806283. [DOI] [PubMed] [Google Scholar]


