

Abstract
Objectives
Disease transmission dynamics among members of a sexual network’s core group make the group an ideal target for prevention for positives. Identifying the geographic territory of an HIV/AIDS core group is complicated by the numerous factors that may spatially structure cases including alcohol availability. We employ spatial analytic methods in an attempt to identify the geographic distribution of the core HIV/AIDS group.
Methods
Five year HIV/AIDS detection rates were analyzed for each HIV/AIDS risk category (i.e., MSM, IDU, HRH) at the census tract level (n = 164) in New Orleans using spatial analytic techniques in multivariate models.
Results
MSM was the most common risk category for newly detected HIV cases. Both MSM and IDU cases appeared to decline or enter an endemic phase. Each risk category exhibited unique spatial structure. Among IDUs and HRHs nearly all the spatial structure was explained in terms of the independent variables. However, among MSMs residual spatial structure remained after controlling for independent variables.
Conclusions
Residual spatial structure in the MSM HIV/AIDS detection rates after controlling for social structure could be explained by the presence of core group members. The study’s limitations are noted.
Keywords: HIV/AIDS, sexual networks, spatial analysis, alcohol availability, core group, disease transmission
Introduction
The development of successful antiretroviral therapy (ART) has shifted the focus of HIV/AIDS prevention efforts in the United States from uninfected individuals in high-risk populations to persons living with HIV/AIDS (PLWHA; Janssen et al., 2001; Janssen and Valdiserri, 2004). Central to the “prevention for positives” approach are targeted screening and contact tracing to identify previously undiagnosed human immunodeficiency virus (HIV) infections. It has been shown that self-knowledge of infection is associated with significant behavior change (Janssen and Valdiserri, 2004; Weinhardt, Carey, Johnson, and Bickham, 1999). According to Janssen (Janssen and Valdiserri, 2004), 25% of PLWHA are unaware of their status, and those unaware of their status account for an estimated 55% of new HIV infections. Unfortunately, current approaches to targeted screening (e.g., jails, emergency rooms) only reach the fringe of sexual networks in which undiagnosed positives exist. This reality has led researchers to revisit the sexual network approach in hopes of identifying areas with high rates of disease transmission and targeting appropriate outreach (Blanchard et al., 1998).
The core group of a sexual network represents the epidemiologic “bull’s-eye” for preventive approaches targeting PLWHA (Wasserheit and Aral, 1996). The core group represents a subgroup of individuals within a sexual network whose behavior assures either the maintenance or the spread of the HIV virus (Brunham, 1997; Ghani and Garnett, 2000; Thomas and Tucker, 1996). What makes core group members distinct from other PLWHA is that they account for a disproportionately high number of sexual contacts within any network, and their activities amplify the reproductive rate. Thus, the disease proliferates during epidemic periods and is maintained during endemic periods (Aral, 2002).
Sexual network analysis has shown that core group dynamics have implications for both public health theory and practice. First, PLWHA residing in core group areas tend to be spatially clustered with some studies showing a mean distance between all partners of only 0.399 km (Zenilman, Ellish, Fresia, and Glass, 1999). Second, mathematical models demonstrated that core group dynamics impact the reproductive rate of an STD, and that these dynamics interact with the epidemic phase to create unique disease topographies with core groups fueling epidemics or maintaining endemicity (Blanchard, 2002; Boily, Lowndes, and Alary, 2002; Brunham, 1997). Finally, empirically based research identified distinct network structures and core group(s), highlighted the critical role a core group plays in disease incidence, and revealed targeted interventions that could disrupt core dependencies (Blanchard et al., 1998; Jolly, Muth, Wylie, and Potterat, 2001; Wylie and Jolly, 2001). These studies clearly identified the utility of targeting core groups in order to reduce the public health burden for “traditional” STDs (Wasserheit and Aral, 1996) and suggest that similar methods may be applicable to preventing the further spread of HIV/AIDS. There is thus an intuitive link between core group identification and the current “prevention for positives” strategy.
It is believed that efforts to identify and reach core groups will stabilize if not reduce the disease rate. However, research designed to spatially identify STD core groups has yielded mixed results due largely to the need to incorporate methodologies from a variety of disciplines and differences in how concepts are operationalized. For example, Law, Serre, Christakos, Leone, and Miller (2004) found that spatial analysis can be used to better define core group areas geographically. Their approach took into account spatial variability and core group membership but did not account for other factors that cause STD cases to be spatially clustered. In contrast, this study is designed to conduct a spatial analysis at the census tract level that will also account for the other factors that cause HIV cases to be spatially clustered.
Traditionally, identification of core groups within sexual networks has been done through generating network maps from contact interviews. However, that methodology is considered largely impractical for widespread prevention programming as it is time consuming and prohibitively costly in terms of human and fiscal resources (Aral, 2000; Blanchard, 2002). Spatial analysis of surveillance builds upon network analysis. Network analyses have shown that core group members tend to reside in relative geographic proximity compared with peripheral members of the network (Blanchard et al., 1998; Potterat et al., 2002). As a result, the rate of transmission among core group members to their local contacts may represent a source contributing spatial structure within HIV/AIDS surveillance data. Disproportionately high rates of disease may therefore occur where core group members reside. Unfortunately, the spatial structuring of HIV/AIDS surveillance data due to the presence of core group members may be masked by social interactions and attributes that contribute to additional spatial clustering of HIV/AIDS cases. The effect of these social interactions can be classified as either compositional effects—the grouping of individuals explained by shared individual characteristics such as socioeconomic status—or contextual effects—the grouping of individuals explained by the characteristics of the area (e.g., alcohol outlet density, economic disadvantage; Diez Roux, 2002; Scribner, Cohen, and Fisher, 2000). Consequently, there are multiple factors that spatially cluster data and could potentially mask the spatial structure within HIV data caused by the presence of core group members in a particular geographic area. Complicating the situation for the HIV/AIDS epidemic is the fact that the HIV/AIDS surveillance data reflect a composite of separate epidemics among various risk groups, such as men who have sex with men (MSM), injection drug users (IDU), and high-risk heterosexuals (HRH), with each group possessing its own unique mix of risk factors, thus necessitating separate analyses within each population.
Geospatial methods that can disentangle spatial structure for HIV/AIDS from spatially structured social correlates have recently been developed. These methods distinguish between a spatial awareness approach to data, which assumes that place matters, but does not explicitly explore it, and a truly geographical approach which tests for independent spatial relationships (Weeks, 2004). The spatial awareness approach speaks to traditional statistical modeling, which treats place in a non-spatial manner, controlling for it as an independent variable in regression equations without actually accounting for physical space (Weeks, 2004). True spatial methods assign a physical location to variables of interest and test for clustering based upon proximity, which accounts for a real location in physical space. Indicators such as the global Moran’s I and local indices of spatial association (LISA) measure true spatial correlation of variables through proximity.
Given the impact that core groups have on disease proliferation and the constraints of contact tracing, the goal of this research was to determine whether recently developed spatial analytic methods could be used to distinguish between the various factors contributing to the spatial structure that exists in HIV/AIDS surveillance data. Such methodology takes advantage of that fact that the compositional and contextual effects that tend to group HIV/AIDS cases according to risk factors have their own spatial structure. Analyses that control for those risk factors would therefore account for the portion of the spatial structure attributable to them. Any spatial structure that remains independent of the compositional/contextual spatial structures would then be evident in regression residuals after controlling for the specific risk factors. It follows that if one controls for all risk factors that contribute to the spatial structure of HIV/AIDS rates, the resulting analysis would find no spatial structure remaining in the residual. However, if spatial structure remained in the residual it would indicate the presence of an unmeasured factor(s) that theoretically would include the presence of core group members residing in adjacent areas.
In this study we conduct a spatial analysis of the HIV/AIDS epidemic in New Orleans in order to explain the spatial structure of the epidemic in terms of its constituent parts. Given that our goal is to identify a spatial structure that can be conceivably attributed to core group presence from surveillance data, we examine data from the decline phase of the epidemic when the core group is believed to have its greatest effect on maintaining transmission (Potterat et al., 2002; Wasserheit and Aral, 1996). We also consider the role the presence of alcohol outlets may have in explaining the spatial structure of HIV/AIDS cases in light of our previous research demonstrating a geographic association between alcohol outlet density and gonorrhea rates in New Orleans (Scribner, Cohen, and Farley, 1998). This application serves both to identify areas for the targeting of HIV prevention messages—“prevention for positives”—and to move the identification of core group geographies beyond non-spatial methodology into a truly geographic realm.
Materials and Methods
Orleans Parish is one of 64 parishes (counties) in the state of Louisiana. It is largely urban, with a population of 473,681 in 2000 and a per capita income of only $17,258 (United States Census Bureau, 2000). Twenty-eight percent of the population lives below the poverty line, and the parish is marked by an unemployment rate of 5.5% with 42% of the population not in the labor force (United States Census Bureau, 2000).
Orleans Parish accounted for 40% of all HIV cases (total cases 8,202) statewide through 2000 (Broyles, 2000). The epidemiological profile for this parish shifted in the 1990s, as it did for much of the United States, from a steady upward progression of disease cases to a maintained cycle of endemicity. The number of new cases reported through the state’s HIV reporting network rose each year from the beginning of the epidemic in the 1980s through 1993. Overall, new cases in the general population declined between 1994 and 1998. However, incidence in specific subpopulations remained constant or increased.
Study Population
The study population included individuals 18 years of age or older residing in Orleans Parish with lab-confirmed HIV infection whose diagnosis was reported to the Louisiana HIV/AIDS Reporting System (HARS) between January 1994 and December 1998. All cases met the Centers for Disease Control and Prevention (CDC) diagnostic criteria as modified in 1993. Because HIV is a reportable disease, all lab-confirmed positive cases are required to be reported to the Louisiana Office of Public Health. These cases are entered into the HARS database, which therefore contains surveillance information reported by both public and private physicians. All cases reported through HARS were verified by the Louisiana Office of Public Health HIV/AIDS Program (LA OPH HAP) disease intervention staff through patient interviews and chart reviews. The HARS database included the home address of each case at the time of diagnosis and risk category of each case as defined by CDC criteria. Data by age and race/ethnicity were not made available due to confidentiality concerns. HARS data represent only those who have been tested for HIV. Given the earlier reported studies on undertesting, the actual HIV positive population may therefore be underrepresented.
Data Sources
Spatial analysis necessitated construction of a neighborhood-level database that drew upon several different data sources. A neighborhood was defined as a census tract in accordance with best practices (Krieger, Waterman, Chen, Soobader, and Subramanian, 2003). Data sources included: HIV/AIDS cases for individuals residing in Orleans Parish at the time of their diagnosis that were reported to HARS between 1994 and 1998; 1990 U.S. Census Bureau data for Orleans Parish; and Louisiana Alcohol and Tobacco Control (ATC) license data for 1997. The census tract level was chosen because of the homogeneity within census tracts in terms of the residential population (race/ethnicity, SES) and the material aspects of the risk environment evidenced in prior studies of the area (Cohen et al., 2000; Scribner, Cohen, Kaplan, and Allen, 1999; Scribner et al., 1998). Non-residential census tracts, defined as tracts with a population of less than 500 persons or a population density less than 2000 persons per square mile, were omitted from the analysis in order to exclude tracts that were entirely industrial, commercial, or rural. After removing these tracts, 164 of the original 184 tracts remained.
HIV cases reported in the HARS database were address-matched using MapInfo® software. Sixty-nine percent of the cases were successfully matched. The majority of unmatched cases were due to absent or incomplete address data. No significant differences in geocoding rates were noted across the major risk categories except a small deficit among those cases in the “unknown risk” category (63%, p < .05). The geocoded cases were aggregated by census tract and a cumulative 5-year HIV incidence was calculated for each tract based on the aggregate number of cases. Separate 5-year incidence rates at the census tract level were also determined for each of the major HIV/AIDS risk categories including MSM, HRH, and IDU. Risk category–specific incidence rates use total census tract population as the denominator due to the unavailability of risk category–specific population estimates. Confidentiality was maintained by the Louisiana Office of Public Health by releasing the HARS data to researchers at this aggregate level.
Louisiana ATC 1997 license data were used to determine alcohol outlet densities at the census tract level. This was done by geocoding outlet addresses and aggregating by census tract to determine the alcohol outlet density per person for each tract. On-premise (i.e., bars and restaurants) and off-premise (i.e., conveniences stores, liquor stores, supermarkets) licenses were used in determining separate outlet density variables. Alcohol outlets were geocoded at a rate of 95%. Because previous research had shown a relationship between alcohol outlet density and STDs (Scribner et al., 1998), researchers hypothesized that there would be a positive relationship between HIV incidence and density.
Several proxy measurements of material deprivation and socioeconomic status were calculated for each tract using the 1990 census data, again drawing upon previous research to ascertain the most relevant measures (Cohen et al., 2000). Material deprivation was thus assessed using the proportion of houses determined in 1990 to be vacant compared to the number of all housing units. Socioeconomic status for a census tract was determined using the percentage of households in poverty within a tract according to federal definitions.
Data Analysis
Statistical and spatial models were run using GeoDa™ (Anselin, 2004) software. The specific steps to carrying out the analysis are detailed below and summarized in Table 1.
Table 1.
Statistical and Spatial Analyses
| Step | Calculation | Purpose |
|---|---|---|
| 1. | Calculate global Moran’s I on overall HIV rate, and risk group–specific rates | This depicts the strength of clustering Within the dependant variable |
| 2. | Run LISA analysis for risk group–specific rates to determine location of census tracts with HIV rates above and below those predicted based upon random (Poisson) distribution | This shows where there are risk Group–specific disease clusters |
| 3. | Run OLS regression and calculate Moran’s I on residual | This controls for shared social characteristics reflected in the residual If clustering in the residual persists, as evidenced by the Moran’s I, the clustering may be due to a network structure or other unmeasured variables |
| 4. | Run maximum likelihood regression which controls for spatial clustering (Lambda) | If Lambda is significant and there is an improvement in the model, an unmeasured confounder exists If there is an improvement of fit, perform Step 5 |
| 5. | Run LISA on residual of residual of OLS regression | This will show the geographic location of the confounder |
In the first step, a Moran’s I test for global clustering was performed on the outcomes of interest: the overall tract-level HIV rate, and the risk group–specific rates (i.e., MSM rate, HRH rate, and IDU rate). The global Moran’s I measured spatial autocorrelation, or the degree to which census tracts with high or low rates are independent of the rates in adjacent census tracts. Non-independence is assumed to reflect shared underlying social, environmental, and/or geographic associations causing the spatial structuring of the data. A global value that approaches +1 indicates a high degree of clustering, whereas a value approaching −1 indicates a high degree of dispersion. In addition to the global Moran’s I, a map of each census tracts’ contribution to the global Moran statistic was developed. The map demonstrates areas where local indices of spatial autocorrelation (LISA) are clustered as either high rate tracts next to other high rate tracts (high high) or low rate tracts next to other low rate tracts (low low; Anselin, 1995). This is known as a LISA map.
Next, ordinary least squared (OLS) regressions were run on the overall census tract rates and the risk-specific HIV rates controlling for a variety of compositional and contextual variables assessing social (e.g., census tract SES) and environmental (i.e., alcohol outlet density) predictors of HIV. Backward stepwise models were run on the overall rate and the same variables were retained in subsequent models. The Moran’s I test for global clustering was calculated on the residual of the regression to determine whether or not spatial clustering persisted after controlling for social and environmental predictors of HIV that might have a shared spatial structure.
Third, maximum likelihood (ML) regression for spatial error was run. The model introduces a spatial error term into the regression which accounts for residual spatial autocorrelation as a nuisance parameter (lambda). If lambda is significant, spatial autocorrelation remains in HIV rates after controlling for the predictors in the model. Any remaining spatial autocorrelation indicates an unmeasured predictor of the HIV rate exists.
Finally, a LISA map was created for the residual of those adjusted OLS regression models with a significant lambda. This map demonstrates the locations where significant clustering of HIV rates remains after controlling for significant social and environmental predictors of HIV. Comparison of this LISA map with the original LISA map of the unadjusted HIV rate before the regression reveals specific locations where residual spatial autocorrelation exist. Because members of a disease core group have been shown to live in close proximity to one another (Blanchard et al., 1998; Potterat et al., 1985), we hypothesize that this proximity may account for the otherwise unexplained spatial autocorrelation of MSM HIV rates. Thus, the final LISA map identifies the tracts where potential core group members reside.
Results of the LISA tests for each risk group were brought into a GIS environment. Maps depicting only the census tracts of overlap for different risk groups were created using ArcInfo® 9 (Arcgis 9, 2004).
Results
HIV Trends
Between 1993 and 1999, the largest change in new reports of HIV diagnoses occurred in the MSM risk category (Figure 1). Newly reported cases decreased by more than one third, indicating that the epidemic for MSM was in the decline phase. While there was a large gap between the number of MSM diagnoses and IDU and HRH in the early 1990s, this gap dropped dramatically by the end of the decade. As Figure 1 shows, IDU and HRH cases were relatively equal in magnitude at the beginning of the decade; newly reported IDU cases began dropping around 1996 and decreased by nearly a third from 1996 to 1999 as well. HRH cases remained relatively constant and nearly equaled the number of MSM cases by 1999. For MSM and IDU the epidemic was in the decline or endemic phases.
Figure 1.
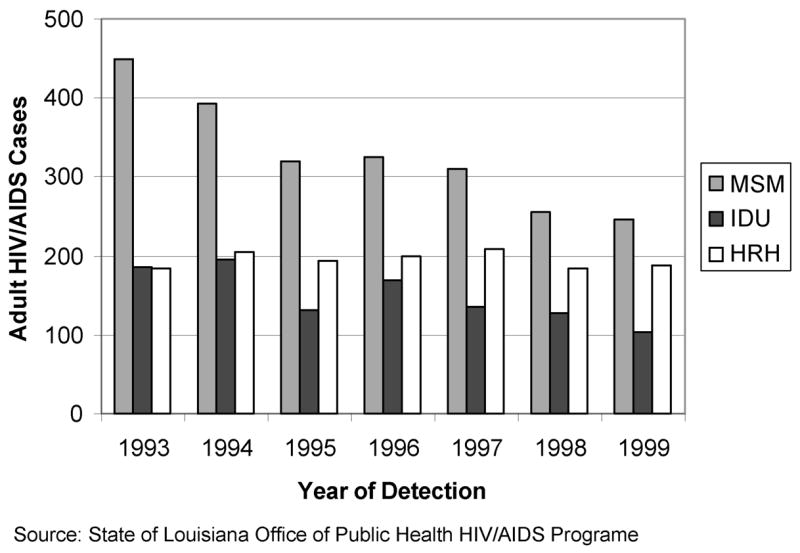
Trends in adult HIV/AIDS cases in Orleans Parish by exposure category, 1993–1999.
Spatial Analysis
The analysis of overall HIV rates yielded a Moran’s I of 0.577, indicating a high degree of clustering of HIV rates at the census tract level (Table 2). Of the risk group–specific HIV rates, the MSM group demonstrated the highest degree of clustering with a Moran’s I of 0.521. Clustering was also evident in the IDU and HRH groups, although at a lower level, as indicated in the base rates column in Table 2.
Table 2.
Global clustering, OLS regression, and maximum likelihood for spatial error on overall HIV rates and risk-specific rates for New Orleans 1994–1999
| General HIV rate
|
MSM HIV rate
|
IDU HIV rate
|
HRH HIV rate
|
|||||||||
|---|---|---|---|---|---|---|---|---|---|---|---|---|
| Variables | Base | OLS | ML | Base | OLS | ML | Base | OLS | ML | Base | OLS | ML |
| β(Constant) | −12.888 | 15.793 | −2.214 | 14.438* | −2.914* | −2.946* | −0.894 | −0.483 | ||||
| On-site outlet density | 3.765*** | 2.52*** | 1.884*** | 1.097*** | 0.322*** | 0.354*** | −0.092 | −0.160* | ||||
| Off-site outlet density | −1.066 | −4.563** | −1.153 | −2.732** | 1.254** | 1.195** | 0.371 | 0.316 | ||||
| % HH poverty | 0.024 | 0.165 | −0.218 | −0.141 | 0.112** | 0.119*** | 0.074* | 0.067* | ||||
| Population density | 0.000 | 0.000 | 0.000 | 0.000 | 0.000 | 0.000 | 0.000 | 0.000 | ||||
| % Vacant | 2.566*** | 1.833*** | 1.200*** | 0.713*** | 0.041 | 0.019 | 0.164* | 0.178** | ||||
| λ(Lambda) | − | 0.739*** | − | 0.769*** | − | 0.113 | − | 0.218* | ||||
| R-squared | 0.582*** | 0.729 | 0.457*** | 0.667 | 0.393*** | 0.397 | 0.202*** | 0.224 | ||||
| Log likelihood | −814.771 | −791.421 | −728.78 | −702.334 | −528.948 | −528.607 | −508.452 | −506.973 | ||||
| Akaike info. criterion | 1641.54 | 1594.84 | 1469.56 | 1416.67 | 1069.9 | 1069.21 | 1028.9 | 1025.95 | ||||
| Moran’s I | 0.577*** | 0.287*** | − | 0.521*** | 0.301*** | − | 0.254*** | 0.036 | − | 0.21*** | 0.08* | − |
p ≤ 0.05,
p ≤ 0.01,
p ≤ 0.001.
The OLS analysis indicated that even after controlling for certain social factors, unexplained spatial autocorrelation remained for the overall HIV rates and for the MSM rates. In contrast, spatial autocorrelation was eliminated in the IDU and decreased to 0.08 in the HRH risk groups in the adjusted models, suggesting that the unexplained clustering observed in the overall HIV pattern was primarily influenced by whatever was happening within the MSM group.
In terms of overall HIV rates, high on-site outlet density, housing vacancy rates, and lower off-site outlet density were positively associated with HIV rates. Within the MSM subgroup, a similar pattern of association of measures occurred, but significant clustering persisted (Moran’s I = 0.301). The similarities in terms of coefficients and clustering supports the notion that the MSM subgroup had a strong influence on the overall pattern of HIV within the city. Higher rates of HIV in the general populace and in the specific MSM subgroup were likely to be found in census tracts characterized by a high density of bars and vacant housing.
The IDU subgroup was positively associated with both on- and off-site outlet density, as well as percentage of households below the poverty line. High-risk heterosexual transmission rates were positively associated with the percentage of households in poverty and housing vacancy.
The ML spatial error regression verified the persistence of spatial structure in both the overall HIV rates and MSM HIV rates as there was an improved fit indicated by the log likelihood measures becoming less negative and Akaike information criterion decreasing (ML column Table 2). The significant and relatively high λ values of 0.739 and 0.769 for overall and MSM-specific HIV provide further indication that the spatial model accounting for spatial autocorrelation provides a stronger predictive model than the OLS regression. Both overall HIV and MSM-specific rates continued to be positively associated with both on-site alcohol outlet density and vacancy rates. For both outcomes, lower density of off-site alcohol outlets was also statistically significantly associated with an increased risk of HIV in the ML regression.
The ML model verified that there was no residual spatial structure to IDU rates, as was expected given the persistent lack of clustering observed in the earlier models. Neither goodness-of-fit measures nor λ indicated an improved fit or spatial component to the outcome and predictors considered.
The results for HRH were more difficult to interpret. Although the OLS regression nearly eliminated the Moran’s I, reducing it from 0.21 to 0.08, it remained significant, indicative of a small degree of spatial clustering in the dependent variable’s residual. The spatial error in the ML model showed a very minor improvement of fit; neither the log likelihood nor the Akaike information criterion changed dramatically, yet the λ was marginally significant. This suggests that rather than there being a true spatial structure to the HRH rates, HRH rates continued to be predicted by higher levels of census tract poverty and vacancy rates and lower rather than higher levels of on-site outlet density.
LISA maps demonstrating the distribution of low and high HIV incidence leave different footprints on the topography of the city for different risk groups (Figure 2). The regression analyses that indicate shared predictors of HIV, when related to mapped census tract data, may reflect the location of tracts where bridging occurs. For example, the MSM and IDU groups may overlap in census tracts with a high number of bars. By comparing LISA maps of high HIV rates for MSM and IDU in Figure 2 one can identify three neighborhoods (i.e., census tracts) of potential overlap between the MSM and IDU groups (Figure 3).
Figure 2.
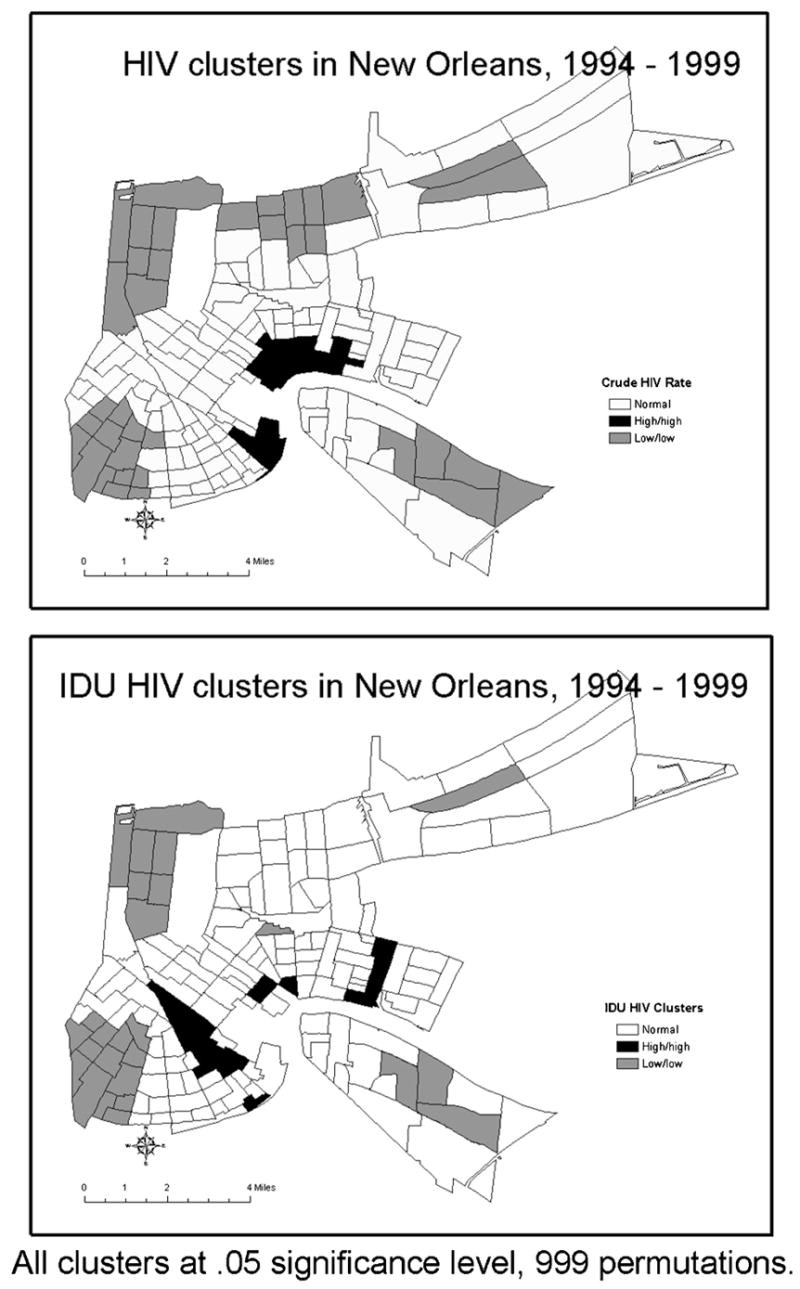
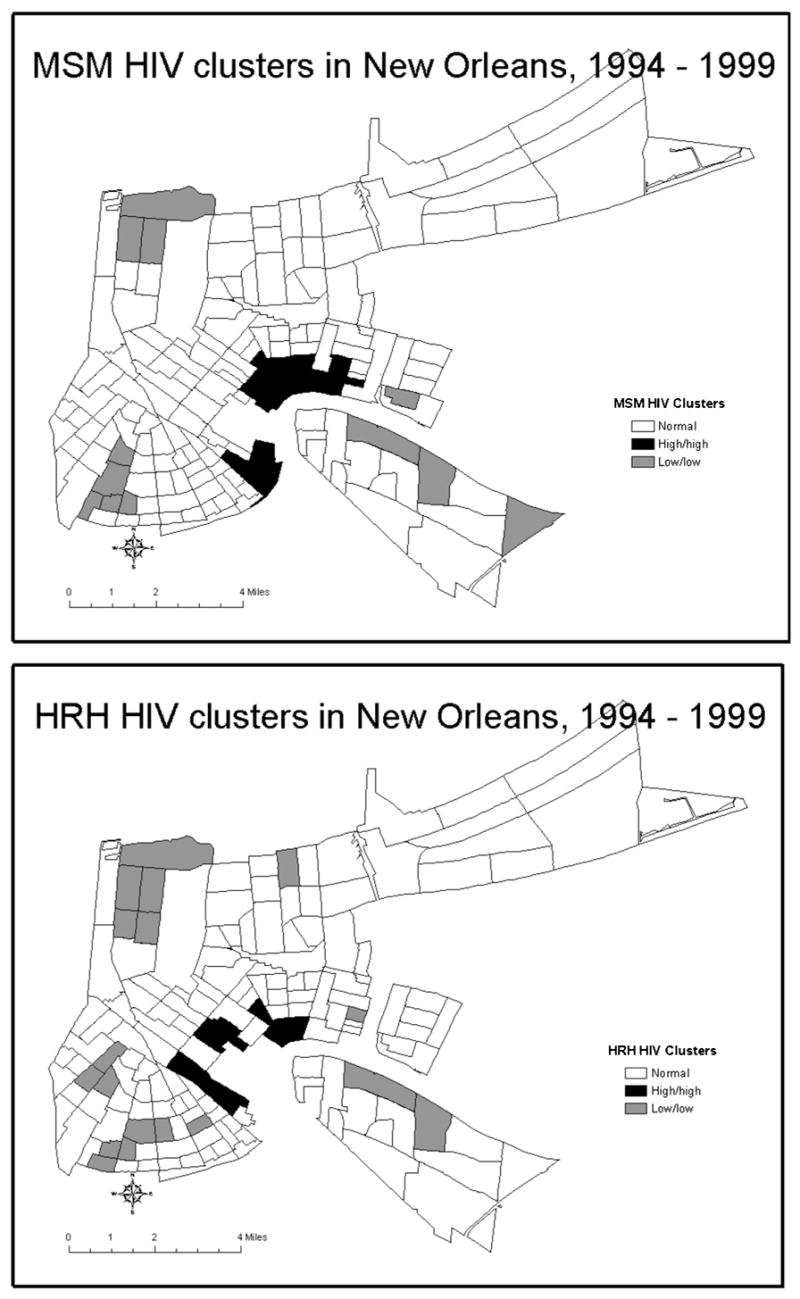
Clusters of low and high HIV rates stratified by risk categories at the census tract level in New Orleans, 1994–1999.
Figure 3.
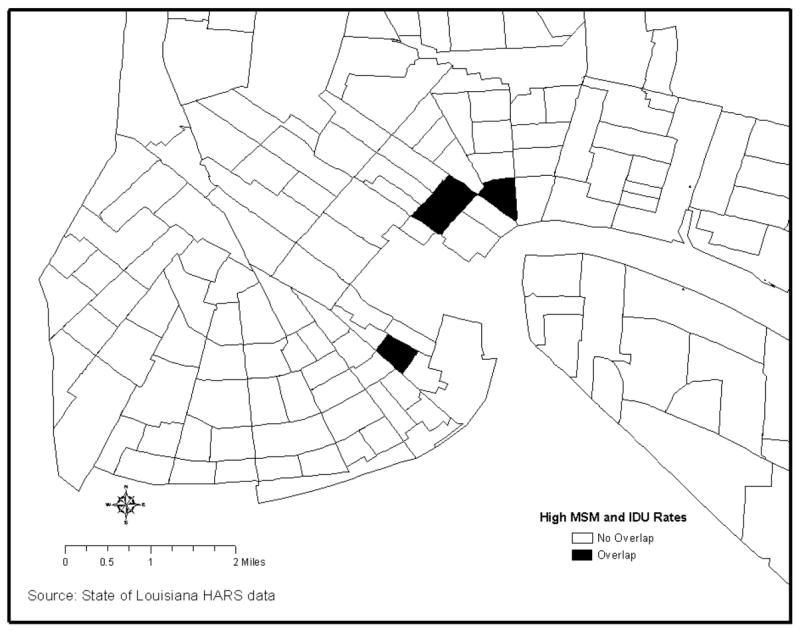
Neighborhoods of overlap between high rates of HIV in the MSM and IDU subpopulations, Orleans Parish.
The final maps compare the LISA maps for the overall MSM HIV rate with the LISA map generated for the residual resulting from the regression of the MSM HIV rate (Figure 4). The comparison demonstrates how the spatial analytic techniques described have identified within the MSM HIV tracts a subgroup of tracts where there is clustering that is unexplained by the primary predictor variables. It is important to note that if our hypothesis is correct a core group may reside in the narrowly focused area outlined in Figure 4b. This could answer Bernstein’s (Bernstein et al., 2004) call for greater specificity when defining core groups if these results could be validated with actual core group data.
Figure 4.
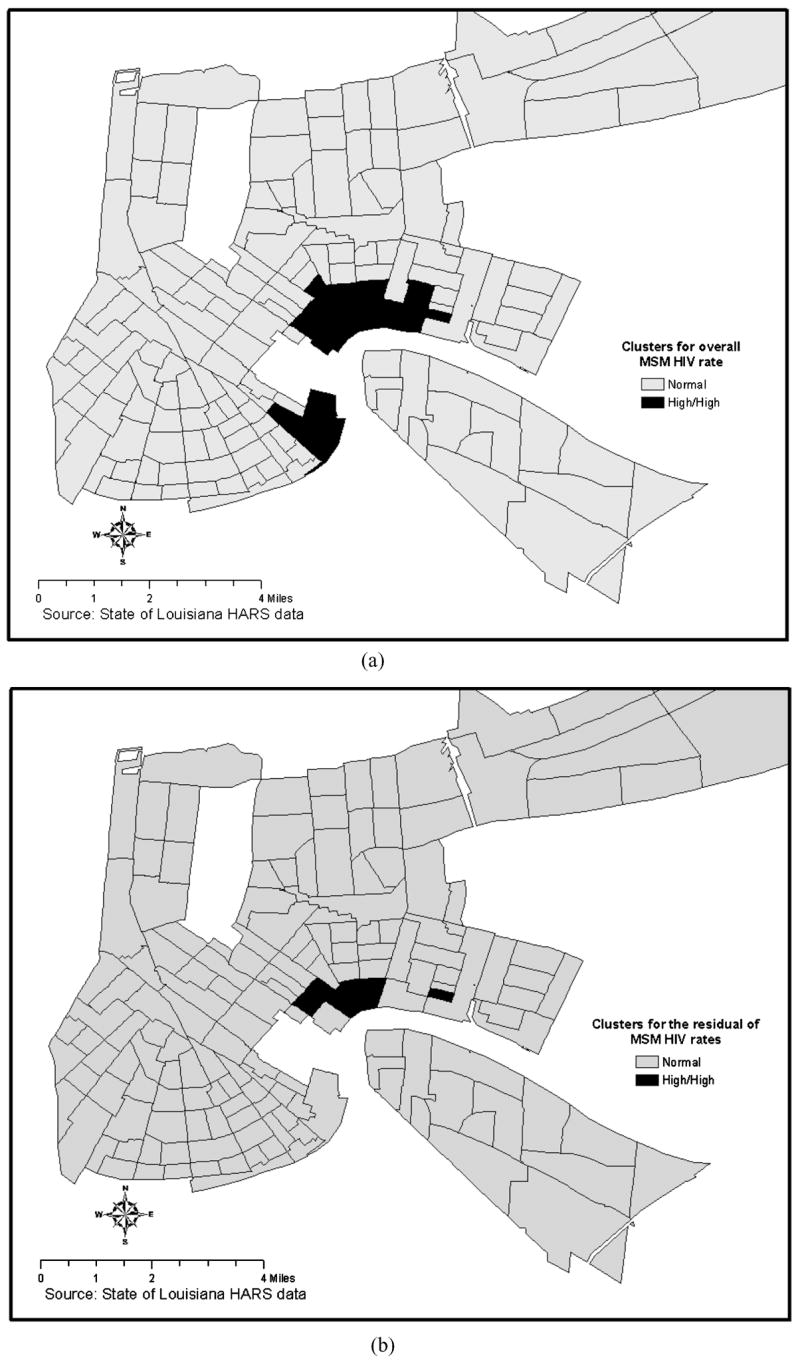
LISA maps showing cluster for the overall MSM HIV rate and clusters for the residual of the MSM HIV rate resulting from OLS regression adjusting for independent predictors.
Discussion
The spatial statistical methods employed in this analysis permitted testing models to explain the geographic distribution of HIV/AIDS in terms of various factors that contribute to the spatial structure of the epidemic. Shared social structure appeared to explain much of the clustering initially observed in HIV/AIDS cases. However, residual spatial structure remained in both the overall HIV/AIDS rate and in the MSM risk group. That these spatial patterns mirrored one another suggested that the MSM risk group heavily influenced the pattern of HIV/AIDS in New Orleans during the mid-1990s. This is not unexpected. Analysis on national HIV trends found that MSM and IDU rates greatly informed the overall patterns of HIV/AIDS; the MSM risk group contributed the greatest number of cases to overall incidence in the 1980s and the 1990s even after accounting for significant declines among new MSM cases over that period (Vu et al., 2002).
There are several outcomes of interest. Neighborhood MSM rates were predicted by high on-site alcohol outlet density and neighborhood deterioration, IDU rates were predicted by low socioeconomic status and high alcohol outlet density, and HRH rates were predicted by low socioeconomic status and high neighborhood deterioration. These associations could be explained by patterns of bridging and mixing across the risk populations. According to Aral (2000), social characteristics influence bridging much more than do individual characteristics. This analysis suggests the contextual bridge between MSMs and IDUs that occurs in neighborhoods is defined by high alcohol outlet density. It also suggests a possible compositional bridge between IDUs and HRHs in low socioeconomic status neighborhoods. While links between bars, STDs, HIV, and poverty with disease have been established through case control, survey, and ecological studies (Adimora and Schoenbach, 2005; Cohen et al., 2000; De, Singh, Wong, Yacoub, and Jolly, 2004; Scribner et al., 1998), the risk group–specific mechanisms are not so clearly delineated and bear further exploration. It is possible that there are differences in the contact patterns associated with bridging and mixing that vary depending upon whether the variable is contextual or compositional. Further research that includes data on individual-level behaviors is necessary to validate the supposition of mixing and bridging between members of these risk populations.
The practical application of these results is found in the LISA maps. First, there are the LISA maps of the overall epidemic depicting the overlap of census tracts contributing to the overlap of the geographic distribution of HIV/AIDS. These maps identify not only neighborhoods in which bridging between several risk groups and the general population may occur, but by suggesting which risk behaviors are most common (i.e., attending bars), these maps become tools to help public health workers tailor outreach messages and services to match the most pressing needs.
A second important outcome comes from the mapping of the residual spatial clustering for MSM HIV rates (Figure 4). While there are a number of possible explanations for this clustering it is consistent with the possibility that core group members reside in these census tracts. Other possible explanations for residual clustering include the possibility that (a) these census tracts represent a port of entry where infections are the result of infected non-residents visiting these areas, (b) the clustering reflects differential grouping of risk groups (i.e., MSM, IDU, HRH) by census tract since risk group–specific denominators could not be included in the rate calculation, and (c) the clustering is the product of other unmeasured confounders.
There are several methodological advantages to the approach used in this study. The combination of standard statistical and spatial methods provided a means with which to isolate social characteristics associated with the disease while permitting an explicitly spatial exploration of the role place has in disease, thereby addressing the shortcomings of employing one or the other method independently (Weeks, 2004). This methodology takes advantage of newly available software and methods to overcome the limitations of previous work in which a core group was not spatially assessed so much as intuitively described.
There are additional limitations to the proposed core group detection methodology employed. First, residence is based upon the census tract of residency, as is common with other sexual network/core group studies (Bernstein et al., 2004; Blanchard et al., 1998; Elliott et al., 2002; Potterat, Rothenberg, and Muth, 1999; Potterat et al., 1985). This definition assumes that individuals meet their partners in the same census tract in which they live. This may not always be the case. Further, census tract boundaries are administrative boundaries that do not directly inform about how particular individuals within those tracts conceive of their neighborhoods, nor how they move through space. A possible way to overcome this shortcoming is to undertake network analysis that ascertains where individuals meet their partners in conjunction with spatial analysis (Eagles, Bélanger, and Calkins, 2004) or to employ multiple definitions of neighborhood (Morenoff, 2003; Sampson, Morenoff, and Raudenbush, 2005), but such was beyond the scope of this study.
This article explores a novel use of geospatial methodology to identify the residential location of a core group. The outcome of this research remains theoretical and will need to be validated through a social network analysis of partner contact data. On a theoretical level, this research contributes to the corpus of work on network analysis and core groups by attaching an explicit spatial analysis to identifying geographic location independent of social characteristics of clusters. On a practical level, contact tracing is time consuming and costly. If validated, the methods described herein could present a comparatively inexpensive and easy way to identify core groups and those areas of concentrated core groups.
Acknowledgments
National Institute on Alcohol Abuse and Alcoholism (1 RO1 AA013810), Alcohol Research Planning and Development Program, National Institute on Alcohol Abuse and Alcoholism (1U01 AA014293), and National Institute on Alcohol Abuse and Alcoholism NRSA training grant T32 AA07577.
Biographies
 Richard Scribner, M.D., M.P.H., holds the D’Angelo Professorship in Alcohol Research at the Louisiana State University, School of Public Health in New Orleans. He is nationally recognized as an expert in the area of community-level prevention of alcohol-related problems. He received his advanced degrees from the University of Southern California and the University of California where his fieldwork helped solidify his research approach. His research focuses on characteristics of health communities where he uses the latest in geographic information system (GIS) technology and spatial analysis techniques for characterizing healthy neighborhoods. The goal of this research is the identification of community-level policies that can be used to alter the strong geographic relation between alcohol availability and alcohol problems like binge drinking, fatal traffic crashes, youth violence, sexually transmitted diseases, domestic violence, and drunk driving. Both local and national media including the Wall Street Journal and New York Magazine have featured Dr. Scribner’s findings. His research has been successfully used to influence alcohol policy in communities throughout the country, including state-level policy in California and Louisiana.
 Dr. Sandy A. Johnson received her Ph.D. from Tulane University. She is currently scholar in residence at the Graduate School of International Studies, University of Denver, and is a visiting scientist at the National Center for Atmospheric Research. Dr. Johnson’s primary research interest is social vulnerability within the context of environment and policy. This topic has led her to explore the nexus of environment, development, and conflict and health disparities and social justice.
 Dr. Deborah Cohen (M.D., University of Pennsylvania; M.P.H., UCLA; B.A., Yale) is a researcher in the area of the built environment and health and is the coauthor of Prescription for a Healthy Nation, A New Approach to Improving Our Lives by Fixing Our Everyday World, published by Beacon Press. She is board certified in public health and preventive medicine and currently a senior natural scientist at the RAND Corporation. She previously served on the faculty at Louisiana State University Health Sciences Center and at the University of Southern California Medical School. Most recently her research studies have been focused on the role of the built environment in physical activity and dietary behaviors, but she has also done extensive work in STD/HIV control and alcohol policy. She has served on several advisory panels for the National Institutes of Health (NIH) and was a Fulbright Senior Scholar in Brazil. She also developed the first school-based STD screening program, which has used urine specimens for the diagnosis of chlamydia and gonorrhea in public high schools. This program has also been adopted by several other localities across the country. She has also developed a tool for health departments and community planning groups to estimate the relative cost effectiveness of 26 HIV prevention interventions. Her current research emphasis is in understanding how the built environment, especially neighborhood conditions, influences STDs, HIV, and other risk behaviors. She is the principal investigator of several grants to assess how local neighborhoods influence physical activity and dietary behaviors.
William Robinson, Ph.D., is an assistant professor of behavioral and community health sciences at Louisiana State University–Health Sciences Center School of Public Health as well as the biostatistician for the Louisiana Office of Public Health HIV/AIDS Program. His training is in experimental and quantitative methods in psychology and he is an expert in many statistical techniques including structural equation modeling, factor analysis, and geospatial analysis. Dr. Robinson’s research involves the behavioral, epidemiologic, and structural factors that place people at risk for diseases such as HIV/AIDS. He is currently conducting the Louisiana arm of the CDC funded National HIV Risk Behavior Surveillance, a study of HIV risk behaviors in a sample of heterosexuals at high risk in New Orleans. He is also collaborator on a study utilizing geographic information systems to investigate the effects of alcohol outlet policy on local HIV and STD rates. Following the diaspora caused by hurricane Katrina, he has developed methods to estimate the prevalence of HIV and AIDS in the New Orleans area.
Dr. Paul Gruenewald is scientific director and senior research scientist at Prevention Research Center, Pacific Institute for Research and Evaluation, Berkeley, California. His research focuses upon studies of the social, economic, and physical availability of alcohol, alcohol use, and alcohol-related problems; mathematical and statistical models of alcohol use and abuse; the development of evaluation methods appropriate to community-based evaluations of preventive interventions; and the environmental prevention of violence. Dr. Gruenewald also directs the Spatial Systems Group, a coordinating center for research using geographic information systems, spatial statistical systems, and spatial dynamic models. He has been a principal or co-investigator on 18 funded research projects and is a MERIT Award researcher with the National Institute on Alcohol Abuse and Alcoholism.
References
- Adimora AA, Schoenbach VJ. Social context, sexual networks, and racial disparities in rates of sexually transmitted infections. The Journal of Infectious Diseases. 2005;191(Suppl 1):S115–S122. doi: 10.1086/425280. [DOI] [PubMed] [Google Scholar]
- Anselin L. Local indicators of spatial association—LISA. Geographical Analysis. 1995;27:93–115. [Google Scholar]
- Anselin L. Geoda. Urbana, IL: Spatial Analysis Laboratory; 2004. [Google Scholar]
- Aral SO. Behavioral aspects of sexually transmitted diseases: Core groups and bridge populations. Sexually Transmitted Diseases. 2000;27(6):327–328. doi: 10.1097/00007435-200007000-00005. [DOI] [PubMed] [Google Scholar]
- Aral SO. Understanding racial-ethnic and societal differentials in STI. Sexually Transmitted Infections. 2002;78:2–4. doi: 10.1136/sti.78.1.2. [DOI] [PMC free article] [PubMed] [Google Scholar]
- Bernstein KT, Curriero FC, Jennings JM, Olthoff G, Erbelding EJ, Zenilman J. Defining core gonorrhea transmission utilizing spatial data. American Journal of Epidemiology. 2004;160(1):51–58. doi: 10.1093/aje/kwh178. [DOI] [PubMed] [Google Scholar]
- Blanchard JF. Populations, pathogens, and epidemic phases: Closing the gap between theory and practice in the prevention of sexually transmitted diseases. Sexually Transmitted Infections. 2002;78(Suppl I):i183–i188. doi: 10.1136/sti.78.suppl_1.i183. [DOI] [PMC free article] [PubMed] [Google Scholar]
- Blanchard JF, Moses S, Greenaway C, Orr P, Hammond GW, Brunham RC. The evolving epidemiology of chlamydial and gonococcal infections in response to control programs in Winnipeg, Canada. American Journal of Public Health. 1998;88(10):1496–1502. doi: 10.2105/ajph.88.10.1496. [DOI] [PMC free article] [PubMed] [Google Scholar]
- Boily MC, Lowndes C, Alary M. The impact of HIV epidemic phases on the effectiveness of core group interventions: Insights from mathematical models. Sexually Transmitted Infections. 2002;78(Suppl 1):i78–i90. doi: 10.1136/sti.78.suppl_1.i78. [DOI] [PMC free article] [PubMed] [Google Scholar]
- Broyles S. Louisiana regional HIV/AIDS surveillance report. New Orleans: Louisiana Office of Public Health; 2000. [Google Scholar]
- Brunham RC. Core group theory: A central concept in std epidemiology. Venereology. 1997;10(1):34–39. [Google Scholar]
- Cohen D, Spear D, Scribner R, Kissinger P, Mason K, Wildgen J. “Broken windows” and the risk of gonorrhea. American Journal of Public Health. 2000;90(2):230–236. doi: 10.2105/ajph.90.2.230. [DOI] [PMC free article] [PubMed] [Google Scholar]
- De P, Singh AE, Wong T, Yacoub W, Jolly AM. Sexual network analysis of a gonorrhea outbreak. Sexually Transmitted Infections. 2004;80(4):280–285. doi: 10.1136/sti.2003.007187. [DOI] [PMC free article] [PubMed] [Google Scholar]
- Diez Roux AV. A glossary for multilevel analysis. Journal of Epidemiology & Community Health. 2002;56(8):588–594. doi: 10.1136/jech.56.8.588. [DOI] [PMC free article] [PubMed] [Google Scholar]
- Eagles M, Bélanger P, Calkins HW. The spatial structure of urban political discussion networks. In: Goodchild M, Janelle D, editors. Spatially integrated social science. Oxford: Oxford University Press; 2004. pp. 205–218. [Google Scholar]
- Elliott LJ, Blanchard JF, Beaudoin CM, Green DL, Matusko P, Moses S. Geographical variations in the epidemiology of bacterial sexually transmitted infections in Manitoba, Canada. Sexually Transmitted Infections. 2002;78(Suppl I):i139–i144. doi: 10.1136/sti.78.suppl_1.i139. [DOI] [PMC free article] [PubMed] [Google Scholar]
- ESRI. Arcgis 9. (Computer Software) Redlands, CA: Environmental Systems Research Institute; 2004. [Google Scholar]
- Ghani AC, Garnett GP. Risks of acquiring and transmitting sexually transmitted diseases in sexual partner networks. Sexually Transmitted Diseases. 2000;27(10):579–587. doi: 10.1097/00007435-200011000-00006. [DOI] [PubMed] [Google Scholar]
- Janssen RS, Holtgrave DR, Valdiserri RO, Shepherd M, Gayle HD, De Cock KM. The serostatus approach to fighting the HIV epidemic: Prevention strategies for infected individuals. American Journal of Public Health. 2001;91(7):1019–1024. doi: 10.2105/ajph.91.7.1019. [DOI] [PMC free article] [PubMed] [Google Scholar]
- Janssen RS, Valdiserri RO. HIV prevention in the united states: Increasing emphasis on working with those living with HIV. Journal of Acquired Immune Deficiency Syndromes. 2004;37(Suppl 2):S119–S121. doi: 10.1097/01.qai.0000140610.82134.e3. [DOI] [PubMed] [Google Scholar]
- Jolly AM, Muth SQ, Wylie JL, Potterat JJ. Sexual networks and sexually transmitted infections: A tale of two cities. Journal of Urban Health. 2001;78(3):433–445. doi: 10.1093/jurban/78.3.433. [DOI] [PMC free article] [PubMed] [Google Scholar]
- Krieger N, Waterman PD, Chen JT, Soobader MJ, Subramanian S. Monitoring socioeconomic inequalities in sexually transmitted infections, tuberculosis, and violence: Geocoding and choice of area-based socioeconomic measures—The public health disparities geocoding project (US) Public Health Reports. 2003;118:240–260. doi: 10.1093/phr/118.3.240. [DOI] [PMC free article] [PubMed] [Google Scholar]
- Law DC, Serre ML, Christakos G, Leone PA, Miller WC. Spatial analysis and mapping of sexually transmitted diseases to optimise intervention and prevention strategies. Sexually Transmitted Infections. 2004;80(4):294–299. doi: 10.1136/sti.2003.006700. [DOI] [PMC free article] [PubMed] [Google Scholar]
- Morenoff JD. Neighborhood mechanisms and the spatial dynamics of birth weight. AJS. 2003;108(5):976–1017. doi: 10.1086/374405. [DOI] [PubMed] [Google Scholar]
- Potterat JJ, Muth SQ, Rothenberg RB, Zimmerman-Rogers H, Green DL, Taylor JE, et al. Sexual network structure as an indicator of epidemic phase. Sexually Transmitted Infections. 2002;78(Suppl 1):i152–i158. doi: 10.1136/sti.78.suppl_1.i152. [DOI] [PMC free article] [PubMed] [Google Scholar]
- Potterat JJ, Rothenberg RB, Muth SQ. Network structural dynamics and infectious disease propagation. International Journal of STD & AIDS. 1999;10(3):182–185. doi: 10.1258/0956462991913853. [DOI] [PubMed] [Google Scholar]
- Potterat JJ, Rothenberg RB, Woodhouse DE, Muth JB, Pratts CI, Fogle JS., II Gonorrhea as a social disease. Sexually Transmitted Diseases. 1985;12(1):25–32. doi: 10.1097/00007435-198501000-00006. [DOI] [PubMed] [Google Scholar]
- Sampson RJ, Morenoff JD, Raudenbush SW. Social anatomy of racial and ethnic disparities in violence. American Journal of Public Health. 2005;95(2):224–232. doi: 10.2105/AJPH.2004.037705. [DOI] [PMC free article] [PubMed] [Google Scholar]
- Scribner R, Cohen D, Kaplan S, Allen SH. Alcohol availability and homicide in new Orleans: Conceptual considerations for small area analysis of the effect of alcohol outlet density. Journal of Studies on Alcohol. 1999;60(3):310–316. doi: 10.15288/jsa.1999.60.310. [DOI] [PubMed] [Google Scholar]
- Scribner RA, Cohen DA, Farley TA. A geographic relation between alcohol availability and gonorrhea rates. Sexually Transmitted Diseases. 1998;25(10):544–548. doi: 10.1097/00007435-199811000-00009. [DOI] [PubMed] [Google Scholar]
- Scribner RA, Cohen DA, Fisher W. Evidence of a structural effect for alcohol outlet density: A multilevel analysis. Alcoholism: Clinical and Experimental Research. 2000;24(2):188–195. [PubMed] [Google Scholar]
- Thomas JC, Tucker MJ. The development and use of the concept of a sexually transmitted disease core. The Journal of Infectious Diseases. 1996;174(Suppl 2):S134–S143. doi: 10.1093/infdis/174.supplement_2.s134. [DOI] [PubMed] [Google Scholar]
- United States Census Bureau. Census 2000. 2000 Retrieved June 7, 2004, from http://factfinder.census.gov/servlet/QTTable.
- Vu MQ, Steketee RW, Valleroy L, Weinstock H, Karon J, Janssen R. HIV incidence in the united states, 1978–1999. Journal of Acquired Immune Deficiency Syndromes. 2002;31(2):188–201. doi: 10.1097/00126334-200210010-00010. [DOI] [PubMed] [Google Scholar]
- Wasserheit JN, Aral SO. The dynamic topology of sexually transmitted disease epidemics: Implications for prevention strategies. The Journal of Infectious Diseases. 1996;174(Suppl 2):S201–S213. doi: 10.1093/infdis/174.supplement_2.s201. [DOI] [PubMed] [Google Scholar]
- Weeks J. The role of spatial analysis in demographic research. In: Goodchild M, Janelle D, editors. Spatially integrated social sciences. Oxford: Oxford University Press; 2004. pp. 381–399. [Google Scholar]
- Weinhardt LS, Carey MP, Johnson BT, Bickham NL. Effects of HIV counseling and testing on sexual risk behavior: A meta-analytic review of published research, 1985–1997. American Journal of Public Health. 1999;89(9):1397–1405. doi: 10.2105/ajph.89.9.1397. [DOI] [PMC free article] [PubMed] [Google Scholar]
- Wylie JL, Jolly A. Patterns of chlamydia and gonorrhea infection in sexual networks in Manitoba, Canada. Sexually Transmitted Diseases. 2001;28(1):14–32. doi: 10.1097/00007435-200101000-00005. [DOI] [PubMed] [Google Scholar]
- Zenilman JM, Ellish N, Fresia A, Glass G. The geography of sexual partnerships in Baltimore: Applications of core theory dynamics using a geographic information system. Sexually Transmitted Diseases. 1999;26(2):75–81. doi: 10.1097/00007435-199902000-00002. [DOI] [PubMed] [Google Scholar]