


Abstract
Background:
Corticobasal syndrome (CBS) can be associated with different underlying pathologies that are difficult to predict based on clinical presentation. The aim of this study was to determine whether patterns of atrophy on imaging could be useful to help predict underlying pathology in CBS.
Methods:
This was a case-control study of 24 patients with CBS who had undergone MRI during life and came to autopsy. Pathologic diagnoses included frontotemporal lobar degeneration (FTLD) with TDP-43 immunoreactivity in 5 (CBS-TDP), Alzheimer disease (AD) in 6 (CBS-AD), corticobasal degeneration in 7 (CBS-CBD), and progressive supranuclear palsy in 6 (CBS-PSP). Voxel-based morphometry and atlas-based parcellation were used to assess atrophy across the CBS groups and compared to 24 age- and gender-matched controls.
Results:
All CBS pathologic groups showed gray matter loss in premotor cortices, supplemental motor area, and insula on imaging. However, CBS-TDP and CBS-AD showed more widespread patterns of loss, with frontotemporal loss observed in CBS-TDP and temporoparietal loss observed in CBS-AD. CBS-TDP showed significantly greater loss in prefrontal cortex than the other groups, whereas CBS-AD showed significantly greater loss in parietal lobe than the other groups. The focus of loss was similar in CBS-CBD and CBS-PSP, although more severe in CBS-CBD.
Conclusions:
Imaging patterns of atrophy in CBS vary according to pathologic diagnosis. Widespread atrophy points toward a pathologic diagnosis of FTLD-TDP or AD, with frontotemporal loss suggesting FTLD-TDP and temporoparietal loss suggesting AD. On the contrary, more focal atrophy predominantly involving the premotor and supplemental motor area suggests CBD or PSP pathology.
GLOSSARY
- AAL
= automated anatomic labeling;
- AD
= Alzheimer disease;
- CBD
= corticobasal degeneration;
- CBS
= corticobasal syndrome;
- CDR-SB
= Clinical Dementia Rating sum of boxes;
- FDR
= false discovery rate;
- FTLD
= frontotemporal lobar degeneration;
- MMSE
= Mini-Mental State Examination;
- PSP
= progressive supranuclear palsy;
- ROI
= region of interest;
- SMA
= supplemental motor area;
- TDP
= TDP-43 immunoreactivity;
- TIV
= total intracranial volume;
- VBM
= voxel-based morphometry.
The corticobasal syndrome (CBS) is characterized by insidious onset and progressive asymmetric cortical and extrapyramidal dysfunction in the absence of an identifiable cause but usually due to an underlying neurodegenerative disorder.1 Cortical abnormalities typically observed in CBS include ideomotor limb apraxia, cortical sensory loss, alien limb phenomenon, and myoclonus.2 The CBS is not, however, associated with a specific pathology. We and others have demonstrated that CBS can be the presenting syndrome of a host of different pathologies, including corticobasal degeneration (CBS-CBD), progressive supranuclear palsy (CBS-PSP), Alzheimer disease (CBS-AD), and frontotemporal lobar degeneration (FTLD) with ubiquitin-only immunoreactive inclusions,3–5 which in the majority of cases show immunoreactivity to the TAR DNA binding protein of 43 kDa (CBS-TDP).6,7 Biomarkers are therefore needed to aid with prediction of pathology in subjects with CBS.
Patterns of asymmetric frontoparietal brain atrophy have been associated with both CBS8 and CBD pathology.9,10 However, we have previously demonstrated that the patterns of atrophy and hypometabolism identified in CBS-CBD differ from CBS-AD, with greater temporoparietal involvement observed in CBS-AD.4,11,12 It could therefore be hypothesized that imaging may provide a useful biomarker of pathology in CBS. The aim of this study was to expand on our previous study that assessed subjects with CBS-AD and CBS-CBD and to compare the atrophy patterns identified across all pathologic variants of CBS, including CBS-TDP, CBS-AD, CBS-CBD, and CBS-PSP, in order to determine whether imaging signatures can help predict underlying pathology in CBS.
METHODS
Subjects.
The Mayo Clinic, Rochester, MN, Autopsy Database was searched to identify all subjects who had been given a final clinical diagnosis of CBS from January 1, 1995, to January 1, 2010, had an antemortem volumetric MRI scan, and had died and come to autopsy (n = 24). Of the 24 identified cases, the pathologic diagnoses were CBD (CBS-CBD) in 7, PSP (CBS-PSP) in 6, FTLD-TDP (CBS-TDP) in 5, and AD (CBS-AD) in 6 cases. We have previously published imaging studies with different aims that have included 5 of the CBS-AD cases, 6 CBS-CBD cases,11,13 and 5 CBS-PSP cases10; all these groups, as well as the CBS-TDP group, have not previously been compared. All subjects with CBS-TDP with frozen tissue were screened for mutations in the progranulin gene (GRN) (n = 4), as previously described.13 The medical records of all subjects were reviewed by a neurodegenerative specialist (K.A.J.) to ensure that cases met published criteria for CBS1 at the time of scan and to abstract clinical data. The 24 CBS cases were age- and gender-matched to 24 healthy living control subjects who were identified from the Mayo Clinic Alzheimer's Disease Research Center database.
Standard protocol approvals and patient consents.
Informed consent was obtained from all subjects for participation in the studies, which were approved by the Mayo Clinic Institutional Review Board.
Neuropsychology.
Neuropsychological test scores representing the domains of memory (Wechsler Memory Scale–Revised Logical Memory delayed recall percent retention), language (Boston Naming Test and Category Fluency Test), and executive function (Trail Making Test B and the Controlled Oral Word Association Test)14 performed closest to the time of MRI were collected.
Pathologic analysis.
All subjects had undergone standardized neuropathologic examination using the recommended diagnostic protocol for AD15 and were pathologically diagnosed by one of our experienced neuropathologists (J.E.P. or D.W.D.).
Frontotemporal lobar degeneration with TAR DNA binding protein 43 was diagnosed if there was neuronal loss and gliosis in frontal and temporal cortices, as well as ubiquitin and TDP-43 immunoreactive neuronal inclusions.16 Using published criteria,17 cases were diagnosed as having FTLD-TDP type 1 pathology if there were neuronal inclusions and short dystrophic neurites in layer II of neocortex and inclusions in the dentate gyrus of the hippocampus; type 2 if there were large and thick neurites throughout neocortex with absent-sparse inclusions; and type 3 if there were inclusions in neocortex or dentate granule cells of hippocampus and absent-sparse neurites. Pathologic diagnoses of PSP18 and CBD19 were made according to published diagnostic criteria. AD was diagnosed based on high probability of AD according to the NIA-Reagan criteria.20
Asymmetry correction.
CBS is asymmetric, whereby the greatest atrophy could be present in either left or right hemisphere.9,21 In this study a most severely affected (i.e., dominant) hemisphere for each subject was designated by K.A.J. (contralateral to the most affected limb) using clinical features at time of MRI, without reference to imaging. Each MRI was flipped in the X dimension so that the more severely affected hemisphere was positioned on the left side of the image in all subjects. This allowed us to assess patterns of gray matter atrophy in the dominant and nondominant hemispheres across all subjects.
Voxel-based morphometry.
Patterns of cerebral atrophy were assessed using the automated and unbiased technique of voxel-based morphometry (VBM)22 implemented using SPM5 (http://www.fil.ion.ucl.ac.uk/spm). All subject images were normalized and segmented into gray matter, white matter, and CSF using customized tissue probability maps and the unified segmentation23 routine followed by the HMRF clean-up step. The customized prior probability maps were created from 116 subjects (35 controls and 81 subjects with FTLD-tau or FTLD-TDP24). Gray matter images were modulated and smoothed at 8 mm full width at half maximum.
A full-factorial model was used to assess patterns of gray matter loss in each CBS group (CBS-TDP, CBS-AD, CBS-CBD, and CBS-PSP) compared to controls. Age and gender were included in the model as covariates. These analyses were assessed corrected for multiple comparisons using the false discovery rate (FDR) at p < 0.001, and uncorrected at p < 0.001. A conjunction analysis was performed to assess regions of loss that were common to all the CBS pathologic groups, and direct comparisons were performed between each CBS group and all other subjects with CBS, in order to identify regions of loss that are present in each pathologic group compared to the others. These analyses were performed uncorrected at p < 0.001 with age and gender included as covariates. In order to adjust for differences in disease severity, the direct comparisons were also performed including MMSE as a covariate.
Atlas-based parcellation.
In order to investigate single subject-level regional differences in our different disease groups, an automated atlas-based parcellation technique was employed using SPM5 and the automated anatomic labeling (AAL) atlas25 to generate gray matter volumes for specific regions of interest (ROIs) as previously published.12 Briefly, the atlas25 was normalized to the customized template and edited, transformed into MRI native anatomic space for each subject, and multiplied by a gray matter mask. Gray matter volumes were calculated for specific ROIs based on the VBM results: inferior and superior lateral frontal lobes, supplemental motor area (SMA), lateral parietal lobe, medial and lateral temporal lobe, caudate, and insula. Total intracranial volume (TIV) was calculated by propagating a template-drawn TIV mask to the subject space as above, and then performing an erosion step to remove border voxels. All ROI volumes were corrected for TIV (volume/TIV) and converted into a Z score reflecting deviation from the control group average.
Statistics.
Statistical analyses were performed using the JMP computer software (JMP Software, version 6.0.0; SAS Institute Inc., Cary, NC) with statistical significance set at p < 0.05. Kruskal-Wallis testing was used to assess differences in continuous variables across disease groups. If significant differences were observed then intergroup comparisons were performed using Mann-Whitney U test. Logistic regression was used to adjust for MMSE. χ2 test was used to compare categorical variables across groups.
RESULTS
Clinical and genetic findings.
No significant differences were observed in any demographic features across groups (table 1). Significant differences were observed across all 5 groups, including controls, in Mini-Mental State Examination (MMSE)26 and Clinical Dementia Rating sum of boxes (CDR-SB),27 although no differences were observed across the 4 CBS pathologic groups (p = 0.09 for MMSE and p = 0.26 for CDR-SB).
Table 1 Subject demographics
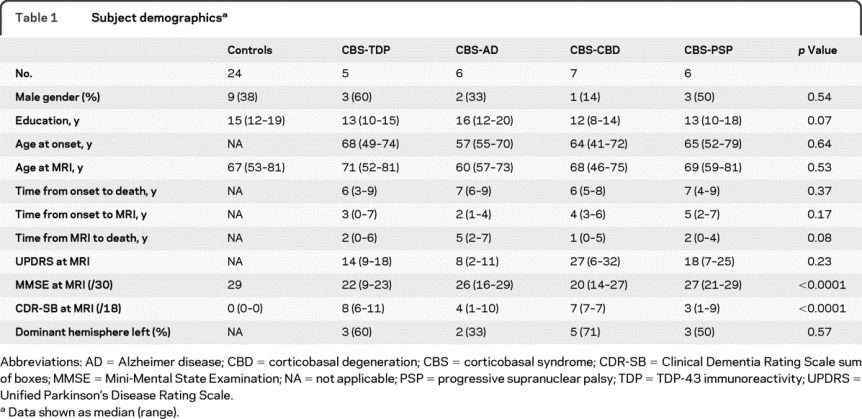
Symptoms reported by the subjects with CBS varied across pathologies without any absolute discernible patterns (table e-1 on the Neurology® Web site at www.neurology.org). However, of those with CBS-TDP pathology, 60% reported behavioral and executive changes, which was uncommon in the other CBS groups. A family history of neurodegenerative disease was also identified in 80% of the subjects with CBS-TDP (one had a mutation in the GRN gene28). Aphasia was a relatively common complaint across all CBS diagnoses, except for CBS-AD. Neurologic examination findings documented limb apraxia in all 24 subjects with CBS and limb rigidity in almost 90% of subjects. Axial rigidity was uncommon. Cortical sensory loss was present across all groups, except for CBS-PSP. Limb myoclonus was most common in the subjects with CBS-AD but was also identified in 2 subjects with CBS-CBD. Apraxia of speech (AOS) was most common in CBS-CBD but was also identified in 2 subjects with CBS-PSP and 2 subjects with CBS-TDP. While AOS was identified in the subjects with CBS-CBD and subjects with CBS-PSP at presentation, AOS developed later in both subjects with CBS-TDP. Vertical supranuclear palsy was present in half of the subjects with CBS-PSP, as well as in one subject with CBS-CBD, but was absent in all subjects with CBS-AD and subjects with CBS-TDP.
No significant differences were observed across the CBS pathologic groups for any neuropsychological tests (table e-2), although there was a trend for a difference in Controlled Oral Word Association Test, with lowest scores observed in CBS-TDP and CBS-CBD (p = 0.07).
Pathologic findings.
Detailed histopathologic examination (table e-1) of all CBS-TDP cases revealed TDP-43 immunoreactive neuronal cytoplasmic inclusions, and short dystrophic neurites in keeping with TDP-43 type 1 histology.17 All 5 cases also had neuronal intranuclear inclusions. All 6 pathologically confirmed CBS-AD cases had a Braak neurofibrillary tangle stage of VI11,29 and hence met criteria for high probability AD.20 None of the CBS-TDP, CBS-CBD, or CBS-PSP cases, however, met criteria for high probability AD. Lewy body disease was observed in 2 of the CBS-AD cases (one transitional and one diffuse),11 but none of the CBS-TDP, CBS-CBD, or CBS-PSP cases.
Voxel-based morphometry.
Patterns of gray matter loss in each CBS pathologic group compared to controls are shown in figure 1. Regions of loss survived correction for multiple comparisons using FDR p < 0.001 in all groups except for the PSP group. The PSP results are therefore shown uncorrected for multiple comparisons at p < 0.001. Widespread patterns of gray matter loss were identified in the dominant hemisphere in both the CBS-TDP and CBS-AD groups, although the patterns of loss differed across these 2 groups. CBS-TDP showed loss throughout medial and lateral frontal lobes and temporal lobes, with some involvement of parietal lobe in the dominant hemisphere. Similar, although less severe, patterns of loss were identified in the nondominant hemisphere with frontal and posterior lateral temporal loss. In contrast, CBS-AD showed severe gray matter loss in lateral parietal lobe, precuneus, and posterior lateral temporal in the dominant hemisphere, with relative sparing of prefrontal cortex and medial temporal lobe. The nondominant hemisphere showed less severe involvement of the same regions. The patterns of loss observed in CBS-CBD were more focused and involved premotor cortex spreading to the inferior and superior posterior frontal lobes, and SMA. Similar patterns were identified in CBS-PSP, although they did not survive correction for multiple comparisons and there was a relative sparing of the inferior frontal lobe. Gray matter loss was observed in the insula, with mild loss in the caudate, in all CBS groups.

Figure 1 Patterns of gray matter loss in each corticobasal syndrome (CBS) pathologic group compared to controls
Surface renderings showing regions of gray matter loss in the dominant and nondominant hemisphere of CBS-TDP, CBS-AD, CBS-CBD, and CBS-PSP compared to controls. All results are shown after correction for multiple comparisons using the false discovery rate (FDR) at p < 0.001, except for the results from the CBS-PSP group, which are shown uncorrected at p < 0.001. AD = Alzheimer disease; CBD = corticobasal degeneration; PSP = progressive supranuclear palsy; TDP = TDP-43 immunoreactivity.
The conjunction analysis showed that the only regions of gray matter loss common to all CBS pathologic groups were found in premotor cortex and insula in the dominant hemisphere and SMA in both the dominant and nondominant hemispheres (figure 2). Direct comparisons showed that CBS-TDP had greater loss in lateral prefrontal cortex in both dominant and nondominant hemispheres, and medial prefrontal cortex and posterior temporal lobe in the dominant hemisphere than the other CBS pathologies (figure 2). Conversely, CBS-AD showed greater loss predominantly in superior parietal lobe and precuneus in both dominant and nondominant hemispheres, and occipital lobe in the dominant hemisphere compared to the other CBS pathologies (figure 2). No regions were found to have greater loss in CBS-CBD and CBS-PSP when compared to all other CBS subjects. These group differences remained significant after adjustment for MMSE.

Figure 2 Regions of gray matter loss common to all corticobasal syndrome (CBS) pathologic groups and different across groups
Surface renderings showing the results of 3 statistical comparisons: 1) regions of gray matter loss that were common to all CBS pathologic groups using a conjunction analysis, 2) regions of gray matter loss in the CBS-TDP group compared to all other CBS pathologic groups, and 3) regions of gray matter loss in the CBS-AD group compared to all other CBS pathologic groups. Results are shown uncorrected for multiple comparisons at p < 0.001. AD = Alzheimer disease; CBD = corticobasal degeneration; TDP = TDP-43 immunoreactivity.
Atlas-based parcellation.
Significant differences were observed across the CBS pathologic groups for all ROIs, except the nondominant SMA, lateral parietal lobe, and caudate, and both dominant and nondominant medial temporal lobes (table 2). On post hoc testing, CBS-TDP showed significantly greater negative Z scores in dominant and nondominant inferior frontal lobe and insula, and dominant superior frontal lobe (figure 3), caudate, and lateral temporal lobe than the other 3 CBS pathologic groups (table 2). CBS-AD showed significantly greater negative Z scores in the dominant parietal (figure 3) and lateral temporal lobes compared to CBS-CBD and CBS-PSP, and had nonsignificant larger negative Z scores in the parietal lobe than CBS-TDP (table 2). Finally, CBS-CBD showed significantly larger negative Z scores in the dominant inferior frontal lobes, nondominant superior frontal lobes, and nondominant insula than CBS-PSP (table 2). All significant group differences persisted after adjustment for MMSE.
Table 2 Average region of interest gray matter Z scores for each CBS pathologic group
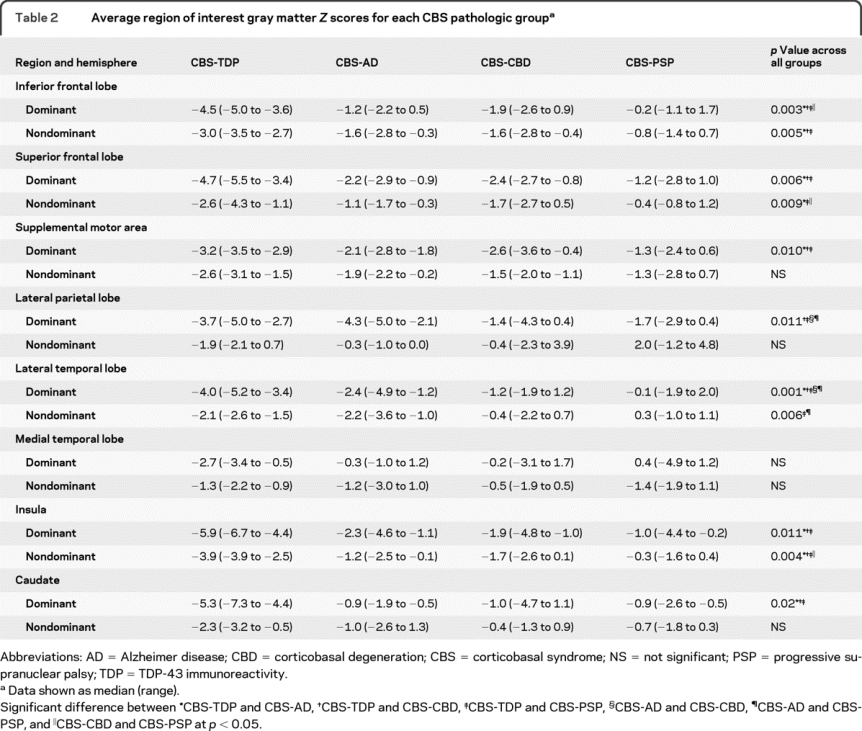

Figure 3 Scatterplots showing individual level volumetric data for 2 regions of interest
Z scores of the superior frontal lobe (A) and parietal lobe (B) in the dominant hemisphere are plotted for each corticobasal syndrome (CBS) pathologic group and controls. The boxes indicate the median and interquartile range of the distributions while the horizontal lines extending from the boxes stop at the most extreme data points. All CBS pathologic groups showed greater negative Z scores than controls for both regions. CBS-TDP showed the greatest negative Z score for the superior frontal lobe, whereas CBS-AD showed the greatest negative Z score for the parietal lobe. AD = Alzheimer disease; CBD = corticobasal degeneration; PSP = progressive supranuclear palsy; TDP = TDP-43 immunoreactivity.
DISCUSSION
This study has demonstrated that imaging patterns of gray matter loss differ in subjects with CBS dependent on the underlying pathology. The MRI were flipped to align the more severely affected hemispheres, allowing us to make conclusions concerning patterns of loss in both dominant and nondominant hemispheres. The CBS-TDP and CBS-AD groups were both associated with more widespread patterns of gray matter loss than the other groups, although there was overlap.
The CBS-TDP group was associated with imaging loss predominantly in the prefrontal cortex and posterior temporal lobes and showed significantly more loss in these regions in the dominant hemisphere than all the other groups. These patterns are typical of FTLD-TDP; we have previously shown that FTLD-TDP is associated with loss in the frontal and posterior temporal lobes.24,30,31 Parietal lobe atrophy can also be observed in FTLD-TDP, particularly when associated with a GRN mutation.13,32 One of the cases in our CBS-TDP cohort had a mutation in GRN, and 4 had a family history of neurodegenerative disease. Interestingly, all CBS-TDP cases were FTLD-TDP type 1, which has been linked to GRN mutations.33 Familial CBS has also been previously associated with mutations in the GRN gene.34,35
The CBS-AD group was associated with a predominantly posterior pattern of gray matter imaging loss, involving parietal, posterior temporal, and occipital lobes, with sparing of medial temporal lobes, as we have previously noted.11,12 We have previously demonstrated using many of the same subjects that CBS-AD has greater loss in the temporoparietal lobes than CBS-CBD,11 but this study extends these findings by showing that CBS-AD also has greater involvement of the temporoparietal lobes than CBS-PSP. When compared to all other CBS pathologies using VBM, the CBS-AD group only showed greater loss in the superior parietal and occipital regions, and not in the temporal lobe. This reflects the fact that temporoparietal loss was also a feature of CBS-TDP in this study, likely due to the familial nature of CBS-TDP as discussed above. These results therefore suggest that although temporoparietal atrophy is a signature of AD,12 it may not be so helpful when assessing familial cases.
The CBS-CBD and CBS-PSP groups showed less widespread imaging patterns of loss, with both predominantly affecting premotor cortex, posterior superior frontal lobe, and SMA. However, the degree of loss was less in CBS-PSP and the inferior frontal lobe appeared to be involved only in CBS-CBD. Pathologic changes have been observed in these posterior frontal regions in both CBD and PSP.36 Brainstem pathology is also a feature of PSP.18 The fact that we did not observe gray matter changes in brainstem in our subjects with CBS-PSP concurs with the finding that pathology shifts to the cortex in cases with PSP pathology and atypical clinical syndromes.37,38 Although some of our subjects with CBS-PSP had vertical supranuclear gaze palsy, none had falls and so would not meet research clinical criteria for PSP.39
Premotor cortex, insula, and SMA imaging abnormalities identified in CBS-CBD and CBS-PSP were also identified in CBS-TDP and CBS-AD, and hence were found to be common to all the CBS pathologic groups. It is therefore likely that these regions are important to the clinical presentation of CBS. The SMA and premotor cortex have been shown to be associated with ideomotor apraxia in CBS40 and, indeed, all subjects with CBS had limb apraxia in this study, which is one of the fundamental clinical hallmarks of CBS. The caudate nucleus showed mild loss across all the CBS pathologic groups, although was less severely affected than the other regions and was not found to be common to all groups in the conjunction analysis. An asymmetric imaging pattern was also observed across all the CBS pathologic groups, which is consistent with previous clinical and imaging studies.9,10,21 The additional regions of loss identified in CBS-TDP and CBS-AD are less likely to be contributing to the CBS phenotype, and more likely reflect the constellation of additional symptoms that occur together with CBS. For example, the presence of prefrontal loss in CBS-TDP fits with the fact that behavioral changes and executive dysfunction were common in this group. Nevertheless, these additional regions could be useful in helping to predict the presence of these pathologies in patients with a CBS phenotype.
Assessing atrophy patterns separately in each of the different pathologies that can underlie CBS was an important advantage of our study. One of our earlier studies lumped different pathologies together and failed to identify any differences in atrophy on visual inspection between CBS-CBD and CBS with other pathologies.21 Although the number of subjects in each pathologic group was relatively small in the current study, we were still able to identify significant differences across groups. Thus, widespread and severe patterns of atrophy in the context of CBS should point to a pathologic diagnosis of either FTLD-TDP or AD, with frontotemporal loss suggesting FTLD-TDP and temporoparietal loss suggesting AD. More focal patterns of loss involving premotor cortex and SMA would be more suggestive of underlying CBD or PSP pathology, with sparing of the inferior frontal lobe and presence of vertical supranuclear palsy suggesting PSP. A trend for difference in MMSE was observed across groups, although we demonstrated that group differences remained after adjustment for MMSE score, showing that they do not simply reflect more impaired disease severity. Although the VBM analyses were performed at the group level, the subject level data suggest that these findings could be useful in predicting pathology in individual subjects, as well as aid in the identification of patients with CBS for appropriate clinical trial inclusions/exclusion for future interventions targeting β-amyloid, tau, or TDP-43.
AUTHOR CONTRIBUTIONS
Statistical analysis was conducted by Keith A. Josephs.
ACKNOWLEDGMENT
The authors thank Dr. Rosa Rademaker and Matt Baker, Mayo Clinic, for performing genetic analyses.
DISCLOSURE
Support for several investigators was provided by the Robert H. and Clarice Smith and Abigail Van Buren Alzheimer's Disease Research Program of the Mayo Foundation and the NIH Construction Grant (NIH C06 RR018898). Dr. Whitwell receives research support from the Dana Foundation and the NIH (R01-DC010367 [coinvestigator] and R01-AG037491 [coinvestigator]). Dr. Jack serves as a consultant for Elan Corporation and GE Healthcare; receives research support from Pfizer Inc., the NIH (NIA R01-AG11378 [PI] and U01 AG024904-01 [coinvestigator]), and the Alexander Family Alzheimer's Disease Research Professorship of the Mayo Foundation; and holds stock in GE Healthcare and Johnson & Johnson. Dr. Boeve has served as a consultant to GE Healthcare; receives royalties from the publication of Behavioral Neurology of Dementia (Cambridge Medicine, 2009); and receives research support from Cephalon, Inc., the NIH (P50 AG16574 [coinvestigator], UO1 AG06786 [coinvestigator], and RO1 AG15866 [coinvestigator]), the Alzheimer's Association, and from the Center for Inherited Disease Research (U24 AG026395 [coinvestigator]). Dr. Parisi serves on scientific advisory boards for the US Government Defense Health Board and the Subcommittee for Laboratory Services and Pathology; serves as a Section Editor for Neurology; receives royalties from the publication of Principles & Practice of Neuropathology, 2nd ed. (Oxford University Press, 2003); and receives research support from the NIH (NS32352-13 [coinvestigator]). Dr. Ahlskog received the Fred Springer Award from the American Parkinson's Disease Association; serves on the editorial boards of Parkinsonism and Related Disorders and Clinical Neuropharmacology; receives royalties from the publication of The Parkinson's Disease Treatment Book (Oxford University Press, 2005), Parkinson's Disease Treatment Guide for Physicians (Oxford University Press, 2009), Parkinson's Disease and Movement Disorders (Humana Press, 2000), and Surgical Treatment of Parkinson's Disease and Other Movement Disorders (Humana Press, 2003); and receives research support from NIH (NINDS P50 NS 40256-R [coinvestigator] and ES010751-10 [PI]). Dr. Drubach reports no disclosures. Mr. Senjem has received research support from Pfizer Inc. Dr. Knopman serves as Deputy Editor of Neurology®; has served on data safety monitoring boards for sanofi-aventis, GlaxoSmithKline, and Eli Lilly and Company; is an investigator in clinical trials sponsored by Elan Corporation, Baxter International Inc., and Forest Laboratories, Inc.; and receives research support from the NIH (R01-AG023195 [PI], R01-AG11378 [coinvestigator], P50 AG16574 [coinvestigator], U01 AG 06786 [coinvestigator], and R01 HL70825 [coinvestigator]). Dr. Petersen serves on scientific advisory boards for Elan Corporation, Wyeth, and GE Healthcare; receives royalties from publishing Mild Cognitive Impairment (Oxford University Press, 2003); and receives research support from the NIH/NIA (P50-AG16574 [PI], U01-AG06786 [PI], R01-AG11378 [coinvestigator], and U01–24904 (coinvestigator)]. Dr. Dickson serves on the editorial boards of the American Journal of Pathology, Journal of Neuropathology and Experimental Neurology, Brain Pathology, Neurobiology of Aging, Journal of Neurology Neurosurgery and Psychiatry, Annals of Neurology, and Neuropathology; and receives research support from the NIH (P50-AG25711 [CL], P50-AG16574 [CL], P50-NS40256 [PI], P01-AG17216 [PI], P01-AG03949 [coinvestigator], and R01-AG15866 [coinvestigator]). Dr. Josephs receives research support from the NIH (NIDCD R01- DC010367 [PI], NIA R01-AG037491 [PI], and NINDS 2P50 NS040256-10 [coinvestigator]) and the Dana Foundation.
Supplementary Material
Address correspondence and reprint requests to Dr. Jennifer L. Whitwell, Department of Radiology, 200 1st Street SW, Rochester, MN 55905 whitwell.jennifer@mayo.edu
Supplemental data at www.neurology.org
Study funding: Supported by The Dana Foundation, NIH grants R01-DC010367, P50-AG16574, U01-AG06786, R01-AG11378, as well as the generous support of the Robert H. and Clarice Smith and Abigail Van Buren Alzheimer's Disease Research Program of the Mayo Foundation, the Alexander Family Alzheimer's Disease Research Professorship of the Mayo Foundation, and the NIH Construction Grant (NIH C06 RR018898).
Disclosure: Author disclosures are provided at the end of the article.
Received May 6, 2010. Accepted in final form August 9, 2010.
REFERENCES
- 1.Boeve BF, Lang AE, Litvan I. Corticobasal degeneration and its relationship to progressive supranuclear palsy and frontotemporal dementia. Ann Neurol 2003;54(suppl 5):S15–S19. [DOI] [PubMed] [Google Scholar]
- 2.Riley DE, Lang AE, Lewis A, et al. Cortical-basal ganglionic degeneration. Neurology 1990;40:1203–1212. [DOI] [PubMed] [Google Scholar]
- 3.Boeve BF, Maraganore DM, Parisi JE, et al. Pathologic heterogeneity in clinically diagnosed corticobasal degeneration. Neurology 1999;53:795–800. [DOI] [PubMed] [Google Scholar]
- 4.Hu WT, Rippon GW, Boeve BF, et al. Alzheimer's disease and corticobasal degeneration presenting as corticobasal syndrome. Mov Disord 2009;24:1375–1379. [DOI] [PubMed] [Google Scholar]
- 5.Shelley BP, Hodges JR, Kipps CM, et al. Is the pathology of corticobasal syndrome predictable in life? Mov Disord 2009;24:1593–1599. [DOI] [PubMed] [Google Scholar]
- 6.Mackenzie IR, Neumann M, Bigio EH, et al. Nomenclature and nosology for neuropathologic subtypes of frontotemporal lobar degeneration: an update. Acta Neuropathol 2010;119:1–4. [DOI] [PMC free article] [PubMed] [Google Scholar]
- 7.Neumann M, Sampathu DM, Kwong LK, et al. Ubiquitinated TDP-43 in frontotemporal lobar degeneration and amyotrophic lateral sclerosis. Science 2006;314:130–133. [DOI] [PubMed] [Google Scholar]
- 8.Boxer AL, Geschwind MD, Belfor N, et al. Patterns of brain atrophy that differentiate corticobasal degeneration syndrome from progressive supranuclear palsy. Arch Neurol 2006;63:81–86. [DOI] [PubMed] [Google Scholar]
- 9.Hassan A, Whitwell JL, Boeve BF, et al. Symmetric corticobasal degeneration (S-CBD). Parkinsonism Relat Disord 2010;16:208–214. [DOI] [PMC free article] [PubMed] [Google Scholar]
- 10.Josephs KA, Whitwell JL, Dickson DW, et al. Voxel-based morphometry in autopsy proven PSP and CBD. Neurobiol Aging 2008;29:280–289. [DOI] [PMC free article] [PubMed] [Google Scholar]
- 11.Josephs KA, Whitwell JL, Boeve BF, et al. Anatomical differences between CBD and Alzheimer's disease presenting as corticobasal syndrome. Mov Disord 2010;25:1246–1252. [DOI] [PMC free article] [PubMed] [Google Scholar]
- 12.Whitwell JL, Jack CR Jr, Przybelski SA, et al. Temporoparietal atrophy: a marker of AD pathology independent of clinical diagnosis. Neurobiol Aging Epub 2009 Nov 13. [DOI] [PMC free article] [PubMed]
- 13.Whitwell JL, Jack CR Jr, Boeve BF, et al. Voxel-based morphometry patterns of atrophy in FTLD with mutations in MAPT or PGRN. Neurology 2009;72:813–820. [DOI] [PMC free article] [PubMed] [Google Scholar]
- 14.Lezak M. Neuropsychological Assessment, 4th ed. New York: Oxford University Press; 2004. [Google Scholar]
- 15.Mirra SS, Heyman A, McKeel D, et al. The Consortium to Establish a Registry for Alzheimer's Disease (CERAD): part II: standardization of the neuropathologic assessment of Alzheimer's disease. Neurology 1991;41:479–486. [DOI] [PubMed] [Google Scholar]
- 16.Mackenzie IR, Neumann M, Bigio EH, et al. Nomenclature for neuropathologic subtypes of frontotemporal lobar degeneration: consensus recommendations. Acta Neuropathol 2009;117:15–18. [DOI] [PMC free article] [PubMed] [Google Scholar]
- 17.Mackenzie IR, Baborie A, Pickering-Brown S, et al. Heterogeneity of ubiquitin pathology in frontotemporal lobar degeneration: classification and relation to clinical phenotype. Acta Neuropathol 2006;112:539–549. [DOI] [PMC free article] [PubMed] [Google Scholar]
- 18.Hauw JJ, Daniel SE, Dickson D, et al. Preliminary NINDS neuropathologic criteria for Steele-Richardson-Olszewski syndrome (progressive supranuclear palsy). Neurology 1994;44:2015–2019. [DOI] [PubMed] [Google Scholar]
- 19.Dickson DW, Bergeron C, Chin SS, et al. Office of Rare Diseases neuropathologic criteria for corticobasal degeneration. J Neuropathol Exp Neurol 2002;61:935–946. [DOI] [PubMed] [Google Scholar]
- 20.The National Institute on Aging, and Reagan Institute Working Group on Diagnostic Criteria for Neuropathologic Assessment of Alzheimer's Disease. Consensus recommendation for the postmortem diagnosis of Alzheimer's disease. Neurobiol Aging 1997;18(suppl 1):S1–S2. [PubMed] [Google Scholar]
- 21.Josephs KA, Tang-Wai DF, Edland SD, et al. Correlation between antemortem magnetic resonance imaging findings and pathologically confirmed corticobasal degeneration. Arch Neurol 2004;61:1881–1884. [DOI] [PubMed] [Google Scholar]
- 22.Ashburner J, Friston KJ. Voxel-based morphometry–the methods. Neuroimage 2000;11:805–821. [DOI] [PubMed] [Google Scholar]
- 23.Ashburner J, Friston KJ. Unified segmentation. Neuroimage 2005;26:839–851. [DOI] [PubMed] [Google Scholar]
- 24.Whitwell JL, Jack CR Jr, Senjem ML, et al. MRI correlates of protein deposition and disease severity in postmortem frontotemporal lobar degeneration. Neurodegener Dis 2009;6:106–117. [DOI] [PMC free article] [PubMed] [Google Scholar]
- 25.Tzourio-Mazoyer N, Landeau B, Papathanassiou D, et al. Automated anatomical labeling of activations in SPM using a macroscopic anatomical parcellation of the MNI MRI single-subject brain. Neuroimage 2002;15:273–289. [DOI] [PubMed] [Google Scholar]
- 26.Folstein MF, Folstein SE, McHugh PR. “Mini-mental state”: a practical method for grading the cognitive state of patients for the clinician. J Psychiatr Res 1975;12:189–198. [DOI] [PubMed] [Google Scholar]
- 27.Hughes CP, Berg L, Danziger WL, et al. A new clinical scale for the staging of dementia. Br J Psychiatry 1982;140:566–572. [DOI] [PubMed] [Google Scholar]
- 28.Kelley BJ, Haidar W, Boeve BF, et al. Prominent phenotypic variability associated with mutations in Progranulin. Neurobiol Aging 2009;30:739–751. [DOI] [PMC free article] [PubMed] [Google Scholar]
- 29.Braak H, Del Tredici K, Rub U, et al. Staging of brain pathology related to sporadic Parkinson's disease. Neurobiol Aging 2003;24:197–211. [DOI] [PubMed] [Google Scholar]
- 30.Whitwell JL, Jack CR Jr, Senjem ML, Josephs KA. Patterns of atrophy in pathologically confirmed FTLD with and without motor neuron degeneration. Neurology 2006;66:102–104. [DOI] [PMC free article] [PubMed] [Google Scholar]
- 31.Whitwell JL, Josephs KA, Rossor MN, et al. Magnetic resonance imaging signatures of tissue pathology in frontotemporal dementia. Arch Neurol 2005;62:1402–1408. [DOI] [PubMed] [Google Scholar]
- 32.Whitwell JL, Jack CR Jr, Baker M, et al. Voxel-based morphometry in frontotemporal lobar degeneration with ubiquitin-positive inclusions with and without progranulin mutations. Arch Neurol 2007;64:371–376. [DOI] [PMC free article] [PubMed] [Google Scholar]
- 33.Josephs KA, Ahmed Z, Katsuse O, et al. Neuropathologic features of frontotemporal lobar degeneration with ubiquitin-positive inclusions with progranulin gene (PGRN) mutations. J Neuropathol Exp Neurol 2007;66:142–151. [DOI] [PubMed] [Google Scholar]
- 34.Benussi L, Ghidoni R, Pegoiani E, et al. Progranulin Leu271LeufsX10 is one of the most common FTLD and CBS associated mutations worldwide. Neurobiol Dis 2009;33:379–385. [DOI] [PubMed] [Google Scholar]
- 35.Masellis M, Momeni P, Meschino W, et al. Novel splicing mutation in the progranulin gene causing familial corticobasal syndrome. Brain 2006;129:3115–3123. [DOI] [PubMed] [Google Scholar]
- 36.Dickson DW. Neuropathologic differentiation of progressive supranuclear palsy and corticobasal degeneration. Journal of neurology 1999;246(suppl 2):II6–15. [DOI] [PubMed] [Google Scholar]
- 37.Josephs KA, Boeve BF, Duffy JR, et al. Atypical progressive supranuclear palsy underlying progressive apraxia of speech and nonfluent aphasia. Neurocase 2005;11:283–296. [DOI] [PubMed] [Google Scholar]
- 38.Tsuboi Y, Josephs KA, Boeve BF, et al. Increased tau burden in the cortices of progressive supranuclear palsy presenting with corticobasal syndrome. Mov Disord 2005;20:982–988. [DOI] [PubMed] [Google Scholar]
- 39.Litvan I, Agid Y, Calne D, et al. Clinical research criteria for the diagnosis of progressive supranuclear palsy (Steele-Richardson-Olszewski syndrome): report of the NINDS-SPSP international workshop. Neurology 1996;47:1–9. [DOI] [PubMed] [Google Scholar]
- 40.Huey ED, Pardini M, Cavanagh A, et al. Association of ideomotor apraxia with frontal gray matter volume loss in corticobasal syndrome. Arch Neurol 2009;66:1274–1280. [DOI] [PMC free article] [PubMed] [Google Scholar]
Associated Data
This section collects any data citations, data availability statements, or supplementary materials included in this article.