

Abstract
2-Aminopurine (2AP) is a fluorescent adenine analog that probes mainly base stacking in nucleic acids. We labeled the loop or the stem of the RNA hairpin gacUACGguc with 2AP to study folding thermodynamics and kinetics at both loci. Thermal melts and fast laser temperature jumps detected by 2AP fluorescence monitored the stability and folding/unfolding kinetics. The observed thermodynamic and kinetic traces of the stem and loop mutants, though strikingly different at a first glance, can be fitted to the same free-energy landscape. The differences between the two probe locations arise because base stacking decreases upon unfolding in the stem, whereas it increases in the loop. We conclude that 2AP is a conservative adenine substitution for mapping out the contributions of different RNA structural elements to the overall folding process. Molecular dynamics (MD) totaling 0.6 μsec were performed to look at the conformations populated by the RNA at different temperatures. The combined experimental data, and MD simulations lead us to propose a minimal four-state free-energy landscape for the RNA hairpin. Analysis of this landscape shows that a sequential folding model is a good approximation for the full folding dynamics. The frayed state formed initially from the native state is a heterogeneous ensemble of structures whose stem is frayed either from the end or from the loop.
Keywords: energy landscape, temperature jump, 2-aminopurine, molecular dynamics simulation
INTRODUCTION
The folding dynamics of even the smallest RNA hairpin have been theorized and experimentally demonstrated to involve multiple states on a rugged free-energy landscape (Chen and Dill 2000; Ma et al. 2006; Stancik and Brauns 2008). Secondary structural elements play a critical role in the overall folding process (Cho et al. 2009). Different probes and time scales access different folding coordinates and, hence, provide complementary pictures of the folding landscape (Koplin et al. 2005; Ma et al. 2007; Hyeon and Thirumalai 2008; Stancik and Brauns 2008; Sarkar et al. 2009). Molecular dynamics simulations (MD) of RNA have improved with the availability of better force-field parameters and faster computers (MacKerell et al. 1998; Garcia and Paschek 2008; Villa et al. 2008). MD simulations now reach the microsecond experimental timescale of the fastest-folding RNA hairpins.
Temperature titration and fast temperature jumps can be used to probe folding stability and kinetics of RNA, and thus reconstruct their energy landscapes (Williams et al. 1989; Kuznetsov et al. 2008). The connection between folding thermodynamics and kinetics is brought forth through these experiments (Pan et al. 1999). In particular, the folding of the tetraloop motif has generated significant interest in the recent past. It is an important structural element in the hierarchical folding process of RNA, as secondary structure frequently nucleates near loop regions. The UNCG, GNRA, and CUUG tetraloops constitute a part of the stable and phylogenetically conserved tetraloop family (Bevilacqua and Blose 2008).
Previous T-Jump experiments on UNCG tetraloops were performed with the following probes: (1) UV absorbance at 280 nm (Ma et al. 2006) provides a global probe of the folding dynamics as all of the individual nucleotides contribute to the absorption signal in this region; (2) IR absorbance (Stancik and Brauns 2008) monitors primarily base stacking (1574 cm−1) and hydrogen bonding (1669 cm−1); (3) the adenine analog 2-aminopurine (abbreviated as 2AP, A* in the loop, or a* in the stem) fluoresces most strongly when base stacking is lost (Menger et al. 2000; Hardman and Thompson 2006; Sarkar et al. 2009). In our previous work, we looked at the folding of the RNA hairpin ga*cUUCGguc (Sarkar et al. 2009) after earlier studies indicated that 2AP should be an excellent reporter of folding thermodynamics and kinetics (Ballin et al. 2007).
Here, we investigate the ability of 2AP to serve as a conservative probe at two archetypal RNA sites, stem and loop. Ideally, substituting 2AP at different adenine positions would yield structurally localized information about RNA folding without changing the overall folding mechanism. Our starting point is the gacUACGguc 10-nucleotide hairpin. We study its stem mutant ga*cUACGguc and its loop mutant gacUA*CGguc by thermal denaturation, fast (nanosecond) temperature jump experiments, and molecular dynamics simulation.
We find that the stem and loop mutants yield opposite signals for thermal melting and during relaxation kinetics, because stacking decreases in the stem and increases in the loop during unfolding. A global fit of all experimental data of both hairpin mutants allows us to construct a two-dimensional free-energy landscape for gacUACGguc, and we show that sequential population flow through four states is a good approximation to the full dynamics. However, MD simulation shows that the state formed from the native state by fraying of the stem is a heterogeneous ensemble and involves substates unzipping from the end of the stem as well as from the loop.
RESULTS
Thermal denaturation
Melting the RNA reduces native base stacking in the stem, but increases nonnative base stacking in the loop. To show this, fluorescence melts were obtained for the stem mutant ga*cUACGguc, and for the loop mutant gacUA*CGguc. At 20°C, the loop mutant has approximately 20 times higher fluorescence intensity than the stem mutant, indicating less stacking. As the temperature is raised, their fluorescence trends go in opposite directions, even after normalization by the corresponding trinucleotide controls to reduce the contribution of nonspecific local interactions (Fig. 1). Above 70°C, stem and loop mutants lie within a factor of two of one another and experience similar residual stacking (Supplemental Fig. S1 shows intensities without normalization). It is worth noting that even dilute 2AP monomer and trinucleotide controls have a factor of two intensity variation over the temperature range that we probed (Supplemental Fig. S1).
FIGURE 1.

Experimental thermal denaturation and temperature jump data fitted by a four-state model. (A) Thermodynamic data and model. (B,C) Relative fluorescence lifetime change and model fit for the loop mutant at two of the six temperatures measured (see also Supplemental material). (D,E) Relative fluorescence lifetime change and model fit for the stem mutant at two of the five temperatures measured.
The fluorescence decay lifetimes of the two mutants as a function of temperature further support the opposite behavior of loop and stem (Supplemental Fig. S3). The fluorescence lifetime is longer for the loop mutant, where 2AP is not involved in base stacking. The temperature trends upon RNA melting are opposite for loop and stem, again indicating that base stacking is lost in the stem and gained in the loop at high temperature.
The two mutants melt nearly identically, showing that the introduction of 2AP into the loop or stem does not differentially perturb the stability of the hairpin. To look for differences between the mutants, we compared the ultraviolet absorbance upon melting of the two mutants (Supplemental Fig. S2). UV absorbance yields identical melting temperatures within measurement uncertainty (±1°C). The fitted melting temperatures of the two RNA mutants obtained from absorbance are identical within measurement uncertainty (±1°C).
Temperature jump kinetics
Temperature jump relaxation kinetics of the loop and stem mutants reveal three phases in both cases, suggesting at least four interconnected states in each mutant. The relaxation traces are shown in Figure 1B–E (additional data in Supplemental Fig. S1). Laser T-jumps were performed at 10°C intervals. To probe the structural changes of the RNA upon relaxation to new equilibrium populations following the T-jump, 2AP fluorescence was excited by a 280-nm UV pulse every 14 nsec. In order to improve the signal-to-noise ratio, 20 successive fluorescence decays were binned into 280-nsec windows. χ(t) in Figure 1 is a normalized signal that follows the change of the fluorescence decay upon RNA unfolding from 0 to 500 μsec in 280-nsec steps (see Materials and Methods). The stem mutant produced kinetic phases with positive amplitude, while the loop mutant also produced a slow negative kinetic phase at some temperatures. Fits of the individual decays required three exponentials to account for the data within measurement uncertainty, but we chose to fit the data to global three- or four-state models, as detailed next.
Global thermodynamic and kinetic model
A global four-state model simultaneously fitted all of the experimental data: Thermodynamics of both mutants and all temperature jumps over the full temperature range are accounted for (Fig. 1, black curves). The stem and loop mutants, therefore, can be described by the same minimal free-energy landscape with four states. We obtained an excellent fit when the four-state model allowed interconversion between all four states N (native), E (frayed), U (unfolded), and U′ (unstacked) (Supplemental Fig. S6). We obtained a nearly equally good fit (Fig. 1; Supplemental Fig. S1) with a simplified sequential model (N ⇄ E ⇄ U ⇄ U′). Based on the simulations below, we describe the states as follows: N is the native state; E has the stem frayed either from the loop side or from the end; U is an unfolded state where all the stem hydrogen bonds have broken, while some base stacking remains; and U′ is an unstacked state where all hydrogen bonds and most of the base stacks are lost.
We fitted other models with a variable number of states, thermodynamic parameters, and barriers between states. The best three-state model provided a qualitative global fit, but was unable to quantitatively fit all the data simultaneously (Supplemental Fig. S5). Fitting the stem and loop mutants separately also yielded excellent fits, but no better than the global fit. Enforcing two strictly parallel paths in the four-state model did not yield a satisfactory fit (Supplemental Fig. S7).
The quantitative results of the global four-state model are shown in Table 1 (sequential) and Table 2 (full). The tables show a reference temperature T0 and temperature dependence of the free energy ΔG(1) = dΔG/dT|T0 for each state, as well as the activation energy ΔG(0)† and its temperature dependence ΔG(1)† for each state. The superscript dagger (†) indicates an activation barrier as opposed to a thermodynamic free energy. The parameters are explained in detail in the Materials and Methods section.
TABLE 1.
Equilibrium thermodynamic parameters and activation energy parameters of the sequential four-state model

TABLE 2.
Equilibrium thermodynamic parameters and activation energies of the four-state model summarized in Scheme 1

The modeled thermodynamic populations of the four states, and a representative set of simulated kinetic population decays are shown in Figure 2. Figure 3 plots a minimalist free-energy landscape obtained from the sequential model as a function of two experimental reaction coordinates Sj =−∂Gj(T)/∂T (state entropy) and Ij (state fluorescence intensity). In principle, any smooth experiment-derived state function such as Sj, Ij, or χj could be used as a reaction coordinate. We used the entropy S because it correlates with the overall disorder of the RNA chain, and I because it monitors base stacking (lower I = greater base stacking). The thick arrows in Figure 3 show the sequential path, and the thin arrow shows an additional path between N and U that appears in the full model at significant amplitude.
FIGURE 2.

Populations thermodynamics and kinetics from the sequential fit. (A) Thermodynamic populations from the four-state sequential model. (B–E) Population decays resulting from the sequential fit.
FIGURE 3.

Free energy landscape at 50°C (near Tm) derived from the sequential fit (χ2 = 0.41) in Figure 1. Entropy (S) and intensity (I) have been used as the reaction coordinates. The values for the coordinates and the relative free energies are obtained from the sequential model. Bold arrows indicate the sequential path. A thin arrow between N and U has been used to indicate the only other contribution from the full model that yields a slightly better fit (χ2 = 0.40). The MD simulation in Figure 4 also shows a trajectory converting E to U′ directly, indicated by a dotted arrow.
Molecular dynamics simulations
We carried out MD simulations to provide a structural interpretation for the four states N, E, U, and U′. A total of 50 nsec-long trajectories were obtained at 32°C for the stem and loop mutants (two for each; Fig. 4). Starting configurations for the two mutants were sampled from a native ensemble obtained by relaxing an initial folded structure at 0°C for 5 nsec.
FIGURE 4.

Molecular dynamics trajectories of RNA hairpin unfolding at 32°C, starting with four native-like structures equilibrated at 0°C: loop mutant (blue and cyan), and stem mutant (red and orange).
The trajectories were analyzed for native base stacking and native hydrogen bonding. A plot of base stacking in the stem and loop versus hydrogen bonding in the stem is shown in Figure 4. Many metastable regions of the trajectory can be seen, where the trajectory maintains a certain number of hydrogen bonds and base stacks before moving on. We grouped these into four states shown by circles. These states provide structural models consistent with the fluorescence signals observed for the experimental states. The grouping is, of course, somewhat arbitrary. In particular, for state E further subgroups could be made, because MD reveals even more substates than are required to minimally fit the experimental data. State E, the early stage of hairpin unfolding, is the most heterogeneous state in terms of number of base stacks and hydrogen bonds.
Representative structures of N, E, U, and U′ are shown in Figure 5. All of the hydrogen bonds and stacking are intact in the native structure N. In the frayed state E, unstacking was observed from both the end and the side near the loop (arrow), and a wide range of hydrogen bonding was found. The unfolded state U shows both stacked and unstacked bases in the stem. Finally, in the unstacked state U′, all of the stacking is lost.
FIGURE 5.

Representative structures of the stem (A) and loop (B) mutants taken from the regions of the stacking-hydrogen bonding plot in Figure 4, where the individual trajectories spent most of their time. Stacked stem bases are shown in red, unstacked stem bases in yellow. 2AP is shown in purple. Loop bases are shown in blue, except for one nonnatively stacked loop base in the unfolded state of the loop mutant (gray). States are labeled with bold letters as in Figure 2, although the correspondence between simulated and measured states is only approximate. In state E, fraying locations may be near the loop, or near the end of the stem (arrows).
The loop does not have any stacked bases in the native state. Base stacking in the loop remained minimal or increased slightly at higher temperature, as shown in the unfolded structure of the loop mutant with the stacked base in gray. After running for 50 nsec at the highest temperature, the loop mutant also populates a completely unstacked state.
DISCUSSION
2AP turns out to be a conservative probe for RNA stability and folding dynamics when substituted for adenine in stem or loop positions. Both RNA mutants could be fitted simultaneously by the same global model (Figs. 1–3). In addition, the absorption melt curves at 260 nm of the stem, and loop mutants are nearly identical (Supplemental Fig. S2). Finally, molecular dynamics trajectories of the two mutants (Fig. 4) go though similar structural stages. Hence, 2AP substitution does not extensively alter the overall stability of a small RNA hairpin or the activation barriers connecting different states. Since 2AP does not significantly perturb a 10-mer RNA, it should be even more applicable as a minimally invasive probe for larger RNAs.
Previous experiments have already shown that 2AP exhibits site-specific fluorescence responses (Ballin et al. 2007). Our results here are in agreement with these observations (Fig. 1). The 2AP fluorescence intensity decreases upon base stacking, as does the lifetime of its fastest (<4 nsec) fluorescence decay phase (Supplemental Fig. S3).
The global experimental fit of the thermal denaturation and kinetic relaxation data is consistent with the gacUACGguc hairpin making a steady progression from more folded states with high stem stacking and no loop stacking, to less folded states with lower stem stacking and slightly increased loop stacking. The transition is not a simple two- or even three-state process. A quantitative global fit required at least four states, which were all significantly populated during relaxation kinetics (Fig. 2). Molecular dynamics trajectories monitoring the unfolding of the hairpin mutants reveal even more metastable states, which the 2AP probe may not be able to differentiate experimentally. In particular, state E, which immediately follows the native state upon unfolding, is heterogeneous on a plot of stacking versus hydrogen bonding (Fig. 4). It contains structures frayed near the loop as well as near the end (Fig. 5), and a wide range of hydrogen bonding. Furthermore, E and U′ interconverted directly in one of the MD trajectories (red in Fig. 3), and some of the microstates in U may only be able to interconvert by fully unstacking, i.e., going through U′. Thus, the full free-energy landscape of the RNA is likely to be even more complex than the minimalist model fitted to experiment and shown in Figure 3.
Figure 3 shows that it is possible to extract a low-dimensional free-energy landscape from the thermodynamic and kinetic data. The black arrows show the main population flows, and the letters N, E, U, and U′ can be identified with structural states as shown in Figure 5. Such an identification must be tentative: The reaction coordinates I and S in Figure 3 are not the same as the computational reaction coordinates of base stacking and hydrogen bonding between bases in Figure 4. Perhaps the hardest tasks for molecular dynamics simulation nowadays is not the simulations themselves, nor even the inaccuracies of the force fields, but computing experimental observables instead of purely theoretical coordinates such as “number of native contacts.”
The thickness of the arrows in Figure 3 indicates which interconversions among states are most likely, based on the global model whose parameters are summarized in Table 2. It is clear that the simplified sequential model N ⇄ E ⇄ U ⇄ U′ summarized in Table 1 is not a bad approximation to the full dynamics on the two-dimensional free-energy landscape. It misses a minority path in the experiment, whereby N and U interconvert directly, and another minority path seen in the MD simulation, where E and U′ interconvert directly (Fig. 3).
For a small RNA hairpin, it is not surprising that the experiment, which measures populations Pi ∼ exp[−G(xi)/RT] along a multitude of possible paths, can be fitted by a single path nearly as well as by the complete model. Here R is the molar gas constant and T the absolute temperature. The dominant path simply has to lie ≥2RT below the next available path, and almost all of the population will go through it. For a larger RNA, the likelihood of nearly degenerate paths increases. By analogy, a single path usually approximates the folding of small proteins, but mutations or solvent conditions reveal additional possible mechanisms (Dumont et al. 2006). This is especially likely if the experimental observables cannot distinguish all of the structural variation, such as the substates of state E in the RNA-folding case studied here.
MATERIALS AND METHODS
RNA design and sample preparation
RNA oligonucleotides with 2-aminopurine modifications were purchased from Thermo Scientific. The following sequences were purchased: gacUA*CGguc, ga*cUACGguc, ga*c, UA*C. The two 3-nt sequences were used as controls. They form a fragment of the stem and loop sequences with the 2AP in the middle. 2AP itself was used as an additional control. The samples were dissolved in a low-salt P10E0.1 buffer (10 mM sodium phosphate and 0.1 mM Na2EDTA at pH 7.1). This buffer is known to favor hairpin conformation (Proctor et al. 2003) in small RNA fragments. The RNA concentrations were measured by absorption spectroscopy using extinction coefficients supplied by Thermo Scientific.
Thermal denaturation
Thermal unfolding measurements were performed using a Cary-Eclipse Spectrofluorimeter (Varian Inc.) for fluorescence, and a spectropolarimeter (JASCO) for absorbance. Fluorescence was excited at 280 nm and the emission was scanned from 300 to 550 nm. The sample was heated in intervals of 5°C. Data from these measurements are shown in Figure 1A and Supplemental Fig. S1. Absorbance was monitored at 260 nm (Supplemental Fig. S2). A thermoelectric cooler, along with a water bath, was used to heat the sample in steps of 2°C. Integrated fluorescence melts were reproduced with the spectropolarimeter using the same Hoya B-370 optical filter (Hoya) also used in the T-Jump experiments. This was done to check whether different optical filters affect the melt curves significantly. No significant change was observed. The results were reproduced within measurement uncertainty and checked for ≥90% reversibility by scanning the temperature downward.
Temperature jump experiment
Temperature jump relaxation kinetics were measured with a custom-built instrument (Ballew et al. 1996). The RNA sample was held in a 200-μm path length fused silica cuvette. Two counter-propagating, 10-nsec duration, Nd:YAG laser pulses Raman-shifted to a wavelength of 1.9 μm were used to jump the temperature of the sample. The energy of the laser pulse is dissipated as heat into the solution within 10 psec (Wang et al. 2004). The solution remains at the new elevated temperature for >10 msec before diffusional cooling occurs. We used only the first 0.5 msec after the T-jump for our observation.
The relaxation of RNA population toward more unfolded populations was observed by exciting the 2AP chromophore every 14 nsec at 281 ± 2 nm by a mode-locked, frequency-tripled Ti:Sapphire laser beam. The fluorescence is continuously sampled at 0.5-nsec time intervals by a 500-psec resolution oscilloscope (Tektronix). The resulting data contains a fluorescence decay f(Δt,t) every 14 nsec, where Δt runs from 0 to 14 nsec in 0.5-nsec steps, and t runs from 0 to 500 μsec in 14 nsec increments. Within our signal-to-noise ratio, each decay could be fitted to the linear combination f(Δt,t) = χ(t)f1(Δt) + [1 − χ(t)]f2(Δt), where f1 is the decay in a window near t = 0, and f2 is the decay near t = 500 μsec. χ(t) thus reports how the shape of the fluorescence decay varies from the shape at time zero to the shape at 500 μsec, without having to fit each individual decay to a separate multiexponential function (Ballew et al. 1996). The data was downloaded to a computer and analyzed by a program written in LabWindows. (National Instruments). The time t = 0 position was determined from the Raman scattering of the T-Jump pulse. The first five decays after the T-Jump pulse were not considered in the data analysis.
Analysis of the fluorescence decays (Supplemental Fig. S3; Supplemental material) shows that there is a fast (<4 nsec) and slow (4–15 nsec) component in each decay. Only the fast component reports on RNA unfolding kinetics: It decays faster and its overall intensity decreases when base stacking increases. The slow part of the fluorescence decay (>4 nsec) does not report on resolvable kinetics. It instantaneously changes during the temperature jump and does not contribute to the observed relaxation after the T-jump.
The loop mutant fluoresced more strongly (less base stacking) than the stem mutant, so experiments on the former could be performed in a 165-μM solution, while the latter required a 430-μM concentration. Data were obtained for T-jump sizes from 10°C to 19°C and at several more concentrations. No jump-size dependence or concentration dependence could be observed, in agreement with previous findings for other RNA hairpins (Ma et al. 2006; Sarkar et al. 2009). T-Jumps for stem and loop controls were also performed. They resulted in instantaneous responses with no resolvable kinetic phase (Supplemental Fig. S4).
Global data analysis and fitting
The thermal titration signal changes when the RNA is heated to populate different states with different 2AP fluorescence intensities and lifetimes. Likewise, the kinetic data relaxes after the T-jump when the RNA molecules populate different states on their way to a new equilibrium after the temperature jump. We performed a global nonlinear least squares analysis of all thermodynamics and kinetics of both RNA mutants, using a single four-state thermodynamic and kinetic model (Sarkar et al. 2009). The overall scheme is shown in Scheme 1 (not showing the N–S connection).
SCHEME 1.

Sequential (N ⇄ E ⇄ U ⇄ U′) and parallel models were also tested separately by deleting the appropriate rate coefficients. The four states (N, native; E, frayed intermediate; U, unfolded; U′, unstacked) are discussed in detail in the Results section.
In our model, each state j = N, E, U, U′ is assigned a temperature-dependent signal baseline for fluorescence intensity Ij and fluorescence decay parameter χj (see temperature jump experiment Method): 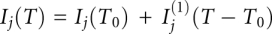 and
and 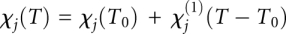 . Each state is also assigned an adjustable reference temperature T0 and a free energy given by
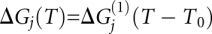 . A linear expansion of the free energy was sufficient. ΔG(1) is the first derivative of ΔG with respect to temperature. The free energy of the unfolded state U is set to zero at its T0, and the other states are measured relative to the unfolded state. Finally, states are connected by free-energy barriers
 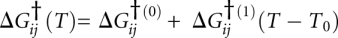 . Populations and kinetics for the model were evaluated from the equilibrium constants Kij = exp[−ΔGij / RT] = exp[−(ΔGi − ΔGj) / RT] and by solving the kinetic master equation for Scheme 1 with rate coefficients
  (Ma et al. 2006; Sarkar et al. 2009).
Molecular dynamics simulation
Molecular dynamics simulations of the stem and loop mutants were carried out using NAMD2 (Laxmikant et al. 1999) with the CHARMM27 force field nucleic acid parameters (Foloppe and MacKerell 2000). Parameters of 2AP were adapted from Sarzynska et al. (2003). The starting structure of the RNA was derived from the PDB structure of 1Z31. Equilibrium simulations were performed with periodic boundary conditions in an NPT ensemble. A pressure of 1 atmosphere was maintained using a Langevin piston. The particle-mesh Ewald method was used for the calculation of electrostatic forces. van der Waals interactions were calculated using a switching distance of 10 Å and a cutoff of 12 Å. Bonded, van der Waals and electrostatic interactions were updated at time steps of 1, 2, and 4 fsec, respectively. A detailed description of the setup of the simulations can be found in Sarkar et al. (2009).
A structure close to the native state was chosen for both the stem and the loop mutant from an equilibration run at 0°C. The temperature was then increased to 32°C and the gradual unfolding of the RNA hairpin monitored. The simulation for both the loop and the stem mutant were run for 50 nsec at 32°C. An additional run up to 35 nsec was also performed. It was previously noted that the CHARMM27 force field has a tendency of unfolding RNA hairpins at a temperature lower than their experimental folding temperature. In total, more than 0.6 μsec of simulations were run to gain insight into the folding landscape of the RNA hairpin.
The MD-simulated RNA structures were monitored for base stacking in the stem and loop and for hydrogen bonding in the stem, following the procedure described in Sarkar et al. (2009). All possible pairwise base-stacking interactions between the four bases in the loop were monitored. For the stem, only the base-stacking interactions present in the native state were monitored.
SUPPLEMENTAL MATERIAL
Supplemental material can be found at http://www.rnajournal.org.
ACKNOWLEDGMENTS
This work was supported by National Science Foundation grant MCB 1019958. Computational work was carried out on a cluster supported by National Science Foundation CRIF grant CHE 0541659. D.A.N. was a visiting undergraduate student from the Hanoi University of Science. K.S. thanks the Center for Physics of Living Cells for funding.
Footnotes
Article published online ahead of print. Article and publication date are at http://www.rnajournal.org/cgi/doi/10.1261/rna.2253310.
REFERENCES
- Ballew RM, Sabelko J, Reiner C, Gruebele M 1996. A single-sweep, nanosecond time resolution laser temperature-jump apparatus. Rev Sci Instrum 67: 3694–3699 [Google Scholar]
- Ballin JD, Bharill S, Fialcowitz-White EJ, Gryczynski I, Gryczynski Z, Wilson GM 2007. Site-specific variations in RNA folding thermodynamics visualized by 2-aminopurine fluorescence. Biochemistry 46: 13948–13960 [DOI] [PMC free article] [PubMed] [Google Scholar]
- Bevilacqua PC, Blose JM 2008. Structures, kinetics, thermodynamics, and biological functions of RNA hairpins. Annu Rev Phys Chem 59: 79–103 [DOI] [PubMed] [Google Scholar]
- Chen SJ, Dill KA 2000. RNA folding energy landscapes. Proc Natl Acad Sci 97: 646–651 [DOI] [PMC free article] [PubMed] [Google Scholar]
- Cho SS, Pincus DL, Thirumalai D 2009. Assembly mechanisms of RNA pseudoknots are determined by the stabilities of constituent secondary structures. Proc Natl Acad Sci 106: 17349–17354 [DOI] [PMC free article] [PubMed] [Google Scholar]
- Dumont C, Matsumura Y, Kim SJ, Li JS, Kondrashkina E, Kihara H, Gruebele M 2006. Solvent-tuning the collapse and helix formation time scales of λ6-85*. Protein Sci 15: 2596–2604 [DOI] [PMC free article] [PubMed] [Google Scholar]
- Foloppe N, MacKerell AD 2000. All-atom empirical force field for nucleic acids: I. Parameter optimization based on small molecule and condensed phase macromolecular target data. J Comput Chem 21: 86–104 [Google Scholar]
- Garcia AE, Paschek D 2008. Simulation of the pressure and temperature folding/unfolding equilibrium of a small RNA hairpin. J Am Chem Soc 130: 815–816 [DOI] [PubMed] [Google Scholar]
- Hardman SJO, Thompson KC 2006. Influence of base stacking and hydrogen bonding on the fluorescence of 2-aminopurine and pyrrolocytosine in nucleic acids. Biochemistry 45: 9145–9155 [DOI] [PubMed] [Google Scholar]
- Hyeon C, Thirumalai D 2008. Multiple probes are required to explore and control the rugged energy landscape of RNA hairpins. J Am Chem Soc 130: 1538–1539 [DOI] [PubMed] [Google Scholar]
- Koplin J, Mu YG, Richter C, Schwalbe H, Stock G 2005. Structure and dynamics of an RNA tetraloop: A joint molecular dynamics and NMR study. Structure 13: 1255–1267 [DOI] [PubMed] [Google Scholar]
- Kuznetsov SV, Ren CC, Woodson SA, Ansari A 2008. Loop dependence of the stability and dynamics of nucleic acid hairpins. Nucleic Acids Res 36: 1098–1112 [DOI] [PMC free article] [PubMed] [Google Scholar]
- Laxmikant K, Skeel R, Bhandarkar M, Brunner R, Gursoy A, Krawetz N, Phillips J, Shinozaki A, Varadarajan K, Schulten K 1999. NAMD2: Greater scalability for parallel molecular dynamics. J Comput Phys 151: 283–312 [Google Scholar]
- Ma HR, Proctor DJ, Kierzek E, Kierzek R, Bevilacqua PC, Gruebele M 2006. Exploring the energy landscape of a small RNA hairpin. J Am Chem Soc 128: 1523–1530 [DOI] [PubMed] [Google Scholar]
- Ma HR, Wan CZ, Wu AG, Zewail AH 2007. DNA folding and melting observed in real time redefine the energy landscape. Proc Natl Acad Sci 104: 712–716 [DOI] [PMC free article] [PubMed] [Google Scholar]
- MacKerell ADJ, Brooks B, Brooks CL III, Nilsson L, Roux B, Won Y, Karplus M 1998. CHARMM: The energy function and its parameterization with an overview of the program. In The encyclopedia of computational chemistry (ed. Schleyer PvR et al. ) pp. 271–277 John Wiley & Sons, New York [Google Scholar]
- Menger M, Eckstein F, Porschke D 2000. Dynamics of the RNA hairpin GNRA tetraloop. Biochemistry 39: 4500–4507 [DOI] [PubMed] [Google Scholar]
- Pan J, Thirumalai D, Woodson SA 1999. Magnesium-dependent folding of self-splicing RNA: Exploring the link between cooperativity, thermodynamics, and kinetics. Proc Natl Acad Sci 96: 6149–6154 [DOI] [PMC free article] [PubMed] [Google Scholar]
- Proctor DJ, Kierzek E, Kierzek R, Bevilacqua PC 2003. Restricting the conformational heterogeneity of RNA by specific incorporation of 8-bromoguanosine. J Am Chem Soc 125: 2390–2391 [DOI] [PubMed] [Google Scholar]
- Sarkar K, Meister K, Sethi A, Gruebele M 2009. Fast folding of an RNA tetraloop on a rugged energy landscape detected by a stacking-sensitive probe. Biophys J 97: 1418–1427 [DOI] [PMC free article] [PubMed] [Google Scholar]
- Sarzynska J, Kulinska K, Kulinski T 2003. Parametrization of 2-aminopurine and purine in CHARMM all-atom empirical force field. Comp Meth Sci Tech 9: 127–135 [Google Scholar]
- Stancik AL, Brauns EB 2008. Rearrangement of partially ordered stacked conformations contributes to the rugged energy landscape of a small RNA hairpin. Biochemistry 47: 10834–10840 [DOI] [PubMed] [Google Scholar]
- Villa A, Widjajakusuma E, Stock G 2008. Molecular dynamics simulation of the structure, dynamics, and thermostability of the RNA hairpins uCACGg and cUUCGg. J Phys Chem B 112: 134–142 [DOI] [PubMed] [Google Scholar]
- Wang ZH, Pang Y, Dlott DD 2004. Vibrational energy dynamics of water studied with ultrafast Stokes and anti-Stokes Raman spectroscopy. Chem Phys Lett 397: 40–45 [Google Scholar]
- Williams AP, Longfellow CE, Freier SM, Kierzek R, Turner DH 1989. Laser temperature-jump, spectroscopic, and thermodynamic study of salt effects on duplex formation by dGCATGC. Biochemistry 28: 4283–4291 [DOI] [PubMed] [Google Scholar]