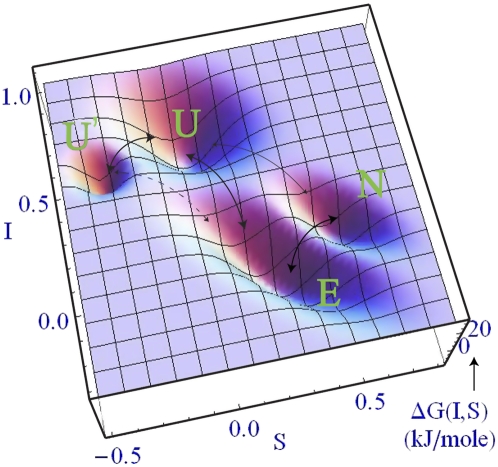
FIGURE 3.
Free energy landscape at 50°C (near Tm) derived from the sequential fit (χ2 = 0.41) in Figure 1. Entropy (S) and intensity (I) have been used as the reaction coordinates. The values for the coordinates and the relative free energies are obtained from the sequential model. Bold arrows indicate the sequential path. A thin arrow between N and U has been used to indicate the only other contribution from the full model that yields a slightly better fit (χ2 = 0.40). The MD simulation in Figure 4 also shows a trajectory converting E to U′ directly, indicated by a dotted arrow.

