

Abstract
Reactive oxygen species are well known for their damaging effects due to oxidation of lipids, proteins and DNA that ultimately result in cell death. Accumulating evidence indicates that reactive oxygen species also have important signaling functions in cell proliferation, differentiation, cell motility and apoptosis. Here, we tested the hypothesis whether reactive oxygen species play a physiological role in regulating F-actin structure and dynamics in neuronal growth cones. Lowering cytoplasmic levels of reactive oxygen species with a free radical scavenger, N-tert-butyl-α-phenylnitrone, or by inhibiting specific sources of reactive oxygen species, such as NADPH oxidases or lipoxygenases, reduced the F-actin content in the peripheral domain of growth cones. Fluorescent speckle microscopy revealed that these treatments caused actin assembly inhibition, reduced retrograde actin flow and increased contractility of actin structures in the transition zone referred to as arcs, possibly by activating the Rho pathway. Reduced levels of reactive oxygen species ultimately resulted in disassembly of the actin cytoskeleton. When neurons were cultured overnight in conditions of reduced free radicals, growth cone formation and neurite outgrowth were severely impaired. Therefore, we conclude that physiological levels of reactive oxygen species are critical for maintaining a dynamic F-actin cytoskeleton and controlling neurite outgrowth.
Keywords: Reactive oxygen species, growth cone, actin dynamics, signaling, Rho, neurite outgrowth
Introduction
Reactive oxygen species (ROS), such as superoxide O2•−, hydrogen peroxide H2O2 and the hydroxyl radical OH•−, are by-products of the electron transport chain in mitochondria but are also specifically produced by a number of membrane-bound and cytosolic oxidases, including NADPH oxidase, lipoxygenase and xanthine oxidase (Thannickal and Fanburg 2000; Bedard and Krause 2007). At very high concentrations ROS can negatively impact cell structure and function by oxidation of lipids, proteins and DNA, which occurs in cancer, atherosclerosis, diabetes and neurodegenerative disorders. In the nervous system, toxic effects of ROS have been reported for spinal cord injury (Luo et al. 2002; Xu et al. 2005), glutamate excitotoxicity (Reynolds and Hastings 1995; Duan et al. 2007), and Alzheimer’s and Parkinson’s disease (Tabner et al. 2001). Since neurons have a very high rate of oxygen consumption and oxidative phosphorylation, they are particularly susceptible to ROS-induced damage. However, the high oxygen consumption could also indicate that neurons use ROS in intracellular signaling during apoptosis, differentiation and cell migration (Maher and Schubert 2000; Thannickal and Fanburg 2000).
Recent studies have shed light on a physiological role of ROS in regulating cell motility and adhesion, particularly of vascular endothelial cells and fibroblasts (Moldovan et al. 2006; Chiarugi and Fiaschi 2007). For example, wound healing assays have shown that motile endothelial cells exhibit higher ROS levels than stationary cells and that actin polymerization and cell migration correlate with ROS production (Moldovan et al. 2000). Furthermore, ROS mediate integrin-dependent cell adhesion, spreading and related actin reorganization in NIH-3T3 fibroblasts (Chiarugi et al. 2003; Fiaschi et al. 2006). However, the detailed mechanisms of how ROS affect structure and dynamics of the actin cytoskeleton in these non-neuronal cells are unknown. The small GTPases of the Rho family (Etienne-Manneville and Hall 2002) are key suspects in mediating ROS-dependent actin reorganization. Rac1 not only regulates actin assembly but also increases intracellular ROS levels by activating either certain NADPH oxidase complexes (Abo et al. 1991) or the cytosolic phospholipase A2/arachidonic acid/lipoxygenase-cascade (Woo et al. 2000). A pathway involving redox-dependent down regulation of Rho activity by Rac involving low-molecular-weight protein tyrosine phosphatases and p190Rho-GAP has been established for integrin-mediated cell spreading of HeLa cells (Nimnual et al. 2003). Additional studies in endothelial cells and fibroblasts implicated Rac1 and RhoA in ROS-mediated actin reorganization (Wojciak-Stothard et al. 2005; Alexandrova et al. 2006).
Rho GTPases also regulate actin structure and dynamics in growth cone motility and guidance (Giniger 2002; Gallo and Letourneau 2004). While Cdc42 and Rac1 mediate filopodial growth and lamellipodial protrusion, respectively, RhoA induces growth cone collapse and axon retraction, for example by regulating actomyosin-contractility of actin arcs in the transition (T) zone (Zhang et al. 2003; Gallo and Letourneau 2004; Gallo 2006). Actin arcs are oriented perpendicular to the filopodial actin bundles and emerge in the T zone from the retrogradely-moving lamellipodial actin networks (Schaefer et al. 2002; Zhang et al. 2003). The possibility that physiological ROS levels are vital for regulating F-actin structure and dynamics in growth cones, potentially via Rho GTPases, and thereby control growth cone motility and neurite outgrowth is a provocative and novel idea. Here, we tested this hypothesis by reducing growth cone ROS levels in two major ways: (1) by generally decreasing free radicals with the scavenger α-N-tert-butyl-phenylnitrone (PBN), and (2) by inhibiting specific cellular sources of free radicals: NADPH oxidases using phenyl arsine oxide (PAO) and apocynin, lipoxygenases by nordihydroguairetic acid (NDGA) treatment, and complex I of the mitochondrial electron transport chain by rotenone. Both general and NADPH oxidase- and lipoxygenase-specific ROS depletions resulted in significantly reduced F-actin content in Aplysia growth cones. Using fluorescent speckle microscopy (FSM) of F-actin dynamics, we observed reduced actin assembly and retrograde flow as well as increased arc contractility and disassembly of the F-actin cytoskeleton in the peripheral (P) domain. ROS depletion resulted in Rho activation, reduced growth cone formation and neurite outgrowth. Therefore, ROS may have a two-faced role in the nervous system: while at high concentrations ROS are harmful to neurons, at physiological levels they are critical for normal F-actin dynamics and neurite outgrowth.
Materials and Methods
ROS Reagents
Apocynin (4’-hydroxy-3’-methoxyacetophenone), 2’,7’-dichlorofluorescin diacetate (DCFH-DA), lysophosphatidic acid (LPA) sodium salt, NDGA, N-tert-butyl hydroxylamine acetate (NtBHA), PAO, PBN, tert-butyl hydrogen peroxide (tBHP) and rotenone were purchased from Sigma-Aldrich (St. Louis, MO). Mn (III) tetrakis (4-benzoic acid) porphyrin chloride (MnTBAP) was from Alexis Biochemicals (San Diego, CA). DCFH-DA was prepared as 15.5 mM stock in DMSO. PAO (20 mM), apocynin (2 M), and NDGA (0.5 M) were prepared as stocks in DMSO, and appropriate controls were included in all experiments (e.g., 0.005% DMSO for 1 μM PAO). PBN and tBHP solutions were prepared in artificial seawater (ASW: 400 mM NaCl, 10 mM KCl, 10 mM CaCl2, and 55 mM MgCl2, 15 mM HEPES at pH 7.8) or L15-ASW, while LPA (20 mM) and MnTBAP (0.1M) were dissolved as stocks in H2O. Rotenone was prepared as 8 M stock in EtOH. For live-cell imaging, ROS reagents were applied in ASW, unless otherwise noted.
Aplysia Bag Cell Neuronal Culture
Aplysia bag cell neurons were plated on coverslips coated with 20 μg/ml poly-L-lysine (70–150 kD) as previously described (Suter et al. 1998; Lee et al. 2008). Cells were kept in L15 medium (Invitrogen, Carlsbad, CA) supplemented with ASW (L15-ASW: L15 plus 400 mM NaCl, 10 mM CaCl2, 27 mM MgSO4, 28 mM MgCl2, 4 mM L-glutamine, 50 μg/ml gentamicin, 5 mM HEPES, pH 7.9) overnight in a 14°C incubator. All procedures were performed in accordance with institutional guidelines. Neurons were typically used for experiments 24 hours after plating.
DIC and Immunofluorescence Microscopy
Differential interference contrast (DIC) imaging was performed with a 60x 1.4 NA oil objective (plus 1.5x magnification) on an Eclipse TE2000 microscope (Nikon, Melville, NY), using either a Cascade II or a CoolSNAP HQ CCD camera (Photometrics, Tucson, AZ) controlled by MetaMorph 7 software (Molecular Devices, Downingtown, PA). DIC images were acquired with 25–100 msec exposure times at 10 sec intervals through an OG 590 long-pass red filter (Chroma, Rockingham, VT). Growth cones were imaged under control condition in ASW for 10 min, then in the presence of ROS reagents for 10–20 min. F-actin and microtubule labeling was carried out as described (Suter et al. 2004). Alexa 488-phalloidin (Invitrogen) was used at 1:100 for F-actin. Mouse anti-α-tubulin (Sigma) was incubated at 0.7μg/ml in 5% BSA/PBS/0.1% Triton X-100 for 1 h at RT, followed by 4 μg/ml Alexa 568-goat-anti-mouse secondary antibody (Invitrogen) in the same blocking solution for 30 min at RT. Phosphotyrosine (PY) staining was performed with the monoclonal antibody 4G10 (Millipore, Billerica, MA) at 2 μg/ml in the blocking solution above for 1 h at RT, followed by the same secondary antibody as for the tubulin staining. Images were acquired in 20 mM n-propyl-gallate in PBS/80% glycerol pH 8.5 on a Nikon TE2000 Eclipse microscope equipped with a 60X 1.4 NA oil and 100X 1.49 NA oil objectives, an X-cite 120 metal halide lamp (EXFO, Mississauga, Ontario, Canada), appropriate fluorescence filter sets (Chroma), Cascade II cooled CCD camera (200–500 msec exposure times) and MetaMorph 7 software.
ROS Imaging
Neurons were incubated with 5 μM DCFH-DA in ASW with or without drug for 15 min at RT and then washed with ASW. DCF-images were acquired through a FITC filter set using the Cascade II camera (500 msec exposure time). For ratiometric ROS imaging, the volume indicator Texas Red-dextran (3 kDa, Invitrogen) was microinjected into cell bodies at a concentration of 2 mg/ml in RNAse-free water. Dextran images were taken with a TexasRed filter set. DCF intensity values in the P domains of the growth cones were background subtracted and normalized against dextran signals. Data were collected from 9 to 16 growth cones.
Quantitative Actin Fluorescent Speckle Microscopy
For quantitative FSM of actin dynamics, neuronal cell bodies were microinjected with 20μM Alexa 568 (Invitrogen), in injection buffer (100 mM PIPES pH 7.0, 1 mM MgCl2, 1 mM EGTA) as recently described (Schaefer et al. 2002). In some experiments, we used Alexa 568-labeled G-actin (Invitrogen) to monitor actin dynamics. While actin arcs and bundles are more easily discerned with phalloidin, we did not measure any differences in the dynamic properties of the actin cytoskeleton between the two probes. Reagents were injected, using an NP-2 micromanipulator and Femtojet microinjection system (Eppendorf, New York, NY). After injection, cells were allowed to recover for 1 hr before time-lapse imaging in ASW (500 msec exposure times at 10 sec intervals using the Cascade II). For LPA treatment, 20 μM LPA was dissolved in a low-ionic strength ASW solution (LIS-ASW; 15 mM HEPES, pH 7.9, 60 g/L glycine, 100 mM NaCl, 10 mM KCl, 5 mM MgCl2, 5 mM EGTA).
Image Processing and Analysis
MetaMorph 7.0 was used for image processing, quantitative analysis of actin dynamics and making of movies and montages. To enhance actin speckles, images were processed with an unsharp mask, then with a low-pass filter. The MetaMorph kymograph function was used to measure retrograde actin flow rates along 5–10 F-actin bundles to determine the average flow rate per growth cone (Fig. 4). To measure actin arc movements in the T zone, 4–7 actin speckles per growth cone were tracked at 10 sec intervals (Fig. 5E and F). The average angle between the direction of arc movements and the axis of growth was determined for each growth cone and treatment. In order to measure arc density in the T zone, lines scans were drawn across arcs on the sides of the growth cone, and profiles were compared between control and PBN conditions (Fig. 5I). For statistical analysis of arc density (Fig. 5J), 2–3 line scan measurements were made per growth cone, and integrated fluorescence intensity values per μm in drug condition were normalized against integrated values in control condition and averaged. One-tailed paired t-tests were performed to identify significant differences. Photoshop CS3 extended (Adobe, San Jose, CA) was used for additional image processing and making of supplemental videos, and Canvas 8 (ACD Systems of America, Inc, Miami, FL) for final figure assembly.
Figure 4. ROS depletion affects F-actin dynamics.

(A) F-actin dynamics of control growth cone. Neurons were injected with 20 μM Alexa 568-phalloidin, and time lapse movies were acquired using FSM (Video 7). White line demarks lamellipodia region used for kymographs shown in (C). (B) Same growth cone after 20 min in 25 mM PBN. Note the progressive decrease in F-actin content in the P domain (Video 7). Arrowhead indicates forward movement of actin recycling zone. (C) Kymographs of actin speckles taken in the P domain as indicated with white lines in (A) and (B) reveal leading edge protrusion in control and progressive decrease in F-actin flow from initial control rate of 3.6 μm/min to 2.1 μm/min after PBN treatment (white lines in kymograph). (D) Actin FSM image of another control growth cone. (E) Same growth cone after treatment with 1 μM PAO for 30 min, which causes disassembly of the actin cytoskeleton and forward shift of the recycling zone (Video 8; image is shown after 25 min). A temporary lengthening of filopodial bundles occurred simultaneously with flow reduction. (F) Kymographs of actin speckles taken in P domain as indicated with white lines in (D) and (E) show a decrease in flow rates from 4.0 μm/min in control to 1.5 μm/min after PAO treatment. (G) 4 mM apocynin treatment caused a decrease in actin flow rates, filopodial lengthening and finally F-actin disassembly (Video 9). (H) 50 μM NDGA resulted in an aggregation of actin arcs (arrowhead) (Video 10). (I) Quantification of actin retrograde flow rates. T-test: *p<0.005; n= number of growth cones. (J) 75 mM PBN resulted in an aggregation of actin arcs and contractile effects, similar to NDGA treatment (arrowhead) (Video 11). (K) Treatment with 0.2 mM MnTBAP resulted in temporary filopodia lengthening, arc aggregation (arrowhead) and overall network disassembly. Scale bars: 10 μm.
Figure 5. ROS depletion affects actin arc movement and aggregation.

(A) Actin FSM image of control growth cone. Filopodial actin bundles in P domain and actin arcs in T zone (marked with white box) undergo retrograde flow (Video 11). (B) Inset shows actin arcs marked in (A). In control conditions, arcs move retrogradely with respect to the axis of growth (Video 12). (C) The same growth cone treated for 3 min with 75 mM PBN (Video 11). We observed inhibition of F-actin assembly at the leading edge and retraction of the F-actin network towards the C domain. (D) Inset shows arc aggregation in 75 mM PBN. A brief tugging of actin arcs towards the axis of growth occurred before retraction of the F-actin network (Video 12). (E) Four speckles on actin arcs were tracked over 10 second intervals in control (open triangles) and 75 mM PBN (closed diamonds) conditions, respectively. (F) Angle plots of arc movements with respect to axis of growth from 7 growth cones (dashed arrows represent average angle per growth cone. Treatment with 75 mM PBN resulted in tugging of arcs towards the direction of growth less than 90o. Angles in control were always greater than 90o. Thin solid lines represent example shown in (A) and (C). (G) Actin FSM image of control growth cone. (H) 20 μM LPA treatment for 15 min resulted in increased arc aggregation. (I) Line scans across arcs marked by short white lines in (A), (C), (G), and (H) show arc aggregation by increased normalized relative fluorescence intensities after PBN and LPA treatment, respectively, relative to controls. Schematic on the right shows orientation of line scans. (J) Integrated fluorescence intensities along the line scan per μm were normalized against control conditions. (n = number of growth cones). T-test: *p<0.01. Scale bars: 10 μm (in A, C, G, H); 5 μm (in B, D).
Quantification of Growth Cone Formation and Neurite Outgrowth
Aplysia bag cell neurons were plated in L15-ASW medium on day 0. After 2–3 hours of incubation at RT, the medium was replaced with L15-ASW with or without ROS reagents. On day 1, 10x phase images were taken of each cell, followed by a thorough washout with L15-ASW. On day 2, 10x phase images were taken of each cell again after drug was washed out 1 day before. To assess growth cone formation, the percentage of cells containing growth cones was determined for each condition on day 1 and day 2 in two independent experiments (100–200 cells per condition). In the neurite outgrowth assay, total neurite length was determined on day 1 and day 2. A population distribution of the percentage of neurons with a total neurite length greater than a specific length was plotted against total neurite length (Chang et al. 1987).
Rho Activity Assay
To assess Rho activity in Aplysia CNS tissue, we adapted the protocol, previously described (Zhang et al. 2003). Rho activity assay kit was purchased from Cytoskeleton, Inc. (Denver, CO). In brief, Aplysia CNS tissue was incubated for 6 hrs with 6 mg/ml dispase II (Roche, Indianapolis, IN) in L15-ASW to assist penetration of drug. CNS tissue was washed 3 times with ice-cold ASW and then incubated with LIS-ASW with 20 μM LPA, 75 mM PBN or without drug for 1 hour at RT. Each tissue sample was lysed for 10 min on ice, using the lysis buffer supplied by the kit. After homogenization with a handheld homogenizer (Omni International), lysates were cleared by centrifugation at 12,000xg for 5 min at 4° C. Extracts were incubated with agarose beads coupled with GST-tagged Rho binding domain of rhotekin for 1 hour at 4° C. Beads were washed with the provided wash buffer, boiled in sample buffer for 5 min at 95° C and analyzed on a 15% SDS-PAGE gel. The amounts of total Rho and active Rho were quantified by Western blotting with the mouse monoclonal antibody p1D9 (1:10 dilution of supernatant; Developmental Studies Hybridoma Bank). We used the secondary antibody Alexa 680-goat-anti-mouse (Invitrogen) at 0.4 μg/ml, followed by detection with the Odyssey system (LI-COR Biosciences, Lincoln, NE). Band intensities were quantified with the Odyssey software.
Results
ROS Levels in Neuronal Growth Cones
To investigate whether physiological ROS levels regulate F-actin structure and dynamics in neuronal growth cones, we selected two different approaches to decrease intracellular ROS. (1) We treated cultured Aplysia bag cell neurons with the spin-trapping reagent PBN, a general free radical scavenger that has been used to detect ROS in the brain as well as to reduce radical-mediated neuronal damage (Zini et al. 1992; Thomas et al. 1997). (2) We also inhibited specific intracellular ROS sources, such as NADPH oxidases with PAO (Le Cabec and Maridonneau-Parini 1995) and apocynin (Stolk et al. 1994), lipoxygenases with NDGA (Salari et al. 1984), and the mitochondrial electron transport chain complex I by rotenone (Barrientos and Moraes 1999). In order to verify that our experimental treatments indeed decreased ROS, we measured the relative cytoplasmic ROS levels in growth cones with DCFH-DA (Fig. 1).
Figure 1. ROS imaging in Aplysia bag cell growth cones.

(A) DIC image of a control (CTL) growth cone. P and C domain plus T zone are indicated. (B) DCF image of growth cone in (A) shows ROS levels in the cytoplasm as well as intracellular compartments, such as potential mitochondria (arrow). (C) Corresponding dextran fluorescence image reveals highest volume in the C domain. (D–I) DCF fluorescence images of growth cones treated for 15 min with 50 mM PBN (D), 1 μM PAO (E), 4 mM apocynin (apo) (F), 50 μM NDGA (G), 20 μM rotenone (rot) (H), or 5 mM tBHP (I), respectively. Leading edges of growth cones shown in (D–G) are marked with dashed line. (J) Quantification of volume-corrected ROS levels in the growth cone P domain. T-test: *p<0.05 (n = growth cones). Scale bars: 10 μm.
Fig. 1A shows a DIC image of a control growth cone, revealing the three major growth cone regions: central (C) domain, transition (T) zone and peripheral (P) domain. DCF imaging showed that ROS are present in all three domains in a volume-dependent manner when comparing the DCF signal to the distribution of Texas Red dextran serving as a volume control (Fig. 1B and C). ROS levels are the highest in the C domain, particularly in punctate and elongated structures likely to be mitochondria (arrows in Fig. 1B and D). Weaker signals were observed in network-like structures in the C domain and T zone, which are most likely endoplasmic reticulum (Fig. 1B). The lowest ROS levels were detected in the P domain (Fig. 1B). Incubation of Aplysia bag cell neurons with 500 nM DCFH-DA for as short as 5 min resulted in measurable signals, suggesting that they are highly oxidative cells. Treatment of growth cones with 50 mM PBN, 1 μM PAO, 4 mM apocynin or 50 μM NDGA for 15 min significantly reduced cytoplasmic ROS levels in the P domain (Fig. 1D–G), while 20 μM rotenone had no effects on cytoplasmic DCF signals (Fig. 1H).
We quantified ROS levels in the relatively thin P domain (Grzywa et al. 2006) by normalizing DCF intensity values to Texas Red dextran signals to correct for potential volume changes induced by the drugs (Fig. 1J). PBN, PAO, apocynin, and NDGA treatment significantly reduced cytoplasmic ROS levels in the P domain when compared to control treatments: 67% by 50 mM PBN, 74% by 1 μM PAO, 54% by 4 mM apocynin, and 50% by 50 μM NDGA. Growth cones treated with 20 μM rotenone had a small and insignificant increase of cytoplasmic DCF signals of 13%, while mitochondrial DCF levels in the P domain were clearly reduced by 63% when compared to controls (data not shown). In addition, we observed a dose-dependent reduction of cytoplasmic ROS levels when treating the cells with 25, 50 and 75 mM PBN. Previous studies reported non-toxic, radical-scavenging effects of 10 mM PBN in cultured macrophages, lymphoma cells and neurons, respectively (Kotake et al. 1998; Sturgess et al. 2000; Cui et al. 2006). The higher concentrations of PBN needed to reduce ROS levels in Aplysia neurons compared to vertebrate cells are consistent with our experience using other pharmacological reagents in this system. As a positive control, we treated the neurons with 5 mM tert-butyl hydrogen peroxide (tBHP), a membrane permeable H2O2 variant, and we found significantly increased DCF signals in all growth cone domains (Fig. 1I and 1J; 3.7- fold increase in the P domain when compared with control). In summary, DCF imaging revealed that both NADPH oxidases and lipoxygenases, but not mitochondria, are major sources of ROS in the P domain of the growth cone.
ROS Depletion Reduces F-actin Content in Neuronal Growth Cones
We next studied the effects of ROS depletion on growth cone morphology and the distribution of F-actin and microtubule cytoskeleton (Figs. 2 and 3). In the P domain, F-actin is present in filopodial bundles (arrow in Fig. 2A”; schematic in upper left) as well as in a lamellipodial network between the filopodia (Forscher and Smith 1988; Lewis and Bridgman 1992). The T zone contains dynamic ruffling structures called “intrapodia” (Rochlin et al. 1999) (asterisk in Fig. 2A”), as well as transverse actin arcs surrounding the C domain (arrow in Fig. 2B”) that derive from the peripheral actin network and undergo Rho-dependent actomyosin contractility (Schaefer et al. 2002; Zhang et al. 2003). The majority of the microtubules are present in the C domain, while highly dynamic microtubules explore the P domain by using actin bundles as polymerization guides (Fig. 2A”) (Schaefer et al. 2002).
Figure 2. ROS depletion decreases F-actin content in growth cones.

Upper left inset shows schematic of cytoplasmic domains, microtubules (green) and F-actin (red) subpopulations in the growth cone. (A) DIC image of a live control growth cone under control condition in ASW. (A”) Overlay image of F-actin (red) and microtubule (green) double labeling after fixation of growth cone in (A) shows filopodial F-actin bundles (white arrow) and an F-actin meshwork between filopodia in the P domain. Intrapodia in the T zone is marked with an asterisk. The C domain is rich in organelles and microtubules. (B-B”) 25 mM PBN treatment (20 min) decreased membrane ruffling and caused initial filopodial lengthening and extension of the C domain boundary (dashed line in B’; Video 1). The F-actin content was strongly reduced while microtubule extended into the P domain (B”). Arrow points towards actin arc. (C-C”) 75 mM PBN treatment (5 min) also reduced ruffling (C’; Video 2) and strongly depleted F-actin structures (C”, leading edge marked with solid line). Scale bars: 10 μm.
Figure 3. Inhibition of NADPH oxidases and lipoxygenases decreases F-actin content.
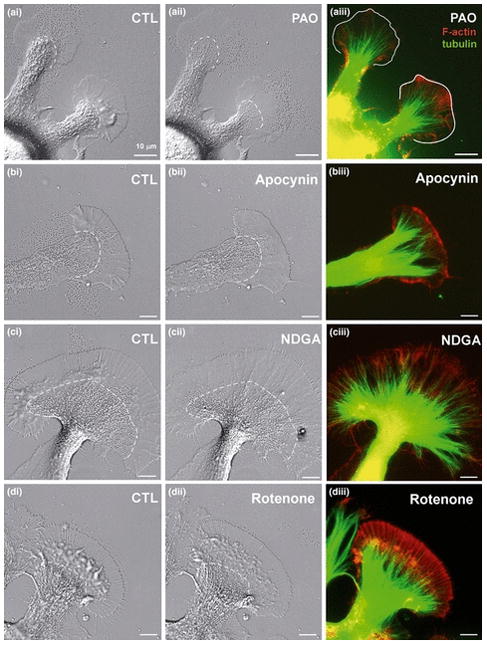
(A-A”) NADPH oxidase inhibition by 1 μM PAO (10 min) caused flattening of the P domain and T zone and a slight C domain retraction (A’). Growth cone dynamics including actin retrograde flow was strongly reduced (Video 3). (A”) F-actin bundles and meshwork in the periphery were reduced and microtubules extended more towards the leading edge (marked with solid line). (B-B”) 4 mM apocynin treatment (10 min) resulted in flattening of P domain and the T zone as well as extension of the C domain (B’; Video 4). (B”) The actin bundles and meshwork in the P domain were decreased and microtubules extended into the actin-free periphery. (C-C”) 50 μM NDGA treatment (10 min) had similar effects on growth cones. The extension of the C domain was modest. There was significant filopodia elongation (C’, Video 5). (C”) NDGA treatment decreased F-actin content in the P domain, but elongated filopodia containing F-actin. (D-D”) 20 μM Rotenone treatment (10 min) did not result in significant changes in growth cone morphology, F-actin and microtubule cytoskeleton structure and content (Video 6). Scale bars: 10 μm.
When growth cones were treated with 25 mM PBN for 20 min, we observed an initial burst of filopodial growth, flattening of the P domain, loss of membrane ruffling in the T zone, and forward movement of the C domain boundary towards the leading edge (Fig. 2B’; Video 1). All these effects were completely reversible following PBN washout (data not shown). Phalloidin-labeling following fixation revealed that the F-actin cytoskeleton was strongly affected by PBN treatment: we observed fewer filopodial bundles and intrapodia as well as less actin meshwork when compared to control conditions (Fig. 2B”). Microtubules, on the other hand, extended into the P domain with reduced F-actin content, similarly to growth cones treated with the actin depolymerizing drug cytochalasin B (Forscher and Smith 1988).
There is recent evidence for ROS-mediated down-regulation of Rho activity in HeLa cells (Nimnual et al. 2003). If a similar signal transduction pathway would occur in growth cones, we would expect an increase in arc contractility in the T zone upon lowering ROS levels. Although arcs were clearly visible after treatment with 25 mM PBN (arrow in Fig. 2B”), extension of the C domain did not suggest a strong contractile effect at these ROS levels. Thus, Rho-activation might need a more significant reduction of ROS levels. When growth cones were incubated with 75 mM PBN for 5 min, we also noticed reduced T zone ruffling; however, no initial filopodial extension occurred, and the C domain boundary did not extend and sometimes retracted (Fig. 2C’; Video 2). Overall, growth cone and organelle dynamics was severely affected in 75 mM PBN. F-actin content was strongly reduced in the P domain, which was invaded by microtubules as observed with 25 mM PBN (Fig. 2C”). Similar effects on growth cone morphology and F-actin structures were observed with other ROS scavengers such as 30 mM N-tert butyl hydroxylamine acetate (NtBHA) and 0.2 mM Mn(III) tetrakis(4-benzoic acid)porphyrin chloride (MnTBAP; data not shown), a superoxide dismutase mimetic (Patel 1998).
Since membrane-actin interactions are important for growth cone motility, we suspected that plasma membrane-bound NADPH oxidase (Bedard and Krause 2007; Lambeth 2007) could be an important ROS source for actin regulation in growth cones. Treatments with two different NADPH oxidase inhibitors, 1 μM PAO and 4 mM apocynin, for 10 min or longer resulted in flattening of the P domain and decreased membrane ruffling (Fig. 3A-A’ and 3B-B’; Videos 3 and 4). Treatments with 25 mM PBN, 1 μM PAO and 4 mM apocynin had overall similar effects, although we did not observe an initial burst of filopodial growth with PAO. Furthermore, the C domain boundary rather retracted with PAO treatment. F-actin bundles and meshwork in the P domain were significantly reduced by both PAO and apocynin, while microtubules remained intact and invaded the P domain (Fig. 3A” and 3B”). We also inhibited ROS production by cytosolic lipoxygenases with 50 μM NDGA. Consistent with PBN, PAO and apocynin treatments, NDGA also caused flattening of the P domain and T zone, accompanied by a loss of F-actin bundles in the P domain (Fig. 3C-C”; Video 5). We also noticed a significant elongation of F-actin-containing filopodia in the presence of NDGA (Fig. 3C’ and 3C”; Video 5). In contrast, when complex I of the mitochondrial electron transport chain was inhibited with 20 μM rotenone, the only morphological change observed was a slight splaying of the C domain (Fig. 3D’; Video 6), while both F-actin and microtubule cytoskeleton remained unaffected (Fig. 3D”). In summary, our results suggest that physiological levels of ROS that are largely derived from NADPH oxidases and lipoxygenases, are crucial for maintaining an intact F-actin cytoskeleton in the P domain of neuronal growth cones.
ROS Depletion Affects F-actin Dynamics and Contractility
In order to assess which specific aspects of F-actin dynamics are affected by ROS depletion, we used actin fluorescent speckle microscopy (FSM) (Figs. 4 and 5; Videos 7–12) (Waterman-Storer et al. 1998; Schaefer et al. 2002). In control conditions, filopodial actin bundles and intervening lamellipodial networks are constantly turning over by coordinated assembly at filopodia tips and the leading edge, retrograde flow at the rate of 4.6±0.4 μm/min (n = 11 growth cones) and recycling in the T zone (Fig. 4A; Video 7). When growth cones were treated with 25 mM PBN, we observed an initial burst of filopodial growth, a progressive disassembly of actin filaments in bundles and networks, as well as the forward movement of the actin recycling zone that resulted in a narrower P domain (arrowhead in Fig. 4B; Video 7). Kymograph analysis revealed a retraction of the leading edge and a 52% decrease in retrograde actin flow after 20 min treatment with 25 mM PBN compared to controls (Fig. 4B, C and I). These results suggest an inhibition of actin assembly at the leading edge when lowering ROS levels. Ultimately, all F-actin structures including arcs progressively disappeared in 25 mM PBN (Video 7). Thus, the C domain extension induced by 25 mM PBN could be due to fewer actin arcs in the T zone that keep the C domain boundary compact under control condition.
Upon treatment with 75 mM PBN, strong actin assembly inhibition and increased contractility were observed before significant flow reduction and network disassembly occurred (Fig. 4J; Video 11). Such treatment resulted in a fast retraction of the peripheral F-actin cytoskeleton into the C domain at a rate of 5.4 μm/min, which is comparable to control actin flow rates. The clearance of P domain F-actin with 75 mM PBN is reminiscent of the effect of the actin depolymerizing drug cytochalasin B on Aplysia growth cones (Forscher and Smith 1988). Such strong reduction of ROS levels also resulted in pulling apart of actin networks (Video 11) and in aggregation of actin arcs, both of which are signs of increased contractility (Fig. 4J). Arc aggregation was also observed upon treatment with 0.2 mM MnTBAP (Fig. 4K).
When NADPH oxidases were inhibited with either 1 μM PAO or 4 mM apocynin, actin dynamics was affected similarly as with 25 mM PBN. After about 15 min of treatment, PAO and apocynin decreased actin flow rates by 73% and 65%, respectively, and this was accompanied by a brief period of leading edge protrusion and lengthening of filopodial actin bundles (Fig. 4E–G, and 4I; Videos 8 and 9). Ultimately, filopodial actin assembly was also inhibited, the actin recycling zone moved forward, and the highly structured filopodia and lamellipodia were replaced with a disorganized meshwork (Videos 8 and 9). NDGA treatment reduced actin flow rates by 33% when compared to controls (Fig. 4I); however, filopodia elongated and persisted in length in NDGA (Fig. 3C” and 4H; Video 10). Furthermore, NDGA caused aggregation and increased contractility of actin arcs, similar to 75 mM PBN treatment (Fig. 4H and J, Videos 10 and 11). In summary, all treatments that reduced ROS levels resulted in decreased actin flow, inhibition of actin assembly along the leading edge, and progressive disassembly of the actin meshwork in the P domain. In addition, lipoxygenase-inhibition increased actomyosin-based contractility.
ROS Depletion Affects Actin Arc Movement and Aggregation
The increased actomyosin contractility induced by either 75 mM PBN or 50 μM NDGA was indicated by C domain contraction, pulling apart of actin networks and increased arc density (Fig. 4H and J; Videos 10 and 11). We quantified these changes in arc dynamics and structure in more detail (Figure 5). In control conditions, arcs moved towards the C domain retrogradely relative to the direction of growth (Fig. 5A and B; Videos 11 and 12). New arcs are constantly formed from actin networks in the P domain, as previously reported (Schaefer et al. 2002; Zhang et al. 2003). Immediately after PBN addition, arcs started to aggregate and were tugged towards the direction of growth (Fig. 5C and D; Videos 11 and 12). By tracking actin speckles on arcs, we found that in control condition arcs were always moving retrogradely at angles greater than 90o with respect to the axis of growth (average angle 140o±9; n = 6), while after PBN treatment angles were below 90o (average angle 46o±8; n = 7; Fig. 5E and F).
Rho activation by lysophosphatidic acid (LPA) increases arc contractility and density in Aplysia growth cones (Zhang et al. 2003). ROS depletion by PBN and NDGA resulted in arc aggregation similarly to growth cones treated with 20 μM LPA for 15 min (Fig. 4H and J; Fig. 5A–D, G, H; Videos 10 and 11). In contrast to PBN and NDGA, LPA did not cause a retraction of the P domain F-actin structures into the C domain nor a network disruption by disorganized force application or F-actin disassembly. We quantified arc aggregation induced by PBN, LPA and NDGA treatment by intensity line-scan analysis across actin arcs on the side of growth cones (Fig. 5I and J). In all three conditions, we found significant increases in F-actin signals when compared to the control condition before drug application. While LPA increased actin arc density by 65%, ROS depletion by PBN and NDGA raised actin arc signals by 115% and 96%, respectively (Fig. 5J). Thus, our results suggest that strong ROS depletion in growth cones results in increased actomyosin contractility similarly to LPA, presumably through Rho-activation.
ROS Depletion Increases Rho Activity and Decreases PY Levels
Since ROS depletion had similar effects on F-actin dynamics in growth cones as Rho activation, we next tested whether ROS depletion increases Rho activity. Therefore, we performed a biochemical active Rho pull-down assay from Aplysia CNS tissue (Fig. 6). Total Aplysia CNS tissue was incubated in the presence or absence of 75 mM PBN, using 20 μM LPA known to activate Rho as a positive control (Jalink et al. 1994). Both LPA and PBN increased Rho activity in CNS tissue when compared to untreated control tissue (Fig. 6A). Quantification of three independent experiments revealed that ROS depletion by PBN caused 1.7-fold increase in Rho activity compared to controls (t-test, p=0.07; Fig. 6B), while LPA activated Rho by 2.7-fold (p<0.05).
Figure 6. PBN treatment increases Rho activity in Aplysia CNS tissue.

(A) Western blot analysis of total and active Rho, as assessed by rhotekin-pull down assay. Total Aplysia CNS tissue was incubated in LIS-ASW only, with 20 μM LPA or 75 mM PBN for 1 hr. (B) Densitometric quantification of Rho activity (active/total Rho) in three independent experiments. Both LPA treatment and PBN increased Rho activity relative to control.
Since ROS are known to inhibit protein tyrosine phosphatases and activate protein tyrosine kinases (Meng et al. 2002; Chiarugi 2005), we tested whether the treatments with the ROS reagents affect the total phosphotyrosine (PY) levels in bag cell growth cones (Fig. 7). Under control conditions, PY immunolabeling was punctate in all growth cone regions with increased signals in filopodia tips and along the leading edge (Fig. 7A), which is in agreement with our previous report (Suter and Forscher 2001). Treatment with 50 mM PBN, 1 μM PAO, 4 mM apocynin, and 50 μM NDGA abolished the PY enrichment at the leading edge and decreased total PY levels in the P domain by 52–62% when compared to controls, while rotenone treatment had no effect (Fig. 7B–G). Although NDGA treatment abolished the PY enrichment at the leading edge, it did not affect the PY signals at filopodial tips. Thus, we observed a direct correlation between ROS and global PY levels in Aplysia growth cones, suggesting a potential involvement of protein tyrosine phosphatases and/or kinases in the ROS-controlled cytoskeletal dynamics.
Figure 7. Phosphotyrosine levels are decreased after ROS depletion.

(A) Control growth cone labeled for total phosphotyrosine (PY) with monoclonal antibody 4G10. PY signals are increased at filopodia tips, leading edge and T zone ruffles (asterisk). 50 mM PBN (B), 1 μM PAO (C), 4 mM apocynin (D), and 50 μM NDGA (E) decreased PY signals in general and particularly along the leading edge. Note: NDGA treatment did not decrease PY levels in filopodia tips. (F) 20 μM rotenone did not affect PY signals in P domain, leading edge or filopodia tips. (G) Quantification of PY levels in the P domain of growth cones reveals that 50 mM PBN, 1 μM PAO, 4 mM apocynin, and 50 μM NDGA decreased ROS levels by 52%, 58%, 62%, and 60%, respectively. Data are from three independent experiments. T-test: *p<0.05 (n = number of growth cones). Scale bars: 10 μm.
ROS Depletion Reduces Growth Cone Formation and Neurite Outgrowth
In order to assess whether the changes in actin structure and dynamics induced by ROS depletion play a physiological role in growth cone formation and neurite outgrowth, we cultured bag cell neurons overnight in the presence and absence of various ROS reagents (Fig. 8). While 78±6% of the control neurons displayed healthy growth cones after one day in culture (Fig. 8A and C), only 20±5% of the cells cultured in 20 mM PBN had growth cones, which were smaller and flatter than in controls (Fig. 8B and C). After two days in culture, control neurons had more and longer neurites than on day one, and the percentage of growth cone-bearing cells increased to 91±3% (Fig. 8A’ and C). To assess whether growth inhibition by ROS depletion is reversible, we washed neurons grown in 20 mM PBN after one day with control medium. After PBN washout, 66±8% of all cells exhibited growth cones on day two, which is not significantly different from control cells after one day in culture (t-test: P>0.05). Similarly, ROS depletion by overnight treatment of bag cell neurons with 500 nM PAO, 2 mM apocynin and 25 μM NDGA reduced the percentage of neurons elaborating growth cones on day 1 after cell plating (Fig. 8C). While washout of apocynin resulted in a similar recovery as PBN washout (69±11%), growth inhibition by overnight treatment with PAO and NDGA was not reversible.
Figure 8. ROS depletion reduces growth cone formation and neurite outgrowth.

(A) Low magnification phase contrast image of a bag cell neuron with growth cones after one day in L15-ASW control condition. (A’) The same neuron imaged two days after plating had more, larger growth cones and longer neurites. (B) Neurons cultured for one day in 20 mM PBN had fewer, smaller and flatter growth cones at the ends of shorter neurites compared to controls. (B’) One day after PBN washout, the same cells have more, robust growth cones and longer neurites. The two cell bodies shown in (B) moved together between day one and two. (C) Quantification of percentage of cells that develop growth cones after one day in control medium, 20 mM PBN, 500 nM PAO, 2 mM apocynin and 25 μM NDGA (white bars) and on day two after washout of drugs between day one and two (gray bars). Between 43 and 255 cells were analyzed per condition in four independent experiments. T-test: *p<0.05. (D–E) Lowering ROS levels decreases neurite outgrowth. Population distribution of total neurite length per cell in control, 20 mM PBN (D), 500 nM PAO (E), 2 mM apocynin (E) and 25 μM NDGA (E) conditions on day one and on day two after washout. There was a significant decrease in total neurite length in neurons cultured in the presence of ROS drugs (open squares) when compared to L15-ASW control (open triangles) on day one. PBN and apocynin effects were partially reversible, while PAO and NDGA effects were not. Quantifications in (C), (D) and (E) were carried out with the same cells (n= number of cells). Most neurons have preexisting processes at the time of plating, explaining the differences in percentages of cells with growth cones and short neurites in some of the drug conditions. Scale bars: 200 μm.
We then assessed total neurite outgrowth under the same conditions (Fig. 8D and E). Only 30% of cells cultured overnight in 20 mM PBN had neurites of at least 50 μm in total length, in contrast to 61% of control neurons. PBN washout after one day resulted in 77% of all cells bearing neurites on day two, while 90% of control neurons have neurites on day two (Fig. 8D). As with growth cone formation, apocynin treatment reduced neurite outgrowth in a reversible manner, while neurite outgrowth inhibition by PAO and NDGA was irreversible (Fig. 8E). In summary, these findings suggest that ROS have an important physiological role in neurite outgrowth and regeneration and that NADPH oxidases and lipoxygenases are two important sources for ROS mediating these functions.
Discussion
Besides the well-known damaging effects of ROS, specific signaling functions have been attributed to ROS in the nervous system, including regulation of programmed cell death (Maher and Schubert 2000) and long-term potentiation (Knapp and Klann 2002). Here, we provide the first evidence that a balance of physiological ROS levels is critical for maintaining a highly organized and dynamic F-actin cytoskeleton necessary for growth cone motility and neurite outgrowth. Thus, similarly to non-neuronal cells, neurons have evolved to use ROS as second messengers for development and normal physiology.
ROS Levels Control F-actin Structure and Dynamics in Growth Cones
In the present study, we provide evidence that physiological ROS levels are critical for regulating F-actin dynamics in the growth cone. Lowering ROS levels with either a general scavenger or by inhibiting NADPH oxidases and lipoxygenases, affected actin structure and dynamics similarly, although some slight differences were observed. The major effects were: (1) Reduced ruffling activity in the T zone; (2) Inhibition of actin assembly at the leading edge; (3) Attenuation of retrograde actin flow; (4) Increase in Rho-dependent arc contractility; (5) Disassembly of actin filaments. Thus, ROS depletion generally reduces the protrusive while increasing the contractile activity of the growth cone. Accordingly, we would expect that physiological ROS levels promote actin assembly and leading edge protrusion. The slightly distinct actin effects induced by the various ROS reagents are likely due to the different ROS sensitivity of specific actin processes as well as due to the localization of different ROS sources in the growth cone. For example, increase in arc contractility and inhibition of actin assembly could be observed only upon fast and strong reduction of ROS levels with 75 mM PBN and 0.2 mM MnTBAP (Fig. 4J and K). In 25 mM PBN, however, the actin cytoskeleton gradually disassembles before significant increases in arc contractility and assembly inhibition occur. This could also explain the C domain extension observed in 25 mM PBN but not in 75 mM PBN.
We also observed different effects on actin dynamics when inhibiting specific ROS sources. NADPH oxidase inhibition resulted in reduced actin flow, inhibition of actin assembly at the leading edge and ultimately disassembly of both actin networks and bundles (Fig. 4; Videos 8 and 9). Prolonged treatment with NADPH oxidase inhibitors reduced actin assembly in filopodial tips. NADPH oxidases are expressed in both central and peripheral neurons (Hilburger et al. 2005; Tejada-Simon et al. 2005); however, growth cone localization has not been demonstrated so far. Based on our results, we speculate that NADPH oxidases are localized to the plasma membrane of the lamellipodia and potentially enriched along the leading edge of growth cones where they control assembly of actin networks and bundles. Such findings would be consistent with the localization of NADPH oxidases in focal complexes of lamellipodia, in membrane ruffles and at the leading edge of migrating endothelial cells (Ushio-Fukai 2006).
Lipoxygenase inhibition did not inhibit actin assembly in filopodial tips and rather promoted filopodial lengthening (Fig. 3C and 4H). Furthermore, NDGA treatment caused actin arc accumulation similar to 75 mM PBN (Fig. 5), suggesting a role of lipoxygenase-derived ROS in the regulation of actomyosin-contractility in the T zone. Although lipoxygenases have not been localized to growth cones so far, there is experimental evidence that they are involved in semaphorin 3A-induced growth cone collapse of rat DRG neurons (Mikule et al. 2002) and netrin-1-mediated repulsive growth cone turning of Xenopus spinal cord neurons (Nishiyama et al. 2003). Thus, NADPH oxidases and lipoxygenases appear to have overlapping and distinct functions with respect to regulation of actin dynamics. Since ROS are short-lived and diffusible, the detailed localization of NADPH oxidases and lipoxygenases in growth cones appears to be critical and will be an interesting avenue for future investigations. Finally, our results demonstrate that mitochondria-derived ROS do not appear to play a role in the regulation of actin structure and dynamics in growth cones. While in previous studies rotenone treatment resulted in both increased (Barrientos and Moraes 1999) and decreased cellular ROS levels (Thompson et al. 2007), cytoplasmic levels in the P domain of rotenone-treated Aplysia growth cones were not significantly different from controls.
In summary, we found that reduced ROS levels cause decreased actin assembly, retrograde flow and increased arc contractility in neuronal growth cones. These findings are in agreement with results from fibroblasts, endothelial cells and macrophages, although previous studies did not visualize actin dynamics (Moldovan et al. 2006; Chiarugi and Fiaschi 2007). In these non-neuronal cells, experimental elevation of total ROS increased F-actin content, while reducing ROS levels by inhibition of NADPH oxidases and lipoxygenases decreased actin assembly, cell motility and spreading but increased stress fiber formation (Crawford et al. 1996; Zhao and Davis 1998; Moldovan et al. 2000; Miller et al. 2001; Chiarugi et al. 2003; Nimnual et al. 2003; Wojciak-Stothard et al. 2005; Alexandrova et al. 2006; Fiaschi et al. 2006). Thus, ROS regulate actin dynamics in different cell types.
Potential Targets of ROS in the Growth Cone Cytoskeleton
A number of proteins are regulated by reversible oxidation through ROS, including protein tyrosine phosphatases, both receptor and non-receptor tyrosine kinases (e.g., EGF receptor and Src), as well as actin itself (Meng et al. 2002; Chiarugi 2005; Moldovan et al. 2006; Chiarugi and Fiaschi 2007). We will discuss potential target proteins that regulate various aspects of actin dynamics in Aplysia growth cones in light of previous findings on ROS-mediated actin reorganization in fibroblasts and endothelial cells. Which proteins involved in actin assembly could be targeted by ROS? Rac1 is a key regulator of actin assembly processes (Etienne-Manneville and Hall 2002), thus a likely candidate. Indeed Rac1 activity is decreased in endothelial cells during hypoxia, while increased during reoxygenation (Wojciak-Stothard et al. 2005). Furthermore, antioxidants reduced Rac1 activity in fibroblasts (Alexandrova et al. 2006). There are a number of additional potential ROS target proteins involved in regulating actin assembly including Src tyrosine kinase and cofilin (Alexandrova et al. 2006; Moldovan et al. 2006; Chiarugi and Fiaschi 2007).
All experimental treatments that reduced cytoplasmic ROS levels in the growth cone also reduced PY levels in the P domain and along the leading edge (Figs. 1 and 7). Since ROS inhibit protein tyrosine phosphatases and activate protein tyrosine kinases (Meng et al. 2002; Chiarugi 2005), tyrosine phosphorylation is likely involved in ROS-mediated regulation of actin assembly. Although PAO can also inhibit tyrosine phosphatases at concentrations of 10 μM and higher (Le Cabec and Maridonneau-Parini 1995), we believe that the effects observed at concentrations of 1 μM and lower are largely through inhibition of NADPH oxidases and not tyrosine phosphatases. Evidence for this is given by the decreased PY levels after treatment with 1μM PAO, which could be due to reduced ROS-mediated phosphatase inhibition. Furthermore, our PAO data are consistent with results obtained with an alternative NADPH oxidase inhibitor, apocynin.
When growth cones were treated with NDGA, we observed initial filopodia lengthening similarly to other treatments that reduce ROS levels. However, in contrast to NADPH oxidase inhibition and PBN treatment, NDGA-treated filopodia maintained their length, contained F-actin and PY proteins at the tips (Fig. 3C”, 7E). These findings suggest that lipoxygenase-derived ROS may not control actin assembly at filopodia tips, but along the leading edge of lamellipodia. Since activated Src is also concentrated at filopodia tips (Suter et al. 2004; Robles et al. 2005), we hypothesize that ROS-mediated Src activation could be a major signaling pathway leading to actin assembly at the filopodia tips and leading edge. Finally, redox regulation of actin itself has been proposed as a potential mechanism for dynamic actin reorganization during integrin-mediated cell adhesion (Fiaschi et al. 2006). However, more work is needed to dissect the molecular details of actin assembly regulation by ROS.
Retrograde actin flow rates were decreased upon ROS depletion. Since myosin II motor activity largely drives actin flow in growth cones (Medeiros et al. 2006), we believe that reduced ROS levels may result in actomyosin interactions that are too tight and do not allow effective force production, since integrin-induced ROS cause actin oxidation and actomyosin disassembly in fibroblasts (Fiaschi et al. 2006). Furthermore, strong reduction of ROS levels with 75 mM PBN increased contractility of T zone arcs as evidenced by forward tugging of arcs, increased arc density, ripping apart of actomyosin networks and collapse of peripheral actin into the C domain. Since arc contractility is regulated by Rho GTPase (Zhang et al. 2003), we speculated that lowering ROS levels could increase Rho activity. Indeed Rho activity was increased in total CNS lysates after PBN treatment. How could ROS levels control Rho activity? A potential pathway from Rac1-mediated superoxide production to down-regulation of Rho activity has been reported for integrin-mediated spreading of HeLa cells (Nimnual et al. 2003). It involves ROS-mediated inhibition of low-molecular weight protein tyrosine phosphatase, which leads to phosphorylation and activation of p190Rho GAP, followed by reduced Rho activity. Similarly, reduced ROS levels resulted in Rho activation followed by actin stress fiber formation, dispersion of adherens junctions and increased endothelial permeability in fibroblasts and endothelial cells (Wojciak-Stothard et al. 2005; Alexandrova et al. 2006). In summary, we speculate that physiological ROS levels are necessary to promote Rac1-dependent actin assembly leading to protrusion, while reducing Rho-dependent actomyosin contractility leading to growth cone retraction.
ROS in Neurite Outgrowth
Reduced ROS levels by overnight treatment with either PBN or NADPH oxidase or lipoxygenase inhibitors significantly inhibited growth cone formation and neurite outgrowth. Thus, physiological ROS levels appear to have a positive effect on neurite outgrowth of primary neurons in culture through regulation of the actin cytoskeleton. Our findings are consistent with previous studies demonstrating that ROS can act as a positive signal mediator in neuron-like cell lines; for example, in NGF-induced neurite outgrowth of PC-12 cells (Suzukawa et al. 2000).
In summary, similarly to several other physiological systems, ROS emerge as Janus-faced signaling molecules in the nervous system as well. While a large body of evidence revealed the damaging effects of ROS in disease states, including spinal cord injury and neurodegeneration, ROS also have “positive” signaling functions in the nervous system, such as in synaptic function and plasticity, and neurite outgrowth. It will be of great interest to dissect which of the many axonal guidance receptors affect cytoskeletal dynamics via ROS signaling pathways.
Supplementary Material
DIC time lapse movie of growth cone in control (CTL) condition for 3.3 min followed by treatment with 25 mM PBN for 20 min (Fig. 2B and B’). PBN treatment caused an initial burst of filopodial growth, flattening of the T zone, disappearance of actin bundles in the P domain and forward movement of the C domain boundary. Time compression: 100X. Scale bar: 10 μm.
F-actin dynamics time lapse movie of growth cone labeled with Alexa 568-phalloidin in control (CTL) condition for 3.3 min followed by treatment with 50 μM NDGA for 20 min (Fig. 4H). PBN treatment resulted in reduced F-actin assembly, retraction of the actin network and contractile effects on F-actin arcs and networks in the T zone, similar to 75mM PBN treatment. Time compression: 100X. Scale bar: 10 μm.
F-actin dynamics time lapse movie of growth cone labeled with Alexa 568-phalloidin in control (CTL) condition for 3.3 min followed by treatment with 75 mM PBN for 5 min (Fig. 5A and C). PBN treatment resulted in inhibition of actin assembly, retraction of the actin network and contractile effects on actin arcs and networks in the T zone. Time compression: 100X. Scale bar: 10 μm.
F-actin dynamics time lapse movie of arc movements in the T zone (Fig. 5B and D) in control (CTL) conditions for 2 min and in 75 mM PBN for 2 min. In control conditions, arcs move retrogradely, while forward tugging and arc aggregation was observed in PBN. Time compression: 100X. Scale bar: 5 μm.
DIC time lapse movie of growth cone in control (CTL) condition for 3.3 min treated followed by treatment with 75 mM PBN for 5 min (Fig. 2C and C’). Besides flattening of the T zone and disappearance of actin bundles, the higher PBN dose also caused a slight retraction of the C domain boundary and reduced growth cone dynamics. Time compression: 100X. Scale bar: 10μm.
DIC time lapse movie of growth cone in control (CTL) condition for 3.3 min followed by treatment with 1 μM PAO for 10 min (Fig. 3A and A’). Besides flattening of the T zone and disappearance of actin bundles, PAO also caused a slight retraction of the C domain boundary. In addition, growth cone lamellipodia dynamics were reduced. Time compression: 100X. Scale bar: 10 μm.
DIC time lapse movie of growth cone in control (CTL) condition for 3.3 min followed by treatment with 4 mM apocynin for 10 min (Fig. 3B and B’). Apocynin caused flattening of the T zone, extension of the C domain and disappearance of actin bundles. Time compression: 100X. Scale bar: 10 μm.
DIC time lapse movie of growth cone in control (CTL) condition for 3.3 min followed by treatment with 50μM NDGA for 10 min (Fig. 3C and C’). NDGA caused flattening of the T zone, disappearance of actin bundles and filopodia lengthening. Time compression: 100X. Scale bar: 10 μm.
DIC time lapse movie of growth cone in control (CTL) condition for 3.3 min followed by treatment with 20 μM Rotenone for 10 min (Fig. 3D and D’). Rotenone treatment did not result in major morphological changes besides a slight splaying of the C domain. Time compression: 100X. Scale bar: 10 μm.
F-actin dynamics time lapse movie of growth cone labeled with Alexa 568-phalloidin in control (CTL) condition for 3.3 min followed by treatment with 25 mM PBN for 20 min (Fig. 4A and B). PBN treatment caused initial leading edge and filopodial protrusion, slowing of F-actin flow, disassembly of F-actin structures and narrowing of the P domain. Time compression: 100X. Scale bar: 10 μm.
F-actin dynamics time lapse movie of growth cone labeled with Alexa 568-phalloidin in control (CTL) condition for 3.3 min followed by treatment with 1 μM PAO for 30 min (Fig. 4D and E). PAO treatment resulted in slowing of actin flow, temporary lengthening of filopodia, forward movement of the recycling zone and ultimately disassembly of the actin cytoskeleton. Time compression: 100X. Scale bar: 10 μm.
F-actin dynamics time lapse movie of growth cone labeled with Alexa 568-phalloidin in control (CTL) condition for 3.3 min followed by treatment with 4 mM apocynin for 25 min (Fig. 4G). Apocynin treatment resulted in slowing of actin flow, temporary lengthening of filopodia, forward movement of the recycling zone and ultimately disassembly of the actin cytoskeleton. Time compression: 100X. Scale bar: 10 μm.
Acknowledgments
The p1D9 anti-rho monoclonal antibody developed by Dr. Susan Parkhurst was obtained by the Developmental Studies Hybridoma Bank developed under the auspices of the NICHD and maintained by The University of Iowa, Department of Biological Sciences, Iowa City, IA 52242. We thank Dr. Donald Ready as well members of the Suter lab for comments on the manuscript. We also thank Corinne Weisheit for assistance with MnTBAP experiments. This work was supported by grants from the NIH (R01 NS049233) and the Bindley Bioscience Center at Purdue University to D.M.S. V. M. was partially supported by fellowships through the PULSe and PUN Integrative Neuroscience graduate programs at Purdue University.
Abbreviations
- ASW
artificial seawater
- C
central
- DCFH-DA
2’,7’-dichlorofluorescin diacetate
- DIC
differential interference contrast
- FSM
fluorescent speckle microscopy
- H2O2
hydrogen peroxide
- LPA
oleoyl-L-α-lysophosphatidic acid sodium salt
- MnTBAP
Mn(III) tetrakis(4-benzoic acid) porphyrin chloride
- NDGA
nordihydroguairetic acid
- NtBHA
N-tert-butyl-hydroxylamine acetate
- P
peripheral
- PAO
phenyl arsine oxide
- PBN
N-tert-butyl-α-phenylnitrone
- PY
phosphotyrosine
- ROS
reactive oxygen species
- T
transition
- tBHP
tert-butyl hydroperoxide
References
- Abo A, Pick E, Hall A, Totty N, Teahan CG, Segal AW. Activation of the NADPH oxidase involves the small GTP-binding protein p21rac1. Nature. 1991;353:668–670. doi: 10.1038/353668a0. [DOI] [PubMed] [Google Scholar]
- Alexandrova AY, Kopnin PB, Vasiliev JM, Kopnin BP. ROS up-regulation mediates Ras-induced changes of cell morphology and motility. Exp Cell Res. 2006;312:2066–2073. doi: 10.1016/j.yexcr.2006.03.004. [DOI] [PubMed] [Google Scholar]
- Barrientos A, Moraes CT. Titrating the effects of mitochondrial complex I impairment in the cell physiology. J Biol Chem. 1999;274:16188–16197. doi: 10.1074/jbc.274.23.16188. [DOI] [PubMed] [Google Scholar]
- Bedard K, Krause KH. The NOX family of ROS-generating NADPH oxidases: physiology and pathophysiology. Physiol Rev. 2007;87:245–313. doi: 10.1152/physrev.00044.2005. [DOI] [PubMed] [Google Scholar]
- Chang S, Rathjen FG, Raper JA. Extension of neurites on axons is impaired by antibodies against specific neural cell surface glycoproteins. J Cell Biol. 1987;104:355–362. doi: 10.1083/jcb.104.2.355. [DOI] [PMC free article] [PubMed] [Google Scholar]
- Chiarugi P. PTPs versus PTKs: The redox side of the coin. Free Radical Research. 2005;39:353–364. doi: 10.1080/10715760400027987. [DOI] [PubMed] [Google Scholar]
- Chiarugi P, Fiaschi T. Redox signalling in anchorage-dependent cell growth. Cell Signal. 2007;19:672–682. doi: 10.1016/j.cellsig.2006.11.009. [DOI] [PubMed] [Google Scholar]
- Chiarugi P, Pani G, Giannoni E, Taddei L, Colavitti R, Raugei G, Symons M, Borrello S, Galeotti T, Ramponi G. Reactive oxygen species as essential mediators of cell adhesion: the oxidative inhibition of a FAK tyrosine phosphatase is required for cell adhesion. J Cell Biol. 2003;161:933–944. doi: 10.1083/jcb.200211118. [DOI] [PMC free article] [PubMed] [Google Scholar]
- Crawford LE, Milliken EE, Irani K, Zweier JL, Becker LC, Johnson TM, Eissa NT, Crystal RG, Finkel T, Goldschmidt-Clermont PJ. Superoxide-mediated actin response in post-hypoxic endothelial cells. J Biol Chem. 1996;271:26863–26867. doi: 10.1074/jbc.271.43.26863. [DOI] [PubMed] [Google Scholar]
- Cui ZG, Kondo T, Matsumoto H. Enhancement of apoptosis by nitric oxide released from alpha-phenyl-tert-butyl nitrone under hyperthermic conditions. J Cell Physiol. 2006;206:468–476. doi: 10.1002/jcp.20482. [DOI] [PubMed] [Google Scholar]
- Duan Y, Gross RA, Sheu SS. Ca2+-dependent generation of mitochondrial reactive oxygen species serves as a signal for poly(ADP-ribose) polymerase-1 activation during glutamate excitotoxicity. J Physiol. 2007;585:741–758. doi: 10.1113/jphysiol.2007.145409. [DOI] [PMC free article] [PubMed] [Google Scholar]
- Etienne-Manneville S, Hall A. Rho GTPases in cell biology. Nature. 2002;420:629–635. doi: 10.1038/nature01148. [DOI] [PubMed] [Google Scholar]
- Fiaschi T, Cozzi G, Raugei G, Formigli L, Ramponi G, Chiarugi P. Redox regulation of beta-actin during integrin-mediated cell adhesion. J Biol Chem. 2006;281:22983–22991. doi: 10.1074/jbc.M603040200. [DOI] [PubMed] [Google Scholar]
- Forscher P, Smith SJ. Actions of cytochalasins on the organization of actin filaments and microtubules in a neuronal growth cone. J Cell Biol. 1988;107:1505–1516. doi: 10.1083/jcb.107.4.1505. [DOI] [PMC free article] [PubMed] [Google Scholar]
- Gallo G. RhoA-kinase coordinates F-actin organization and myosin II activity during semaphorin-3A-induced axon retraction. J Cell Sci. 2006;119:3413–3423. doi: 10.1242/jcs.03084. [DOI] [PMC free article] [PubMed] [Google Scholar]
- Gallo G, Letourneau PC. Regulation of growth cone actin filaments by guidance cues. J Neurobiol. 2004;58:92–102. doi: 10.1002/neu.10282. [DOI] [PubMed] [Google Scholar]
- Giniger E. How do Rho family GTPases direct axon growth and guidance? A proposal relating signaling pathways to growth cone mechanics. Differentiation. 2002;70:385–396. doi: 10.1046/j.1432-0436.2002.700801.x. [DOI] [PubMed] [Google Scholar]
- Grzywa EL, Lee AC, Lee GU, Suter DM. High-resolution analysis of neuronal growth cone morphology by comparative atomic force and optical microscopy. J Neurobiol. 2006;66:1529–1543. doi: 10.1002/neu.20318. [DOI] [PubMed] [Google Scholar]
- Hilburger EW, Conte EJ, McGee DW, Tammariello SP. Localization of NADPH oxidase subunits in neonatal sympathetic neurons. Neurosci Lett. 2005;377:16–19. doi: 10.1016/j.neulet.2004.11.066. [DOI] [PubMed] [Google Scholar]
- Jalink K, van Corven EJ, Hengeveld T, Morii N, Narumiya S, Moolenaar WH. Inhibition of lysophosphatidate- and thrombin-induced neurite retraction and neuronal cell rounding by ADP ribosylation of the small GTP-binding protein Rho. J Cell Biol. 1994;126:801–810. doi: 10.1083/jcb.126.3.801. [DOI] [PMC free article] [PubMed] [Google Scholar]
- Knapp LT, Klann E. Role of reactive oxygen species in hippocampal long-term potentiation: contributory or inhibitory? J Neurosci Res. 2002;70:1–7. doi: 10.1002/jnr.10371. [DOI] [PubMed] [Google Scholar]
- Kotake Y, Sang H, Miyajima T, Wallis GL. Inhibition of NF-kappaB, iNOS mRNA, COX2 mRNA, and COX catalytic activity by phenyl-N-tert-butylnitrone (PBN) Biochim Biophys Acta. 1998;1448:77–84. doi: 10.1016/s0167-4889(98)00126-8. [DOI] [PubMed] [Google Scholar]
- Lambeth JD. Nox enzymes, ROS, and chronic disease: an example of antagonistic pleiotropy. Free Radic Biol Med. 2007;43:332–347. doi: 10.1016/j.freeradbiomed.2007.03.027. [DOI] [PMC free article] [PubMed] [Google Scholar]
- Le Cabec V, Maridonneau-Parini I. Complete and reversible inhibition of NADPH oxidase in human neutrophils by phenylarsine oxide at a step distal to membrane translocation of the enzyme subunits. J Biol Chem. 1995;270:2067–2073. doi: 10.1074/jbc.270.5.2067. [DOI] [PubMed] [Google Scholar]
- Lee AC, Decourt B, Suter DM. Neuronal cell cultures from Aplysia for high-resolution imaging of growth cones. J Vis Experim. 2008:12. doi: 10.3791/662. [DOI] [PMC free article] [PubMed] [Google Scholar]
- Lewis AK, Bridgman PC. Nerve growth cone lamellipodia contain two populations of actin filaments that differ in organization and polarity. J Cell Biol. 1992;119:1219–1243. doi: 10.1083/jcb.119.5.1219. [DOI] [PMC free article] [PubMed] [Google Scholar]
- Luo J, Li N, Robinson JP, Shi R. The increase of reactive oxygen species and their inhibition in an isolated guinea pig spinal cord compression model. Spinal Cord. 2002;40:656–665. doi: 10.1038/sj.sc.3101363. [DOI] [PubMed] [Google Scholar]
- Maher P, Schubert D. Signaling by reactive oxygen species in the nervous system. Cell Mol Life Sci. 2000;57:1287–1305. doi: 10.1007/PL00000766. [DOI] [PMC free article] [PubMed] [Google Scholar]
- Medeiros NA, Burnette DT, Forscher P. Myosin II functions in actin-bundle turnover in neuronal growth cones. Nat Cell Biol. 2006;8:215–226. doi: 10.1038/ncb1367. [DOI] [PubMed] [Google Scholar]
- Meng TC, Fukada T, Tonks NK. Reversible oxidation and inactivation of protein tyrosine phosphatases in vivo. Mol Cell. 2002;9:387–399. doi: 10.1016/s1097-2765(02)00445-8. [DOI] [PubMed] [Google Scholar]
- Mikule K, Gatlin JC, de la Houssaye BA, Pfenninger KH. Growth cone collapse induced by semaphorin 3A requires 12/15-lipoxygenase. J Neurosci. 2002;22:4932–4941. doi: 10.1523/JNEUROSCI.22-12-04932.2002. [DOI] [PMC free article] [PubMed] [Google Scholar]
- Miller YI, Chang MK, Funk CD, Feramisco JR, Witztum JL. 12/15-lipoxygenase translocation enhances site-specific actin polymerization in macrophages phagocytosing apoptotic cells. J Biol Chem. 2001;276:19431–19439. doi: 10.1074/jbc.M011276200. [DOI] [PubMed] [Google Scholar]
- Moldovan L, Mythreye K, Goldschmidt-Clermont PJ, Satterwhite LL. Reactive oxygen species in vascular endothelial cell motility. Roles of NAD(P)H oxidase and Rac1. Cardiovasc Res. 2006;71:236–246. doi: 10.1016/j.cardiores.2006.05.003. [DOI] [PubMed] [Google Scholar]
- Moldovan L, Moldovan NI, Sohn RH, Parikh SA, Goldschmidt-Clermont PJ. Redox changes of cultured endothelial cells and actin dynamics. Circ Res. 2000;86:549–557. doi: 10.1161/01.res.86.5.549. [DOI] [PubMed] [Google Scholar]
- Nimnual AS, Taylor LJ, Bar-Sagi D. Redox-dependent downregulation of Rho by Rac. Nat Cell Biol. 2003;5:236–241. doi: 10.1038/ncb938. [DOI] [PubMed] [Google Scholar]
- Nishiyama M, Hoshino A, Tsai L, Henley JR, Goshima Y, Tessier-Lavigne M, Poo MM, Hong K. Cyclic AMP/GMP-dependent modulation of Ca2+ channels sets the polarity of nerve growth-cone turning. Nature. 2003;423:990–995. doi: 10.1038/nature01751. [DOI] [PubMed] [Google Scholar]
- Patel M. Inhibition of neuronal apoptosis by a metalloporphyrin superoxide dismutase mimic. J Neurochem. 1998;71:1068–1074. doi: 10.1046/j.1471-4159.1998.71031068.x. [DOI] [PubMed] [Google Scholar]
- Reynolds IJ, Hastings TG. Glutamate induces the production of reactive oxygen species in cultured forebrain neurons following NMDA receptor activation. J Neurosci. 1995;15:3318–3327. doi: 10.1523/JNEUROSCI.15-05-03318.1995. [DOI] [PMC free article] [PubMed] [Google Scholar]
- Robles E, Woo S, Gomez TM. Src-dependent tyrosine phosphorylation at the tips of growth cone filopodia promotes extension. J Neurosci. 2005;25:7669–7681. doi: 10.1523/JNEUROSCI.2680-05.2005. [DOI] [PMC free article] [PubMed] [Google Scholar]
- Rochlin MW, Dailey ME, Bridgman PC. Polymerizing microtubules activate site-directed F-actin assembly in nerve growth cones. Mol Biol Cell. 1999;10:2309–2327. doi: 10.1091/mbc.10.7.2309. [DOI] [PMC free article] [PubMed] [Google Scholar]
- Salari H, Braquet P, Borgeat P. Comparative effects of indomethacin, acetylenic acids, 15-HETE, nordihydroguaiaretic acid and BW755C on the metabolism of arachidonic acid in human leukocytes and platelets. Prostaglandins Leukot Med. 1984;13:53–60. doi: 10.1016/0262-1746(84)90102-1. [DOI] [PubMed] [Google Scholar]
- Schaefer AW, Kabir N, Forscher P. Filopodia and actin arcs guide the assembly and transport of two populations of microtubules with unique dynamic parameters in neuronal growth cones. J Cell Biol. 2002;158:139–152. doi: 10.1083/jcb.200203038. [DOI] [PMC free article] [PubMed] [Google Scholar]
- Stolk J, Hiltermann TJ, Dijkman JH, Verhoeven AJ. Characteristics of the inhibition of NADPH oxidase activation in neutrophils by apocynin, a methoxy-substituted catechol. Am J Respir Cell Mol Biol. 1994;11:95–102. doi: 10.1165/ajrcmb.11.1.8018341. [DOI] [PubMed] [Google Scholar]
- Sturgess NC, Rustad A, Fonnum F, Lock EA. Neurotoxic effect of L-2-chloropropionic acid on primary cultures of rat cerebellar granule cells. Arch Toxicol. 2000;74:153–160. doi: 10.1007/s002040050668. [DOI] [PubMed] [Google Scholar]
- Suter DM, Forscher P. Transmission of growth cone traction force through apCAM-cytoskeletal linkages is regulated by Src family tyrosine kinase activity. J Cell Biol. 2001;155:427–438. doi: 10.1083/jcb.200107063. [DOI] [PMC free article] [PubMed] [Google Scholar]
- Suter DM, Schaefer AW, Forscher P. Microtubule dynamics are necessary for SRC family kinase-dependent growth cone steering. Curr Biol. 2004;14:1194–1199. doi: 10.1016/j.cub.2004.06.049. [DOI] [PubMed] [Google Scholar]
- Suter DM, Errante LD, Belotserkovsky V, Forscher P. The Ig superfamily cell adhesion molecule, apCAM, mediates growth cone steering by substrate-cytoskeletal coupling. J Cell Biol. 1998;141:227–240. doi: 10.1083/jcb.141.1.227. [DOI] [PMC free article] [PubMed] [Google Scholar]
- Suzukawa K, Miura K, Mitsushita J, Resau J, Hirose K, Crystal R, Kamata T. Nerve growth factor-induced neuronal differentiation requires generation of Rac1-regulated reactive oxygen species. J Biol Chem. 2000;275:13175–13178. doi: 10.1074/jbc.275.18.13175. [DOI] [PubMed] [Google Scholar]
- Tabner BJ, Turnbull S, El-Agnaf O, Allsop D. Production of reactive oxygen species from aggregating proteins implicated in Alzheimer's disease, Parkinson's disease and other neurodegenerative diseases. Curr Top Med Chem. 2001;1:507–517. doi: 10.2174/1568026013394822. [DOI] [PubMed] [Google Scholar]
- Tejada-Simon MV, Serrano F, Villasana LE, Kanterewicz BI, Wu GY, Quinn MT, Klann E. Synaptic localization of a functional NADPH oxidase in the mouse hippocampus. Mol Cell Neurosci. 2005;29:97–106. doi: 10.1016/j.mcn.2005.01.007. [DOI] [PMC free article] [PubMed] [Google Scholar]
- Thannickal VJ, Fanburg BL. Reactive oxygen species in cell signaling. Am J Physiol Lung Cell Mol Physiol. 2000;279:L1005–1028. doi: 10.1152/ajplung.2000.279.6.L1005. [DOI] [PubMed] [Google Scholar]
- Thomas CE, Ohlweiler DF, Taylor VL, Schmidt CJ. Radical trapping and inhibition of iron-dependent CNS damage by cyclic nitrone spin traps. J Neurochem. 1997;68:1173–1182. doi: 10.1046/j.1471-4159.1997.68031173.x. [DOI] [PubMed] [Google Scholar]
- Thompson RJ, Buttigieg J, Zhang M, Nurse CA. A rotenone-sensitive site and H2O2 are key components of hypoxia-sensing in neonatal rat adrenomedullary chromaffin cells. Neuroscience. 2007;145:130–141. doi: 10.1016/j.neuroscience.2006.11.040. [DOI] [PubMed] [Google Scholar]
- Ushio-Fukai M. Localizing NADPH oxidase-derived ROS. Sci STKE. 2006;2006:re8. doi: 10.1126/stke.3492006re8. [DOI] [PubMed] [Google Scholar]
- Waterman-Storer CM, Desai A, Bulinski JC, Salmon ED. Fluorescent speckle microscopy, a method to visualize the dynamics of protein assemblies in living cells. Curr Biol. 1998;8:1227–1230. doi: 10.1016/s0960-9822(07)00515-5. [DOI] [PubMed] [Google Scholar]
- Wojciak-Stothard B, Tsang LY, Haworth SG. Rac and Rho play opposing roles in the regulation of hypoxia/reoxygenation-induced permeability changes in pulmonary artery endothelial cells. Am J Physiol Lung Cell Mol Physiol. 2005;288:L749–760. doi: 10.1152/ajplung.00361.2004. [DOI] [PubMed] [Google Scholar]
- Woo CH, Eom YW, Yoo MH, You HJ, Han HJ, Song WK, Yoo YJ, Chun JS, Kim JH. Tumor necrosis factor-alpha generates reactive oxygen species via a cytosolic phospholipase A2-linked cascade. J Biol Chem. 2000;275:32357–32362. doi: 10.1074/jbc.M005638200. [DOI] [PubMed] [Google Scholar]
- Xu W, Chi L, Xu R, Ke Y, Luo C, Cai J, Qiu M, Gozal D, Liu R. Increased production of reactive oxygen species contributes to motor neuron death in a compression mouse model of spinal cord injury. Spinal Cord. 2005;43:204–213. doi: 10.1038/sj.sc.3101674. [DOI] [PubMed] [Google Scholar]
- Zhang XF, Schaefer AW, Burnette DT, Schoonderwoert VT, Forscher P. Rho-dependent contractile responses in the neuronal growth cone are independent of classical peripheral retrograde actin flow. Neuron. 2003;40:931–944. doi: 10.1016/s0896-6273(03)00754-2. [DOI] [PubMed] [Google Scholar]
- Zhao Y, Davis HW. Hydrogen peroxide-induced cytoskeletal rearrangement in cultured pulmonary endothelial cells. J Cell Physiol. 1998;174:370–379. doi: 10.1002/(SICI)1097-4652(199803)174:3<370::AID-JCP11>3.0.CO;2-D. [DOI] [PubMed] [Google Scholar]
- Zini I, Tomasi A, Grimaldi R, Vannini V, Agnati LF. Detection of free radicals during brain ischemia and reperfusion by spin trapping and microdialysis. Neurosci Lett. 1992;138:279–282. doi: 10.1016/0304-3940(92)90933-x. [DOI] [PubMed] [Google Scholar]
Associated Data
This section collects any data citations, data availability statements, or supplementary materials included in this article.
Supplementary Materials
DIC time lapse movie of growth cone in control (CTL) condition for 3.3 min followed by treatment with 25 mM PBN for 20 min (Fig. 2B and B’). PBN treatment caused an initial burst of filopodial growth, flattening of the T zone, disappearance of actin bundles in the P domain and forward movement of the C domain boundary. Time compression: 100X. Scale bar: 10 μm.
F-actin dynamics time lapse movie of growth cone labeled with Alexa 568-phalloidin in control (CTL) condition for 3.3 min followed by treatment with 50 μM NDGA for 20 min (Fig. 4H). PBN treatment resulted in reduced F-actin assembly, retraction of the actin network and contractile effects on F-actin arcs and networks in the T zone, similar to 75mM PBN treatment. Time compression: 100X. Scale bar: 10 μm.
F-actin dynamics time lapse movie of growth cone labeled with Alexa 568-phalloidin in control (CTL) condition for 3.3 min followed by treatment with 75 mM PBN for 5 min (Fig. 5A and C). PBN treatment resulted in inhibition of actin assembly, retraction of the actin network and contractile effects on actin arcs and networks in the T zone. Time compression: 100X. Scale bar: 10 μm.
F-actin dynamics time lapse movie of arc movements in the T zone (Fig. 5B and D) in control (CTL) conditions for 2 min and in 75 mM PBN for 2 min. In control conditions, arcs move retrogradely, while forward tugging and arc aggregation was observed in PBN. Time compression: 100X. Scale bar: 5 μm.
DIC time lapse movie of growth cone in control (CTL) condition for 3.3 min treated followed by treatment with 75 mM PBN for 5 min (Fig. 2C and C’). Besides flattening of the T zone and disappearance of actin bundles, the higher PBN dose also caused a slight retraction of the C domain boundary and reduced growth cone dynamics. Time compression: 100X. Scale bar: 10μm.
DIC time lapse movie of growth cone in control (CTL) condition for 3.3 min followed by treatment with 1 μM PAO for 10 min (Fig. 3A and A’). Besides flattening of the T zone and disappearance of actin bundles, PAO also caused a slight retraction of the C domain boundary. In addition, growth cone lamellipodia dynamics were reduced. Time compression: 100X. Scale bar: 10 μm.
DIC time lapse movie of growth cone in control (CTL) condition for 3.3 min followed by treatment with 4 mM apocynin for 10 min (Fig. 3B and B’). Apocynin caused flattening of the T zone, extension of the C domain and disappearance of actin bundles. Time compression: 100X. Scale bar: 10 μm.
DIC time lapse movie of growth cone in control (CTL) condition for 3.3 min followed by treatment with 50μM NDGA for 10 min (Fig. 3C and C’). NDGA caused flattening of the T zone, disappearance of actin bundles and filopodia lengthening. Time compression: 100X. Scale bar: 10 μm.
DIC time lapse movie of growth cone in control (CTL) condition for 3.3 min followed by treatment with 20 μM Rotenone for 10 min (Fig. 3D and D’). Rotenone treatment did not result in major morphological changes besides a slight splaying of the C domain. Time compression: 100X. Scale bar: 10 μm.
F-actin dynamics time lapse movie of growth cone labeled with Alexa 568-phalloidin in control (CTL) condition for 3.3 min followed by treatment with 25 mM PBN for 20 min (Fig. 4A and B). PBN treatment caused initial leading edge and filopodial protrusion, slowing of F-actin flow, disassembly of F-actin structures and narrowing of the P domain. Time compression: 100X. Scale bar: 10 μm.
F-actin dynamics time lapse movie of growth cone labeled with Alexa 568-phalloidin in control (CTL) condition for 3.3 min followed by treatment with 1 μM PAO for 30 min (Fig. 4D and E). PAO treatment resulted in slowing of actin flow, temporary lengthening of filopodia, forward movement of the recycling zone and ultimately disassembly of the actin cytoskeleton. Time compression: 100X. Scale bar: 10 μm.
F-actin dynamics time lapse movie of growth cone labeled with Alexa 568-phalloidin in control (CTL) condition for 3.3 min followed by treatment with 4 mM apocynin for 25 min (Fig. 4G). Apocynin treatment resulted in slowing of actin flow, temporary lengthening of filopodia, forward movement of the recycling zone and ultimately disassembly of the actin cytoskeleton. Time compression: 100X. Scale bar: 10 μm.