

Abstract
Recent reports have demonstrated the adverse effects of venous congestion on renal function and challenged the assumption that worsening renal function (RF) is driven by diminished cardiac output (CO). We hypothesized that diuresis in patients with right ventricular (RV) dysfunction, despite diminished CO, would lead to a reduction in venous congestion and resultant improvement in renal function. We reviewed consecutive admissions with a discharge diagnosis of heart failure (HF). RV function was assessed by multiple echocardiographic methods and those with ≥2 measures of RV dysfunction were considered to have significant RV dysfunction. Worsening RF was defined as an increase in creatinine of ≥0.3 mg/dL and improved RF as improvement in glomerular filtration rate ≥25%. A total of 141 admissions met eligibility criteria, 34% developed worsening RF. Venous congestion was more common in those with RV dysfunction (OR=3.3, p=0.009). All measures of RV dysfunction excluding RV dilation correlated with CO (p<0.05). Significant RV dysfunction predicted a lower incidence of worsening RF (OR=0.21, p<0.001) and higher incidence of improved RF (OR=6.4, p<0.001). CO emerged as a significant predictor of change in glomerular filtration rate during hospitalization in those without significant RV dysfunction (r=0.38, p<0.001). In conclusion, RV dysfunction is a strong predictor of improved renal outcomes in patients with acute decompensated HF, an effect likely mediated by relief of venous congestion.
Keywords: Cardio-renal syndrome, worsening renal function, RV dysfunction, improved renal function
Introduction
Right ventricular (RV) dysfunction is often associated with reduced cardiac output (CO), venous congestion, and a poor prognosis (1–7). We hypothesized that diuresis in patients with decompensated heart failure (HF) and RV dysfunction, despite a diminished CO, would lead to a reduction in venous congestion and resultant improvement in renal function (RF). Additionally, we hypothesized that the improvement in RF seen in these patients may explain the previously reported lack of association between CO and RF observed in unselected populations.
Methods
We reviewed consecutive admissions to the clinical cardiology or internal medicine services at the Hospital of the University of Pennsylvania with a primary discharge diagnosis of HF from December 1, 2004 to December 1, 2007. Study inclusion criteria were visualization of the right ventricle and inferior vena cava during echocardiography within 48 hours of admission, admission B-type natriuretic peptide >400 pg/mL, intravenous loop diuretic administration at least 50% of the initial hospital stay, and a length of admission 3 to 10 days. Exclusion criteria were renal replacement therapy, intravenous inotrope administration, or lack of admission or discharge serum creatinine level. Admissions to subspecialty HF or interventional services were excluded to avoid a predominantly stage D population and confounding from contrast nephropathy, respectively. Institutional review board approval was obtained for the study.
Maximum diuretic dose was defined as the greatest total number of furosemide equivalents in one day. Glomerular filtration rate was calculated by the Modified Diet and Renal Disease equation (8). Improved RF was defined as an improvement in glomerular filtration rate of ≥25% from admission to discharge. To maintain consistency with other publications on the subject of worsening RF this variable was defined as an increase in serum creatinine level ≥0.3 mg/dL above admission value (9).
Echocardiography was performed for clinical indications at the request of the treating physician. Due to the complex geometry and lack of accepted standard for echocardiographic evaluation of RV function, four different measures were obtained; fractional area change, tricuspid annular plane systolic excursion, qualitative RV dilation (qRV dilation), and two-dimensional qualitative RV function (qRV dysfunction). Tricuspid annular plane systolic excursion and fractional area change were measured in the apical four chamber view by a single experienced echocardiographer blinded to the study outcomes. Values for tricuspid annular plane systolic excursion and fractional area change were divided into quartiles and the bottom quartile used to represent significant RV dysfunction. Qualitative measures of RV size and function were estimated from multiple views and graded as normal, mild, moderate and severe dysfunction or dilation at the time of clinical read by experienced level III certified echocardiographers. Values of moderate and severe were used to represent significant RV dysfunction for these variables. A composite variable (cRV dysfunction) describing RV dysfunction was generated and defined as ≥2 positive measures of significant RV dysfunction.
The inferior vena cava was imaged from the subcostal view while patients were asked to rapidly inhale or “sniff” during image acquisition. Inspiratory inferior vena cava collapse was classified as complete, less than 50%, greater than 50%, or no collapse. Early peak mitral inflow velocity, early septal and lateral annular tissue Doppler velocities, left ventricular outflow tract diameter, and left ventricular outflow tract time velocity integral were measured. All two-dimensional and color Doppler parameters were visually estimated at the time of clinical read. Each spectral echo parameter was measured and averaged from at least three cardiac cycles in patients in sinus rhythm and from five cycles in patients with atrial fibrillation. CO was calculated using the equation 0.785 * (left ventricular outflow tract diameter)2 * (left ventricular outflow tract time velocity integral) (10).
Values are reported as median with interquartile range (25th percentile to 75th percentile), mean +/− standard deviation, and percentile value for non-parametric, parametric, and categorical variables respectively. One-way ANOVA, Kruskal-Wallis, Independent Student’s t-test, or the Mann-Whitney U test was used to compare means of independent continuous variables. Pearson’s Chi Square or Fisher’s exact test (when expected frequencies were <5) were used to evaluate categorical variables. Correlation values reported are Pearson’s for parametric data and Spearman’s for nonparametric data. All baseline variables were tested for association and included in multivariate regression modeling with backward elimination if p<0.1. Independence of individual RV function parameters was determined with a backward elimination multivariate regression model. Determination of R2 change for addition of inspiratory inferior vena cava collapse to a model containing qRV dilation was based on a hierarchal regression analysis. Statistical analysis was performed with SPSS version 17.0 (SPSS Inc, Chicago, Illinois) and significance was defined as 2-tailed p<0.05.
Results
A total of 141 admissions met eligibility criteria: 33 from the general cardiology service and 108 from the medicine service. For the cohort as a whole, median length of hospital stay was 5 days (4 to 7), median time to peak creatinine level was 3 days (2 to 5), and median left ventricular ejection fraction was 24% (15 to 47). Left ventricular ejection fraction ≥50% was present in 23% of the cohort. Worsening RF occurred in 34% of the total population. Significant RV dysfunction, defined by the composite variable (cRV dysfunction), was present in 35% of the population.
Overall, the group with cRV dysfunction had several worse measures of disease severity including lower CO, lower left ventricular ejection fraction, higher loop diuretic doses, increased severity of tricuspid regurgitation, and higher B-type natriuretic peptide levels (Table 1). All measures of RV dysfunction correlated internally (Table 2). Admission glomerular filtration rate was higher in the group with RV dysfunction, however median creatinine level was not significantly different (Table 1). Those with cRV dysfunction had an increased incidence of venous congestion evidenced by lack of inspiratory inferior vena cava collapse (OR=3.3, p=0.009).
Table 1.
Patient characteristics grouped by composite right ventricular dysfunction variable
| Variable | Right Ventricular Dysfunction | p Value | |
|---|---|---|---|
| No (n=92) | Yes (n=49) | ||
| Age (years) | 63 ± 16 | 61 ± 17 | 0.56 |
| African American | 75 (82%) | 34 (69%) | 0.1 |
| Male | 46 (47%) | 30 (61%) | 0.1 |
| Systolic blood pressure (mmHg) | 149 ± 31 | 145 ± 34 | 0.49 |
| Heart rate (beats per minute) | 80 ± 17 | 85 ± 12 | 0.06 |
| General medical service | 71 (77%) | 36 (75%) | 0.77 |
| Volume overload on chest X-ray | 46 (71%) | 22 (65%) | 0.54 |
| Hemoglobin (g/dL) | 11.9 ± 2.0 | 12.7 ± 2.4 | 0.02* |
| Detectable troponin I | 19 (21%) | 16 (33%) | 0.12 |
| Blood urea nitrogen (mg/dL) | 19 (14 to 28) | 25 (18 to 33) | 0.07 |
| Serum sodium (mg/dL) | 139.7 ± 5.2 | 138.4 ± 4.6 | 0.13 |
| Admission glomerular filtration rate (mL/min/1.73m2) | 59.6 ± 29.4 | 70.4 ± 22.8 | 0.03* |
| Admission serum creatinine (mg/dL) | 1.3 (1.0 to 1.5) | 1.2 (1.0 to 1.7) | 0.98 |
| B-type natriureetic peptide (pg/dL) | 1279 (861 to 2299) | 1987 (1042 to 4000) | 0.003* |
| Maximum diuretic dose (mg/day) | 80 (80 to 160) | 120 (80 to 200) | 0.03* |
| Thiazide use | 12 (13%) | 7 (14%) | 0.84 |
| Net fluid out (L) | 3.9 (1.4 to 5.9) | 4.5 (1.5 to 8.5) | 0.28 |
| Length of stay (days) | 4 (3.3 to 6.0) | 6 (4.0 to 8.0) | 0.02* |
| Day peak creatinine (days) | 4 (3 to 5) | 2 (2 to 6) | 0.11 |
| Ejection fraction (%) | 33 (16 to 55) | 20 (10 to 29) | <0.001* |
| Early peak mitral inflow velocity/early peak annular tissue velocity (septal) | 17.7 ± 8.3 | 19.7 ± 12.2 | 0.35 |
| Early peak mitral inflow velocity/early peak annular tissue velocity (lateral) | 12.1 ± 5.6 | 12.6 ± 8.3 | 0.68 |
| Cardiac output (L/min) | 4.9 ± 1.8 | 4.0 ± 1.7 | 0.01* |
| Left atrial size (cm) | 4.7 ± 0.7 | 4.9 ± 0.8 | 0.13 |
| Moderate or severe tricuspid regurgitation | 37 (40%) | 29 (59%) | 0.03* |
| Lack of inspiratory inferior vena cava collapse | 9 (10%) | 13 (27%) | 0.009* |
represents a significant p value.
Table 2.
Correlations between different measures of right ventricular function and venous congestion*
| Variables | Tricuspid annular plane systolic excursion | Right ventricular fractional area change | Qualitative right ventricular function | Qualitative right ventricular dilation | Inspiratory inferior vena cava collapse |
|---|---|---|---|---|---|
| Tricuspid annular plane systolic excursion (n=130) | r=0.39 | r=−0.47 | r=−0.36 | r=0.34 | |
| Right ventricular fractional area change (n=133) | r=0.39 | r=−0.55 | r=−0.45 | r=0.24 | |
| Qualitative right ventricular function (n=140) | r=−0.47 | r=−0.55 | r=0.60 | r=−0.42 | |
| Qualitative right ventricular dilation (n=139) | r=−0.36 | r=−0.45 | r=0.60 | r=−0.42 | |
| Inspiratory inferior vena cava collapse (n=141) | r=0.34 | r=0.24 | r=−0.42 | r=−0.42 |
All correlation coefficient p values </= 0.005.
Despite a general trend toward worse indices of disease severity (Table 1), the group with cRV dysfunction had a net improvement in glomerular filtration rate during hospitalization whereas those without cRV dysfunction had a deterioration in RF [7.2% (−6.5 to 21.6) vs.−8.8% (−17.0 to 7.0), p<0.0001]. Improved RF (defined as a 25% improvement in glomerular filtration rate) occurred more frequently in those with cRV dysfunction (22.4% vs. 4.3%, OR=6.4, p<0.001). Similar trends were found with the individual components of the cRV dysfunction variable (qRV dysfunction OR=3.3, p=0.01; qRV dilation OR=5.8, p=0.001; tricuspid annular plane systolic excursion OR=4.3, p=0.01; fractional area change OR=2.6, p=0.11) and the incidence of improved RF increased with each incremental positive measure of RV dysfunction (Figure 1a). Notably, this association was most pronounced for those with severe qRV dilatation (OR=15.3, p<0.001). Lack of inspiratory collapse of the inferior vena cava correlated with all measures of RV function (Table 2) and predicted improved RF (OR=6.5, p<0.001).
Figure 1.


Incidence of improved worsening RF by number of positive measures of RV dysfunction (A) Improved RF, defined as ≥ 25% increase in glomerular filtration rate (B) Worsening renal function, defined as an increase in serum creatinine ≥ 0.3 mg/dL. RF=renal function. RV= Right ventricle.
Worsening RF was significantly less common in those with RV dysfunction, occurring in 14.3% of those with versus 44.6% of those without cRV dysfunction (OR=0.21, p<0.001). The median decline in admission to nadir glomerular filtration rate was less in those with cRV dysfunction [−9.6% (0.0 to 19) vs. −15.6% (6.2 to 26), p=0.008]. Similar trends were found for the individual components of cRV dysfunction (qRV dysfunction OR=0.19, p<0.0001; qRV dilation OR=0.27, p=0.004; tricuspid annular plane systolic excursion OR=0.28, p=0.01; fractional area change OR=0.44, p=0.08), and the incidence of worsening RF decreased with each incremental positive measure of RV dysfunction (Figure 1b). Similarly, lack of inspiratory inferior vena cava collapse was associated with significantly less worsening RF (OR=0.26, p=0.028). Of the patients that developed worsening RF, recovery of RF to admission level was significantly more common in the group with cRV dysfunction (OR=5.5, p=0.03).
Using multivariate regression analysis, cRV dysfunction remained a significant predictor of change in glomerular filtration rate after controlling for heart rate, hemoglobin, admission blood urea nitrogen, B type natriuretic peptide level, diuretic dose, length of stay, ejection fraction, CO, tricuspid regurgitation severity, and inferior vena cava inspiratory collapse (p<0.003). Multivariate analysis of all individual measures of RV function demonstrated qRV dilation to be the only independent predictor for changes in renal function (p<0.001). Supporting venous congestion as the driving factor between RV dysfunction and RF, there was minimal improvement in model performance when inspiratory inferior vena cava collapse was added to a model containing qRV dilation (R2 change=0.018, p=0.08).
In the overall cohort, CO was not correlated with admission glomerular filtration rate (r=−0.06, p=0.48), admission to nadir change in glomerular filtration rate (r=−0.01, p=0.91), or change in glomerular filtration rate from admission to discharge (r=0.04, p=0.60). CO was similar amongst those with or without worsening RF (Table 3) (Figure 2a) or improved RF (4.6 ± 3.0 L/min vs. 4.6 ± 1.6 L/min, p=0.96). With the exception of qRV dilation (r=−0.02, p=0.87), all measures of RV dysfunction correlated with CO (tricuspid annular plane systolic excursion r=0.48, p<0.001; qRV function r=−0.36, p<0.001; fractional area change r=0.19, p=0.04). Cardiac output was lower in those with cRV dysfunction compared to those without (4.0 ± 1.7 L/min vs. 4.9 ± 1.8 L/min, p=0.007). The patients with cRV dysfunction who developed worsening RF had a significantly higher CO than those who did not (6.1 ± 2.4 L/min vs. 3.5 ± 1.1 L/min, p=0.03).
Table 3.
Baseline patient characteristics grouped by worsening renal function
| Variable | Worsening Renal Function | p Value | |
|---|---|---|---|
| No (n=93) | Yes (n=48) | ||
| Age (years) | 63 ± 17 | 60 ± 14 | 0.32 |
| African American | 73 (79%) | 36 (75%) | 0.64 |
| Male | 44 (47%) | 29 (60%) | 0.14 |
| Systolic blood pressure (mmHg) | 148 ± 33 | 147 ± 31 | 0.9 |
| Heart rate (beats per minute) | 82 ± 16 | 81 ± 16 | 0.63 |
| General medical service | 71 (77%) | 36 (75%) | 0.77 |
| Volume overload on chest X-ray | 44 (71%) | 24 (65%) | 0.53 |
| Hemoglobin (g/dL) | 12.2 ± 2.3 | 12.0 ± 1.9 | 0.55 |
| Detectable troponin I | 25 (27%) | 10 (21%) | 0.43 |
| Blood urea nitrogen (mg/dL) | 21 (15 to 29) | 21 (14 to 32) | 0.65 |
| Serum sodium (mg/dL) | 139.4 ± 5.5 | 138.9 ± 4.0 | 0.58 |
| Admission glomerular filtration rate (mL/min/1.73m2) | 68.5 ± 27.0 | 53.5 ± 26.6 | 0.002* |
| Admission serum creatinine (mg/dL) | 1.2 (1.0 to 1.5) | 1.3 (1.0 to 1.9) | 0.29 |
| B-type natriureetic peptide (pg/dL) | 1679 (924 to 2518) | 1368 (961 to 2925) | 0.92 |
| Maximum diuretic dose (mg/day) | 80 (80 to 160) | 120 (80 to 200) | 0.14 |
| Thiazide use | 10 (11%) | 9 (19%) | 0.19 |
| Net fluid out (L) | 3.9 (1.7 to 7.2) | 3.9 (0.5 to 5.3) | 0.23 |
| Length of stay (days) | 5 (3.5 to 6.5) | 5 (4.0 to 7.0) | 0.58 |
| Day peak creatinine (days) | 3 (2.0 to 4.0) | 4 (3.0 to 5.0) | 0.03* |
| Ejection fraction (%) | 25 (15 to 53) | 23 (15 to 40) | 0.85 |
| Early peak mitral inflow velocity/early peak annular tissue velocity (septal) | 19.0 ± 10.4 | 17.2 ± 8.5 | 0.34 |
| Early peak mitral inflow velocity/early peak annular tissue velocity (lateral) | 12.2 ± 6.8 | 12.5 ± 6.2 | 0.81 |
| Cardiac output (L/min) | 4.5 ± 1.9 | 4.7 ± 1.6 | 0.44 |
| Lack of inspiratory inferior vena cava collapse | 19 (20%) | 3 (6.3%) | 0.03* |
| Left atrial size (cm) | 4.9±0.7 | 4.6±0.7 | 0.1 |
| Moderate or severe right ventricle dilation | 35 (39%) | 7 (15%) | 0.004* |
| Moderate or severe right ventricle dysfunction | 50 (54%) | 9 (19)% | <0.001* |
| Right Ventricular fractional area change (%) | 28.6 (21.5 to 36.9) | 35.3 (26.0 to 41.9) | 0.007* |
| Tricuspid annular plane systolic excursion (cm) | 1.5 (1.2, 1.7) | 1.8 (1.4, 2.0) | 0.002* |
| Moderate or severe tricuspid regurgitation | 46 (50%) | 20 (42%) | 0.38 |
represents a significant p value.
Figure 2.
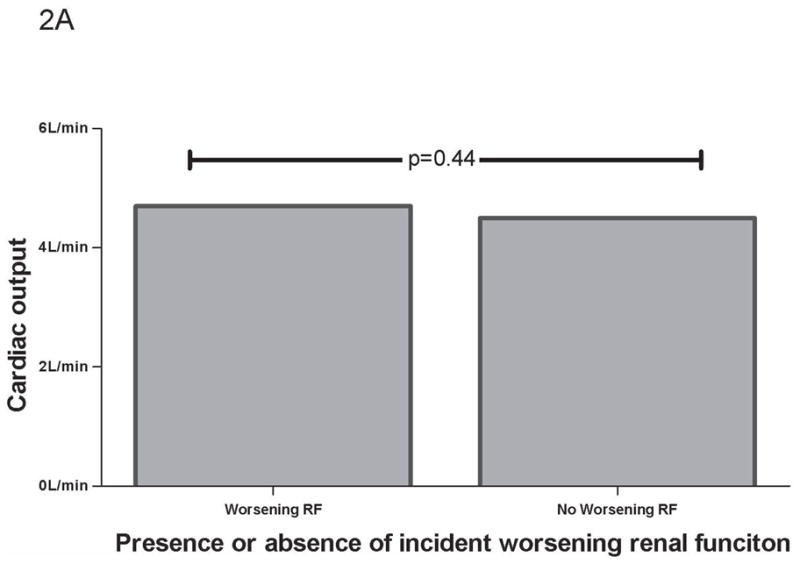
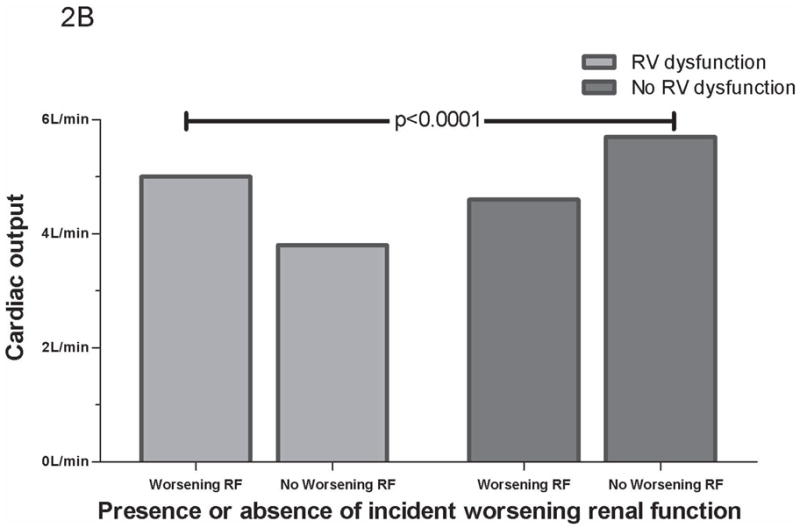
CO grouped by worsening RF. (A) CO grouped by worsening RF in total cohort. (B) CO grouped by worsening RF and RV dysfunction. No RV dysfunction defined as absence of any RV dysfunction measure correlating with CO (tricuspid annular plane systolic excursion, fractional area change, or qualitative RV dysfunction). p values represent between group differences. CO =cardiac output. RF=renal function. RV= Right ventricle.
Since poor RV function was predictive of both lower CO and improvements in RF, analysis of the group with preserved RV function was performed to explore the possibility that these associations might be masking the relationship between CO and renal function. In patients without cRV dysfunction, CO emerged as a significant predictor of change in glomerular filtration rate during hospitalization (r=0.38, p<0.001) with lower CO associated with larger reductions in glomerular filtration rate. Splitting the cohort into those with or without at least one measure of depressed RV function that correlated with CO (tricuspid annular plane systolic excursion, fractional area change, or qRV dysfunction) increased the strength of the correlation (r=0.50, p=<0.001). Using this dichotomy, in the group without RV dysfunction, mean CO was significantly lower in those developing worsening RF compared to those who did not (4.6 ± 1.2 L/min vs. 5.7 ± 2.2 L/min, p=0.03) (Figure 2b).
Discussion
The primary finding of this study is the strong association between RV dysfunction and changes in renal function during the treatment of acute decompensated HF. RV dysfunction predicted a substantially lower incidence of worsening RF and a higher occurrence of improved RF. These associations occurred despite overall worse indices of disease severity and persisted after adjustment for differences in baseline characteristics. This data is in agreement with our hypothesis that improved renal outcomes can be expected during diuresis of patients with RV dysfunction via relief of venous congestion. Additionally, they provide insight into the previously observed lack of correlation between CO and renal function in decompensated HF (11–13).
At first glance, the finding of superior renal outcomes in those with RV dysfunction may appear somewhat counter-intuitive given the powerful adverse prognostic significance of both worsening RF and RV dysfunction (1–7,14–18). This paradox is likely explained by the ability of venous congestion to adversely affect RF. The concept that venous congestion has a negative impact on RF has been well described in animal models. These models demonstrate rapid and profound decreases in renal blood flow, glomerular filtration rate, ultrafiltration coefficient, and increased sodium avidity after partial balloon occlusion or external compression of the renal veins, inferior vena cava, or the veins of specific abdominal organs (13,19–24). These effects are rapidly reversed with relief of the venous obstruction and can be significantly attenuated with alpha receptor blockade or denervation of the kidney (19–20,23–25). Additionally, recent reports have confirmed that venous congestion is a relevant factor influencing renal function in humans (12,26,27).
RV failure often leads to venous congestion and it is the relief of this congestion that likely drives the improvements in RF. This hypothesis is supported by the finding that the only RV function variable in multivariate analysis that independently predicted change in renal function was qRV dilation, a volumetric measure. Additionally, there was a strong association between changes in RF and inspiratory inferior vena cava collapse, a measure of venous congestion. Despite the strong association between inspiratory inferior vena cava collapse and renal outcomes, the addition of inferior vena cava collapse to a regression model including qRV dilation only produced a 1.8% incremental improvement in the predictive power of the model, implying that both of these variables describe the same physiologic derangement.
The lack of association between CO and RF in unselected heart failure populations has been previously described, but its explanation has yet to be elucidated (12,28). We obtained a similar lack of association when analyzing the cohort as a whole, however, when patients with RV dysfunction were removed from the analysis a correlation between CO and changes in RF emerged. Patients with incident worsening RF and no significant RV dysfunction had significantly lower mean CO whereas patients with RV dysfunction and worsening RF had higher mean CO (Figure 2b). The patients with the highest degree of RV dysfunction were the least likely to develop worsening RF, but also had the lowest CO. These associations may be secondary to the dominant effect of venous congestion in cardio renal interactions that overwhelms the influence of diminished CO when both factors are present. We submit that that the previously reported lack of association between low CO and worsening RF in unselected populations is due to a canceling effect mediated by patients with RV dysfunction, a group with decreased CO but a very low incidence of worsening RF. This point is illustrated in Figure 2 which demonstrates how combination of the groups with and without RV dysfunction (Figure 2a) essentially nullifies their discordant effects on worsening RF (Figure 2b).
The retrospective study design is a limiting factor in that bias can be introduced by either unavailable data sets or exclusion of patients without available data. Since all echocardiograms were obtained during routine clinical practice, RV echocardiographic images may not have been fully optimized. The fact that RV fractional area change requires the highest quality imaging window of the modalities employed may explain why we found the smallest effect size with this variable. The echocardiographic estimation of CO is subject to geometric assumptions and requires parallel Doppler alignment, both of which can introduce error. Although the assumption that venous congestion, on average, will be improved during the treatment of acute decompensated heart failure is probably sound, conformation of a reduction in venous congestion prior to discharge would be optimal. Inclusion of information related to changes in the medical regimen such as addition or withdrawal of angiotensin converting enzyme inhibitors would likely provide additional information. Additionally, the lack of data on long term outcomes deserves further study.
Acknowledgments
Funding sources: None
Footnotes
All authors report no conflicts of interest relevant to this work.
Publisher's Disclaimer: This is a PDF file of an unedited manuscript that has been accepted for publication. As a service to our customers we are providing this early version of the manuscript. The manuscript will undergo copyediting, typesetting, and review of the resulting proof before it is published in its final citable form. Please note that during the production process errors may be discovered which could affect the content, and all legal disclaimers that apply to the journal pertain.
References
- 1.Hosenpud JD, Greenberg BH. Congestive Heart Failure. 3. Philadelphia, PA: Lippincott Williams & Wilkins; 2007. p. 375. [Google Scholar]
- 2.Haddad F, Hunt SA, Rosenthal DN, Murphy DJ. Right ventricular function in cardiovascular disease, part I: Anatomy, physiology, aging, and functional assessment of the right ventricle. Circulation. 2008;117:1436–1448. doi: 10.1161/CIRCULATIONAHA.107.653576. [DOI] [PubMed] [Google Scholar]
- 3.Haddad F, Doyle R, Murphy DJ, Hunt SA. Right ventricular function in cardiovascular disease, part II: pathophysiology, clinical importance, and management of RV failure. Circulation. 2008;117:1717–1731. doi: 10.1161/CIRCULATIONAHA.107.653584. [DOI] [PubMed] [Google Scholar]
- 4.Kjaergaard J, Akkan D, Iversen KK, Køber L, Torp-Pedersen C, Hassager C. Right ventricular dysfunction as an independent predictor of short- and long-term mortality in patients with heart failure. Eur J Heart Fail. 2007;9:610–616. doi: 10.1016/j.ejheart.2007.03.001. [DOI] [PubMed] [Google Scholar]
- 5.Field ME, Solomon SD, Lewis EF, Kramer DB, Baughman KL, Stevenson LW, Tedrow UB. Right ventricular dysfunction and adverse outcome in patients with advanced heart failure. J Card Fail. 2006;12:616–620. doi: 10.1016/j.cardfail.2006.06.472. [DOI] [PubMed] [Google Scholar]
- 6.Meluzin J, Spinarova L, Hude P, Krejci J, Dusek L, Vitovec J, Panovsky R. Combined RV systolic and diastolic dysfunction represents a strong determinant of poor prognosis in patients with symptomatic heart failure. Int J Cardiol. 2005;105:164–173. doi: 10.1016/j.ijcard.2004.12.031. [DOI] [PubMed] [Google Scholar]
- 7.Gavazzi A, Berzuini C, Campana C, Inserra C, Ponzetta M, Sebastiani R, Ghio S, Recusani F. Value of RV ejection fraction in predicting short-term prognosis of patients with severe chronic heart failure. J Heart Lung Transplant. 1997;16:774–785. [PubMed] [Google Scholar]
- 8.Levey AS, Coresh J, Greene T, Stevens LA, Zhang YL, Hendriksen S, Kusek JW, Van Lente F. Using standardized serum creatinine values in the modification of diet in renal disease study equation for estimating glomerular filtration rate. Ann Intern Med. 2006;145:247–254. doi: 10.7326/0003-4819-145-4-200608150-00004. [DOI] [PubMed] [Google Scholar]
- 9.Gottlieb SS, Abraham W, Butler J, Forman DE, Loh E, Massie BM, O’connor CM, Rich MW, Stevenson LW, Young J, Krumholz HM. The prognostic importance of different definitions of worsening renal function in congestive heart failure. J Card Fail. 2002;8:136–141. doi: 10.1054/jcaf.2002.125289. [DOI] [PubMed] [Google Scholar]
- 10.Feigenbaum H, Armstrong WF, Ryan T. Feigenbaum’s Echocardiography. 6. Philadelphia, PA: Lippincott Williams & Wilkins; 2005. p. 218. [Google Scholar]
- 11.Nohria A, Hasselblad V, Stebbins A, Pauly DF, Fonarow GC, Shah M, Yancy CW, Califf RM, Stevenson LW, Hill JA. Cardiorenal interactions: insights from the ESCAPE trial. J Am Coll Cardiol. 2008;51:1268–1274. doi: 10.1016/j.jacc.2007.08.072. [DOI] [PubMed] [Google Scholar]
- 12.Mullens W, Abrahams Z, Francis GS, Sokos G, Taylor DO, Starling RC, Young JB, Tang WH. Importance of venous congestion for worsening of renal function in advanced decompensated heart failure. J Am Coll Cardiol. 2009;53:589–596. doi: 10.1016/j.jacc.2008.05.068. [DOI] [PMC free article] [PubMed] [Google Scholar]
- 13.Doty JM, Saggi BH, Sugerman HJ, Blocher CR, Pin R, Fakhry I, Gehr TW, Sica DA. Effect of increased renal venous pressure on renal function. J Trauma. 1999;47:1000–1003. doi: 10.1097/00005373-199912000-00002. [DOI] [PubMed] [Google Scholar]
- 14.Akhter MW, Aronson D, Bitar F, Khan S, Singh H, Singh RP, Burger AJ, Elkayam U. Effect of elevated admission serum creatinine and its worsening on outcome in hospitalized patients with decompensated heart failure. Am J Cardiol. 2004;94:957–960. doi: 10.1016/j.amjcard.2004.06.041. [DOI] [PubMed] [Google Scholar]
- 15.Forman DE, Butler J, Wang Y, Abraham WT, O’Connor CM, Gottlieb SS, Loh E, Massie BM, Rich MW, Stevenson LW, Young JB, Krumholz HM. Incidence, predictors at admission, and impact of worsening renal function among patients hospitalized with heart failure. J Am Coll Cardiol. 2004;43:61–67. doi: 10.1016/j.jacc.2003.07.031. [DOI] [PubMed] [Google Scholar]
- 16.Damman K, Navis G, Voors AA, Asselbergs FW, Smilde TD, Cleland JG, van Veldhuisen DJ, Hillege HL. Worsening renal function and prognosis in heart failure: systematic review and meta-analysis. J Card Fail. 2007;13:599–608. doi: 10.1016/j.cardfail.2007.04.008. [DOI] [PubMed] [Google Scholar]
- 17.Cowie MR, Komajda M, Murray-Thomas T, Underwood J, Ticho B POSH Investigators. Prevalence and impact of worsening renal function in patients hospitalized with decompensated heart failure: results of the prospective outcomes study in heart failure (POSH) Eur Heart J. 2006;27:1216–1222. doi: 10.1093/eurheartj/ehi859. [DOI] [PubMed] [Google Scholar]
- 18.Butler J, Forman DE, Abraham WT, Gottlieb SS, Loh E, Massie BM, O’Connor CM, Rich MW, Stevenson LW, Wang Y, Young JB, Krumholz HM. Relationship between heart failure treatment and development of worsening renal function among hospitalized patients. Am Heart J. 2004;47:331–338. doi: 10.1016/j.ahj.2003.08.012. [DOI] [PubMed] [Google Scholar]
- 19.Abildgaard U, Amtorp O, Holstein-Rathlou NH, Agerskov K, Sjontoft E, Christensen NJ, Leyssac PP. Effect of renal venous pressure elevation on tubular sodium and water reabsorption in the dog kidney. Acta Physiol Scand. 1988;132:135–142. doi: 10.1111/j.1748-1716.1988.tb08310.x. [DOI] [PubMed] [Google Scholar]
- 20.Abildgaard U, Amtorp O, Agerskov K, Sjøntoft E, Christensen NJ, Henriksen O. Renal vascular adjustments to partial renal venous obstruction in dog kidney. Circ Res. 1987;61:194–202. doi: 10.1161/01.res.61.2.194. [DOI] [PubMed] [Google Scholar]
- 21.Dilley JR, Corradi A, Arendshorst WJ. Glomerular ultrafiltration dynamics during increased renal venous pressure. Am J Physiol. 1983;244:F650–F658. doi: 10.1152/ajprenal.1983.244.6.F650. [DOI] [PubMed] [Google Scholar]
- 22.Kishimoto T, Maekawa M, Miyazaki M, Yamamoto K, Ueda J. Effects of renal venous pressure elevation on renal hemodynamics, urine formation and renin release. Jpn Circ J. 1972;36:439–448. doi: 10.1253/jcj.36.439. [DOI] [PubMed] [Google Scholar]
- 23.Firth JD, Raine AE, Ledingham JG. Raised venous pressure: a direct cause of renal sodium retention in oedema? Lancet. 1988;1:1033–1035. doi: 10.1016/s0140-6736(88)91851-x. [DOI] [PubMed] [Google Scholar]
- 24.Hamza SM, Kaufman S. Splenorenal reflex modulates renal blood flow in the rat. J Physiol. 2004;558:277–282. doi: 10.1113/jphysiol.2004.063362. [DOI] [PMC free article] [PubMed] [Google Scholar]
- 25.Hamza SM, Kaufman S. Effect of mesenteric vascular congestion on reflex control of renal blood flow. Am J Physiol Regul Integr Comp Physiol. 2007;293:R1917–R1922. doi: 10.1152/ajpregu.00180.2007. [DOI] [PubMed] [Google Scholar]
- 26.Damman K, Navis G, Smilde TD, Voors AA, van der Bij W, van Veldhuisen DJ, Hillege HL. Decreased CO, venous congestion and the association with renal impairment in patients with cardiac dysfunction. Eur J Heart Fail. 2007;9:872–878. doi: 10.1016/j.ejheart.2007.05.010. [DOI] [PubMed] [Google Scholar]
- 27.Damman K, van Deursen VM, Navis G, Voors AA, van Veldhuisen DJ, Hillege HL. Increased central venous pressure is associated with impaired renal function and mortality in a broad spectrum of patients with cardiovascular disease. J Am Coll Cardiol. 2009;53:582–588. doi: 10.1016/j.jacc.2008.08.080. [DOI] [PubMed] [Google Scholar]
- 28.Lautt WW. Regulatory processes interacting to maintain hepatic blood flow constancy: Vascular compliance, hepatic arterial buffer response, hepatorenal reflex, liver regeneration, escape from vasoconstriction. Hepatol Res. 2007;37:891–903. doi: 10.1111/j.1872-034X.2007.00148.x. [DOI] [PMC free article] [PubMed] [Google Scholar]