

Abstract
A combined MS and MS/MS approach implemented with MALDI FT-ICR MS in the negative ion mode is described for enhanced glycopeptide detection and MS/MS analysis. Positive ion mode mass spectrometry (MS) analysis is widely used for glycopeptide characterization, but the analyses are hampered by potential charge-induced fragmentation of the glycopeptides and poor detection of the glycopeptides harboring sialic acids. Furthermore, tandem MS analysis (MS/MS) via collision-induced dissociation (CID) of glycopeptides in the positive ion mode predominantly yields glycan fragmentation with minimal information to verify the connecting peptide moiety. In this study, glycoproteins such as, bovine lactoferrin (b-LF) for N-glycosylation and kappa casein (k-CN) for O-glycosylation were analyzed in both the positive- and negative ion modes after digestion with bead-immobilized pronase. For the b-LF analysis, 44 potential N-linked glycopeptides were detected in the positive ion mode while 61 potential N-linked glycopeptides were detected in the negative ion mode. By the same token, more O-linked glycopeptides mainly harboring sialic acids from k-CN were detected in the negative ion mode. The enhanced glycopeptide detection allowed improved site-specific analysis of protein glycosylation and superior to positive ion mode detection. Overall, the negative ion mode approach is aimed towards enhanced N- and O-linked glycopeptide detection and to serve as a complementary tool to the positive ion mode MS/MS analysis.
INTRODUCTION
Glycosylation is one of the most ubiquitous forms of post-translational modifications of proteins and involves the enzymatic attachment of glycans to asparagine (N-glycans) and serine or threonine (O-glycans).1 Glycosylation has vital roles in protein-folding 2,3, protein stability 4, cell-cell recognition 3,4, immune system 5, protection of proteins from proteolytic degradation 4,6,7 and protein activity.4,8 With over 50% of all human proteins being potentially glycosylated 1,9 and that abnormal protein glycosylation can lead to protein malfunction in diseases, there is the need for better characterization of glycosylation in proteins. Glycoprotein analyses have been significantly hindered by the complicated nature of the glycan structures. The monosaccharide residues can attach to each other in multiple ways resulting in various linkages and branched isomers. Although several related glycan structures are typically found in glycoproteins, the glycans differ in their sizes, linkages, antennary, and branching. Attempts towards glycosylation analyses of proteins have yielded only limited information with the use of techniques such as gel electrophoresis 10, nuclear magnetic resonance (NMR) 11, x-ray crystallography 12 and liquid chromatography (LC).13 However, mass spectrometry-based (MS) methods have proven to be the most promising.9 Significant results have been achieved by analyzing (i) the intact glycoprotein (top-down glycoproteomic approach) 14,15, (ii) tryptic digests (bottom-up glycoproteomic approach) 16,17 and (iii) non-specific protease digestion with pronase.16,18,19
Top-down methods are impractical for glycoproteomics analysis.20,21 Enrichment of all the different glycoforms, if even possible, can take considerable effort. Furthermore, the differences in ionization efficiencies between sialylated, multi-sialylated, and asialylated glycoforms would make extensive characterization an imposing challenge. Bottom-up approaches using tryptic digestion provide only partial information. Tryptic digestion yields primarily unglycosylated peptides that tend to suppress glycopeptide signals. Furthermore, glycosylation decreases the ionization efficiencies of the glycopeptide compared to non-glycosylated peptides.22 A similarly severe problem is that glycosylation protects the peptide backbone from digestion yielding glycopeptides that do not fully represent the glycan heterogeneity.16
To address the lack of effectiveness with using trypsin, a cocktail of enzymes has been used to produce essentially pure glycopeptide mixtures of varying lengths.9,23,24 Due to steric hindrance from the glycan moieties, short peptide segments (the glycan footprint) surrounding the site of glycosylation are obtained and can be used to determine glycan micro-heterogeneity at specific sites even in mixtures of proteins. Site-specific glycosylation information is obtained employing only high performance mass spectrometry.9 By immobilizing the enzymes on beads, sample clean-up is eliminated considerably streamlining the process.23,24
Glycopeptide foot-printing is commonly performed in the positive ion mode. The mass spectra of these mixtures yield strong signals but is complicated by a number of factors. The quasi-molecular ion is often partitioned into protonated, sodiated, and mixtures of both depending on the charge states and the presence of sialic acids. The different quasi-molecular ions have distinct ionization efficiencies that often produce varying signals even when their concentrations are equivalent. Furthermore, positive ion mode MS/MS analyses tend to favor dissociation of the more labile glycosidic bonds rather than the peptide bonds yielding primarily glycan information with little or no peptide information.
Negative ion analysis of glycopeptides has been relatively little explored and performed on a few model peptides with little or no effort at obtaining extensive glycan heterogeneity. Deguchi et al. reported the examining of two synthetic glycopeptides.25 CID yielded information regarding the glycan structure, while electron capture dissociation in the negative mode yielded peptide sequence as well as the site of glycosylation. A second report by Deguchi et al. employing MS2 and MS3 on a selected N-glycopeptide from chicken egg yolk showed positive and negative tandem yield complementary information with the positive mode yielding peptide information as well as site-specific information, while the negative mode yielded information on sialylated glycopeptides.26
This study describes the MS and MS/MS of glycopeptides from native glycoproteins in the negative ion mode. The negative mode does have intrinsic advantages over the positive mode. The C-terminus is an acidic group that will likely contain the charge. Therefore, there is no discrimination between sialylated and neutral glycans. In addition, fragmentation in the negative mode appears to produce both glycan and peptide fragmentation as we will show below. We will also show for the first time that extensive site-specific analysis of N- and O-glycans is readily performed in the negative mode. Furthermore, we find that the negative mode minimizes charged-induced fragmentation, thereby yielding simultaneous glycan and peptide structural information for both N- and O-glycans in a single tandem MS event. This capability along with the use of a non-specific enzyme for proteolysis provides conclusive glycosite assignments in glycoproteins with significant glycan heterogeneity. Negative mode MS is a viable alternative to positive mode MS analysis of glycopeptides.
MATERIALS AND METHODS
Materials and chemicals
Pronase E proteases, cyanogen bromide (CNBr) activated sepharose 4B (S4B) beads, bovine milk lactoferrin and kappa casein were all obtained from Sigma Aldrich (St. Louis, MO). 2,5-Dihydroxylbenzoic acid (DHB) was also acquired from Sigma and used without further purification. Graphitized carbon cartridges were purchased from Grace Davison Discovery Sciences (Deerfield, IL). All chemicals used were either of analytical grade or better.
Pronase immobilization
CNBr activated sepharose beads of 40 – 165 μm diameter were covalently coupled to the Pronase E via well-established coupling chemistry.27 The actual immobilization of the pronase enzyme to the sepharose beads was achieved using a scaled-up version of the protocol earlier reported by Seipert et al.23,24 In this particular study, 150 mg of the lyophilized S4B beads were coupled to 1 mg pronase prior to the glycoprotein digestion.
Glycoprotein digestion
Bovine milk glycoproteins (lactoferrin and kappa casein) were digested with the bead-immobilized pronase. Prior to the digestion, the individual milk glycoprotein solution was made by dissolving 1 mg of the glycoprotein in 250 μL ammonium acetate (NH4OAc) buffer and 50 μL deionized water. These glycoprotein solutions were then individually mixed with the pronase-beads. Once mixed together, the digestion mixtures in screw cap tubes were transferred onto an oven at 37°C to allow for a 24 hour digestion with gentle agitation. The resultant glycopeptide digest was carefully drawn out prior to desalting and enrichment via solid phase extraction (SPE) using graphitized carbon cartridges (GCC) as earlier described in our group.16 In this study, a clean mixture of glycopeptides were then eluted with 0.05% TFA in 40% acetonitrile (ACN) in water (v/v) followed by vacuum drying using a Centrivap Concentrator (Labconco Corp, Kansas City, MO) prior to mass spectral analysis.
Mass spectrometry (MS) and tandem mass spectrometry (MS/MS) analyses
Glycopeptide fractions enriched by GCC were completely dried in a speed vac, reconstituted in 20 μL of deionized water and were ready for MS analysis without further treatment. Glycopeptide stock solutions (0.75 μL) were individually spotted on a stainless steel MALDI target with each spot mixed with an equal volume (0.75 μL) of DHB matrix solution made up of 0.05 mg/mL DHB in 50% ACN: 50% water. The glycopeptide-DHB spots were then allowed to dry prior to the actual MS analyses. In this study, an IonSpec HiRes MALDI FT-ICR mass spectrometer (Lake Forest, CA) equipped with an external ion source based on a third harmonic Nd:YAG laser (355 nm) and a 7.0 Tesla actively shielded superconducting magnet, served as the platform for all the experiments described herein. Glycopeptides were analyzed with the MALDI FT-ICR MS instrument in both the positive- and negative ion modes.
Tandem MS analysis was achieved via collision-induced dissociation (CID). Prior to performing CID, it is important that the ion of interest is isolated in the ICR cell so as not to convolute the data generated via the CID process. This isolation event is then followed by an introduction of a pulse of nitrogen gas into the ICR cell to collisionally activate the isolated ions. Once obtained, the mass spectra were externally calibrated using a series of maltooligosaccharides as previously described.28 The calibrated mass spectra were thresholded, deconvoluted, and deisotoped using the IonSpec PeakHunter software package. The resulting mass list was then exported for further analysis with the glycopeptide finder (GP finder) with the aim of assigning the various masses to potential glycopeptide identities. Further verification of the GP finder assignments were achieved by tandem mass spectrometry via CID experiments of some selected glycopeptides.
Glycopeptide finder analysis
The mass list from each mass spectrum was analyzed against a GP finder for potential glycopeptide assignments. The GP finder is an in-house software application written in Java as a continuation of the previously developed GlycoX, 29 offering several new features including: biological filters to reduce false-positive hits, support for protein mixture analysis, faster run-time, and a significantly improved user interface. The GP finder identifies the ions that could potentially be glycopeptides based on their mass-to-charge (m/z) values and calculates all the possible compositions for each mass (including glycan composition, peptide sequence and glycosites). The primary algorithm performs an in-silico digest of the proteins identified by the user and determines all the possible peptide and sugar compositions that could account for the observed mass from the MS analyses.
The first step in the algorithm is to calculate the masses of all the peptides around each glycosite. The next step is to calculate the remainder masses after each theoretical peptide mass is subtracted from each experimental mass. The remainder masses are the potential carbohydrate masses. The last step determines the remainder masses that are potential sugars and finally stores the associated experimental masses as potential glycopeptides. The software accepts various parameters to limit the potential hits such as a mass error tolerance and predefined sugar compositions. In this study, potential glycopeptide assignments from the GP finder analysis were made based on accurate mass measurements (< 10 ppm mass error tolerance) with some selected glycopeptide identifications verified by tandem mass spectrometry.
RESULTS AND DISCUSSION
MS analysis of N-glycopeptides
Bovine lactoferrin (b-LF) is a 78 kDa glycoprotein (UniportKB/Swiss-Port P24627) and an important component of bovine milk. It is N-glycosylated 30 with five potential sites based on the consensus sequence at 252Asn, 300Asn, 387Asn, 495Asn and 564Asn. Figure 1a shows the MALDI FT-ICR MS spectrum of b-LF glycopeptides after digestion with pronase in the negative ion mode (Table S-1, supplementary information). The inverted triangles (▼) indicate potential b-LF glycopeptides as determined strictly by accurate mass. In the negative ion mode, the detected glycopeptides are observed as the deprotonated species [M−H]−. The deprotonated specie is an advantage as all peptides, and hence glycopeptides contain a carboxylic acid group that is readily deprotonated during ionization. Furthermore, the carboxylic acid on the C-terminus of glycopeptides has relatively similar ionization efficiencies. Figure 1b shows the positive ion mode MS analysis of b-LF glycopeptides with the inverted triangles (▼) indicating glycopeptides as determined by mass (Table S-2, supplementary information). The spectrum is complicated by non-glycopeptide peaks (represented as filled circles) that were identified as glycan fragments. Under certain conditions, we find that these glycan fragments can dominate a spectrum. Source fragmentation of glycopeptides have previously been shown in the positive mode to occur due to labile glycosidic linkages.31 However, under no conditions were glycan fragment ions observed in the negative ion mode analysis. Glycan fragmentation can be minimized in the positive ion mode; however, when present they complicate the spectra and may even suppress the glycopeptide ions thereby decreasing the total number of glycopeptides in the spectra.
Figure 1.
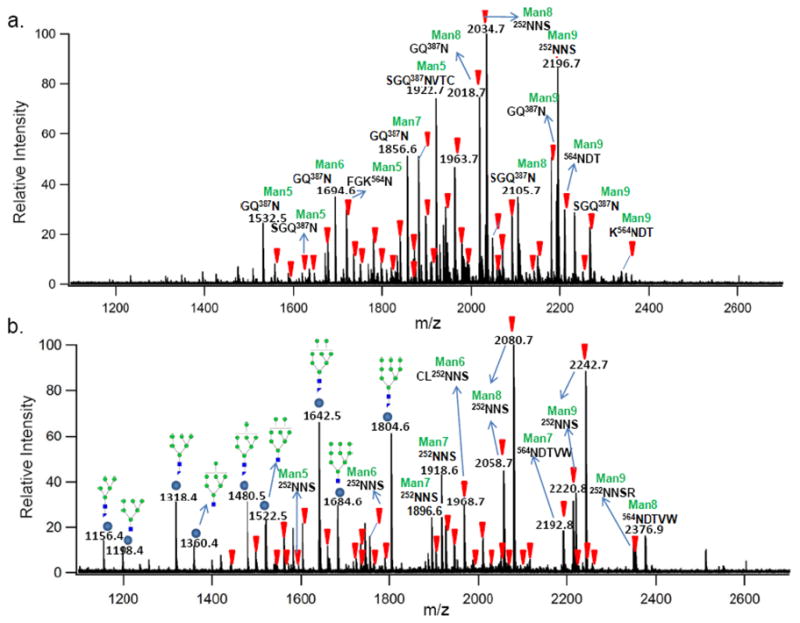
(a) Negative ion mode MALDI FT ICR MS spectrum of b-LF glycopeptides after 24 hrs immobilized pronase digestion. (b) Positive ion mode MS spectrum of the same b-LF glycopeptide sample. Inverted triangles ( ) represent potential glycopeptide peaks labeled based on the GP finder analysis of the spectrum mass list, and circles (
 ) indicate dissociated glycan peaks.
Another complicating factor in positive ion analysis is the partitioning of the molecular ions into several species such as protonated [M + H]+, sodiated [M + Na]+ and even di-sodiated [M − H + 2Na]+ ions. It is important to note that the base peak ion in Figure 1b with m/z 2080.68 Da corresponds to the di-sodiated specie of the base peak ion in Figure 1a with m/z 2034.70 Da. Similarly, the ion with m/z 2242.73 Da in Figure 1b is the di-sodiated specie of the ion with m/z 2196.75 Da in Figure 1a. The multiple ionized species in the positive ion mode lead to mis-assignments. This was not an issue during the analysis of the negative ion mode spectrum where the majority of the glycopeptide ions were deprotonated.
A clear advantage of the negative mode is in the total number of detected glycopeptides. A careful analysis of all the peaks in Figure 1 yielded 61 potential b-LF glycopeptides in the negative ion mode while only 44 potential glycopeptides in the positive ion mode or an increase of 28%. All five potential b-LF glycosites were readily observed in both detection modes, with diverse glycosylation forms, a phenomenon known as glycan micro-heterogeneity, being well characterized. The b-LF glycopeptide results revealed that most of the glycans occupying the various glycosites are high-mannose type N-glycans.
MS/MS analysis of N-glycopeptides
Fragmentation behavior of N-linked glycopeptides from pronase have previously been reported from our laboratory by Seipert et al. 23 This earlier MS/MS study was carried out in the positive ion mode via infrared multiphoton dissociation (IRMPD) on ions produced by nano-electrospray ionization. In summary, Seipert observed that the fragmentation of N-linked glycopeptides via IRMPD was dependent upon the charge carrier, charge state and peptide composition of the glycopeptide ion. Precisely, the result revealed that while the singly protonated glycopeptide ions containing basic amino acid residues yielded mainly peptide fragmentations, the sodium coordinated species yielded glycosidic bond cleavages.
In the current study, the MS/MS analysis of the glycopeptides was obtained to determine their behavior via MALDI-MS and collision induced dissociation (CID) in both the negative- and positive ion modes for direct comparison and to verify the structural assignments that are based on mass. Figure 2a shows a representative negative ion mode MS/MS spectrum. The selected ion with m/z 2034.70 Da corresponds in mass to [252NNS + GlcNAc2 + Man8 − H]−. A b2 ion is observed arising from the loss of 105 Da corresponding to the C-terminal loss of a serine residue (serine + H2O). For clarity, peptide fragment nomenclature will be in lower case letters, while oligosaccharide fragment nomenclature will be upper-cased. A B6 ion from a neutral loss of 477 Da is attributed to a combination of losses including a mannose residue (162 Da), two asparagine residues (228 Da) and one serine residue (87 Da). Additional fragments include a B5 ion due to the neutral loss of a GlcNAc residue (203 Da) and two Yx5 fragments from the neutral losses of mannose residues (162 Da).
Figure 2.

(a) Negative ion mode MALDI FT ICR MS/MS spectrum of precursor ion with m/z 2034.70 Da assigned as [252NNS + GlcNAc2 + Man8 − H]−. (b) Positive ion mode MS/MS spectrum of corresponding sodiated peak with m/z 2058.68 Da assigned as [252NNS + GlcNAc2 + Man8 + Na]+. (c) Positive ion mode MS/MS spectrum of a di-sodiated peak with m/z 2080.68 Da assigned as [252NNS + GlcNAc2 + Man8 − H + 2Na]+. Circles ( ) and squares (
 ) represent mannose and GlcNAc residues, respectively.
Figure 2b shows the positive ion mode MS/MS spectrum for the ion with m/z 2058.68 Da corresponding in mass to [252NNS + GlcNAc2 + Man8 + Na]+. The results revealed a B5 ion from a combined 536 Da loss of the entire “NNS” peptide moiety (333 Da) with the connecting GlcNAc (203 Da). The entire peptide loss was the only peptide information obtained in this positive ion mode analysis as no fragmentation involving peptide bonds was observed. In this regard, the negative and positive mode analyses are complementary. The negative ion mode yields peptide bond cleavages while the positive mode yields primarily glycan bond cleavages. Furthermore, glycan cross-ring cleavages were also observed in the positive ion mode MS/MS analysis. A 0,2A6 ion was observed resulting from the combined loss of the entire “NNS” peptide moiety with 101 Da loss from a portion of the connecting GlcNAc residue. A 2,4 A6 ion was also observed involving the neutral loss of the entire “NNS” peptide and 161 Da from the connecting GlcNAc residue. The presence of the two fragments describes the 1, 4-linkage in the chitobiose core.32 In addition to these fragmentations, Yx4 ions were observed from the losses of several mannose residues (162 Da).
For further comparison, Figure 2c shows the positive ion MS/MS spectrum of the di-sodiated ion with m/z 2080.66 corresponding in mass to [252NNS + GlcNAc2 + Man8 − H + 2Na]+. The spectrum reveals very similar fragment ions compared to the monosodium species with the major difference being the addition of 23 Da when the entire peptide moiety is lost. The di-sodiated [M − H + 2Na]+ species of the b-LF glycopeptides likely arise from the exchange of the C-terminus carboxylic acid proton with a sodium. For completeness, the glycan fragments were also probed by tandem MS. The dominant ion m/z 1804.41 Da was verified by MS/MS to be only glycan residues with no peptide moieties. The resulting fragment ions corresponded only to combinations of glycosidic bond and minor cross-ring cleavages.
Extensive fragmentation of the glycopeptides in the negative mode yield informative fragment ions regardless of the glycans. Figure 3 shows another example in the negative ion mode MS/MS spectrum of the Man9 ion in Figure 2a with m/z 2196.75 Da [252NNS + GlcNAc2 + Man9 − H]−. This glycopeptide belongs to the same site with the same peptide but a different glycoform corresponding to Man9 as opposed to the Man8 in the previous example. However, analogous fragments are observed except for the neutral loss of 17 Da, which was assigned to the loss of an ammonia molecule from the peptide moiety in Figure 2a. It is important to note that the negative MS/MS spectra yielded dominant peptide fragment ions in both examples, particularly the loss of the serine, which confirmed the peptide sequence with the serine residue being the C-terminus.
Figure 3.

Negative ion mode MALDI FT ICR MS/MS spectrum of precursor ion with m/z 2196.75 Da assigned as [252NNS + GlcNAc2 + Man9 − H]−.
MS analysis of O-glycopeptides
Analysis of O-glycosylation sites is significantly more complicated than N-glycosylation due to the lack of consensus sequence in O-glycosylation. Bovine kappa casein (k-CN) is a small 21 KDa (UniportKB/Swiss-Port P02668) and highly sialylated glycoprotein also found in bovine milk. Digestion of the glycoprotein using immobilized pronase yielded a significant amount of glycopeptides. Previous study on the O-glycosylation of kappa casein glycoforms employed a combination of two-dimensional gel electrophoretic separation and MS analysis. It revealed that each potential k-CN glycosite can only have a maximum of one N-acetylgalactosamine unit (GalNAc) and one galactose (Gal) unit, which could further be decorated with one or two N-acetylneuraminic acid (NeuAc) unit(s) either linked to the GalNAc or Gal.33 Results from our study are in agreement with these earlier findings.
Figure 4a shows the spectrum from the negative MS analysis of the K-CN glycopeptides (inverted triangles ▼ represent potential glycopeptide peaks). Analyses of the peaks indicate that all of the anionic glycopeptides were observed as the deprotonated specie [M − H]−. A significant number of the glycopeptides contains sialylated glycans (Table S-3, supplementary information). Particularly revealing is the detection of multiple glycosites with multiple sialylation suggesting that the negative mode is the ideal condition for detecting sialylated glycopeptides. In this particular analysis, three sialic acid (NeuAc) units were assigned to one glycopeptide ion with m/z 2390.89 Da corresponding in mass to [GEP152TS154TPT + GaNAc2 + Gal2 + NeuAc3 − H]−. Since this glycopeptide has two GalNAc and two galactose units, it is presumed to be di-glycosylated with one NeuAc unit attached to one of the GalNAc1Gal1 glycan moiety and with the other two NeuAc units attached to the second GlcNAc1Gal1 glycan moiety. This glycopeptide is unique because the tri-sialylated glycans at these sites were not observed in a previously comprehensive study on K-CN glycosylation performed by Alewood and coworkers.33
Figure 4.

(a) Negative ion mode MALDI FT ICR MS spectrum of k-CN glycopeptides after 24 hrs of reaction with immobilized pronase digestion. (b) Positive ion mode MS spectrum of k-CN glycopeptides from the same sample. Inverted triangles () represent potential glycopeptide peaks labeled based on the GP finder analysis of the spectrum mass list. Rectangles ( ), circles (
 ) and diamond symbols (
 ) represent GalNAc, Gal and NeuAc residues, respectively.
Figure 4b shows the positive ion MS spectrum of the k-CN glycopeptides with the inverted triangles (▼) indicating potential glycopeptides. Again, some of the glycopeptides observed in this mode contained multiple cationized species including protonated, sodiated and di-sodiated (Table S-4, supplementary information). Examples include m/z 1154.50 Da (protonated), m/z 1176.47 Da (sodiated) and m/z 1198.46 Da (di-sodiated) for the glycopeptide corresponding to [GEP152TSTPT + GaNAc1 + Gal1].
Fewer sialylated glycopeptides were observed in the positive ion mode analysis when compared to the number of sialylated glycopeptides observed in the negative ion mode. In the positive ion mode MS analysis, 31 k-CN glycopeptides were obtained compared to 38 glycopeptides obtained in the negative ion mode. Furthermore, while 19 sialylated glycopeptides were observed in the positive ion mode MS analysis, 31 sialylated glycopeptides were observed in the negative ion mode with several glycopeptides being multiply sialylated. The negative ion MS analysis was superior particularly for the detection of multiply sialylated k-CN glycopeptides. The tri-sialylated glycopeptide [GEP152TS154TPT + GalNAc2 + Gal2 + NeuAc3] was observed in the negative mode but not in the positive mode. Five k-CN glycosites at 142Thr, 152Thr, 154Thr, 163Thr and 186Thr were observed with glycan micro-heterogeneity at each site. Overall, the negative ion mode MS analysis of the k-CN glycopeptides resulted in an improvement in the number of detected glycopeptides.
MS/MS analysis of O-glycopeptides
Many of the k-CN glycopeptide assignments (Figure 4a and 4b) made in both the negative- and positive- ion modes were verified with MS/MS analyses. Figure 5a illustrates the typical behavior of O-glycopeptides in the negative ion MS/MS spectrum with the precursor ion with m/z 1517.61 Da corresponding in mass to [GEPT152ST154PT + GalNAc2 + Gal2 − H]−. The spectrum revealed dominant peptide fragmentation as evidenced by b7, b4 and y6 ions. For these glycopeptides, fragmentation of the disaccharide moieties was not observed despite the occupancy of the two glycosites (152Thr and 154Thr) with the GalNAc1Gal1 in each site. Figure 5b shows the result of the MS/MS in the positive ion mode for the m/z 1541.61, which, corresponds to the same peptide in Figure 5a. The spectrum has a generally poorer signal to noise due to the poorer precursor ion abundance. The spectrum shows primarily glycosidic bond cleaves such as the Y1 ions due to the loss of the galactose residues (162 Da) and the Y0 ions due to the loss of the GalNAc residues (203 Da). A single peptide fragment is observed corresponding to a y6 ion from the loss of 186 Da, a dipeptide [glycine (57 Da) + glutamic acid (129 Da)]. In both spectra (Figure 5a and 5b), the 186 Da dipeptide loss is presumed to be induced by a phenomenon known as “proline effect”.34 This effect increased the tendency to observe cleavages of the amide bond towards the N-terminus of proline.
Figure 5.

(a) Negative ion mode MALDI FT ICR MS/MS spectrum of a k-CN glycopeptide with m/z 1517.61 Da assigned as [GEP152TS154TPT + GalNAc2 + Gal2 − H]−. (b) Positive ion mode MS/MS spectrum of the same glycopeptide with m/z 1541.61 Da and assigned as (GEP152TS154TPT + GalNAc2 + Gal2 + Na)+. Rectangles () and circles () represent GalNAc and Gal residues, respectively.
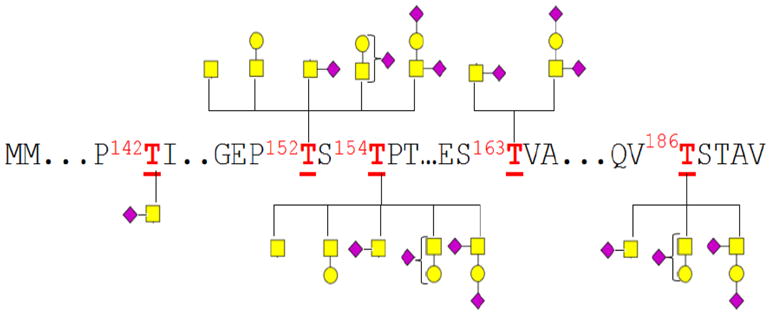
Glycan micro-heterogeneity analysis
Attempts towards site-specific glycosylation and glycan micro-heterogeneity are facilitated by a number of the features unique to the negative mode. They include: the lack of fragment ions and the minimization of suppression effects due to differential ionization efficiencies and fragment ions. Figure 6 shows the glycosylation associated with each glycosite for the b-LF glycoprotein. The glycans associated with b-LF are shown with the high-mannose type being the most prevalent, however fucosylated complex type are also observed (Table S-1). More detailed analysis shows that 252Asn, 387Asn and 495Asn are the most glycosylated sites on the b-LF glycoprotein as they yielded the most number of glycopeptides. Conversely, 564Asn and 300Asn were less glycosylated with significantly fewer glycopeptide products. The larger structures correspond to major glycan species (>20% relative abundances), while the smaller structures correspond to minor species.
Figure 6.

Glycosylation associated with each glycosite of bovine lactoferrin (b-LF). The various glycans at each site indicate glycan micro-heterogeneity in the occupancy of the five glycosites observed during the negative ion mode MS analysis of the b-LF glycopeptides. For each glycosite, the larger glycan structures represent corresponding glycopeptides with minimum relative intensities of 20% while the smaller glycan structures represent corresponding glycopeptides with relative intensities corresponding to less than 20%. Circles ( and ), squares () and triangles ( ) represent hexose, GlcNAc and fucose residues, respectively.
Figure 7 shows the glycosylation associated with each k-CN glycosite. For k-CN, glycans are only O-linked with small glycan moieties that are primarily sialylated (Figure 4a, Table S-3). This detailed study of the k-CN glycosylation profile reveals that 152Thr and 154Thr glycosites are the most highly glycosylated as all observed glycan types were found associated with these two sites. There is ambiguity in some assignments due to overlap of the 152Thr and 154Thr sites, although glycans associated with the other sites are distinct. Sites 142Thr, 163Thr, and 186Thr are only slightly glycosylated corresponding to 1, 2 and 3 associated glycan(s), respectively.
Figure 7.
Glycosylation associated with each glycosite of kappa casein (k-CN). The various glycans at each site indicate glycan micro-heterogeneity in the occupancy of the five glycosites observed during the negative ion mode MS analysis of the k-CN glycopeptides. Rectangles (), circles () and diamond symbols () represent GalNAc, Gal and NeuAc residues, respectively.
CONCLUSION
MS analysis of glycopeptides in the negative mode provides a unique platform for the rapid analysis of site-specific glycosylation. The negative mode minimizes a number of complications observed in the positive mode, making assignments of the observed glycopeptides a lot easier. It is noteworthy that the peptide lengths of N-linked glycopeptides produced by pronase digestion were generally smaller than those of the O-linked glycopeptides. This trend could be due to the nature of the interaction between the glycan and the peptide backbone. O-glycans lay closer to the peptide backbone and protect the polypeptide from enzymatic digestion. N-glycans rise above the peptide backbone exposing the polypeptide to enzymatic digestion. For this reason, mucins that line epithelial cells protecting them from proteases are mainly O-glycans.
Tandem MS fragmentation of the glycopeptide depends on several issues including the polarity of detection (positive vs. negative ion modes) and the types of glycans (N- linked vs. O-linked glycopeptides). Both positive- and negative- mode MS/MS analyses yield complementary information. However, the negative mode has some unique advantages including an increase in the total number of intact glycopeptides detected, an enrichment in the detection of the sialylated O-glycopeptides, and more structural information on the peptide backbone.
Supplementary Material
Acknowledgments
Funds provided by the Dairy Management Institute (HD061923 and HD059127), National Institute of Health (ROIGM049077) and California Dairy Research Foundation Grant 06 LEC-01-NH are gratefully acknowledged.
Footnotes
Supporting Information (SI) Available: This material is available free of charge via the Internet at http://pubs.acs.org
References
- 1.Apweiler R, Hermjakob H, Sharon N. Biochim Biophys Acta. 1999;1473:4–8. doi: 10.1016/s0304-4165(99)00165-8. [DOI] [PubMed] [Google Scholar]
- 2.Olden K, Parent JB, White SL. Biochim Biophys Acta. 1982;650:209–232. doi: 10.1016/0304-4157(82)90017-x. [DOI] [PubMed] [Google Scholar]
- 3.Helenius A, Aebi M. Science. 2001;291:2364–2369. doi: 10.1126/science.291.5512.2364. [DOI] [PubMed] [Google Scholar]
- 4.Varki A. Glycobiology. 1993;3:97–130. doi: 10.1093/glycob/3.2.97. [DOI] [PMC free article] [PubMed] [Google Scholar]
- 5.Lowe JB. Cell. 2001;104:809–812. doi: 10.1016/s0092-8674(01)00277-x. [DOI] [PubMed] [Google Scholar]
- 6.Montreuil J. Biol Cell. 1984;51:115–131. doi: 10.1111/j.1768-322x.1984.tb00291.x. [DOI] [PubMed] [Google Scholar]
- 7.Yet MG, Shao MC, Wold F. Faseb J. 1988;2:22–31. doi: 10.1096/fasebj.2.1.3275561. [DOI] [PubMed] [Google Scholar]
- 8.Rademacher TW, Parekh RB, Dwek RA. Annu Rev Biochem. 1988;57:785–838. doi: 10.1146/annurev.bi.57.070188.004033. [DOI] [PubMed] [Google Scholar]
- 9.An HJ, Froehlich JW, Lebrilla CB. Curr Opin Chem Biol. 2009;13:421–426. doi: 10.1016/j.cbpa.2009.07.022. [DOI] [PMC free article] [PubMed] [Google Scholar]
- 10.Gravel P, Golaz O, Walzer C, Hochstrasser DF, Turler H, Balant LP. Anal Biochem. 1994;221:66–71. doi: 10.1006/abio.1994.1380. [DOI] [PubMed] [Google Scholar]
- 11.Leeflang BR, Faber EJ, Erbel P, Vliegenthart JFG. J Biotech. 2000;77:115–122. doi: 10.1016/s0168-1656(99)00212-6. [DOI] [PubMed] [Google Scholar]
- 12.Ahn VE, Faull KF, Whitelegge JP, Higginson J, Fluharty AL, Prive GG. Protein Expres Purif. 2003;27:186–193. doi: 10.1016/s1046-5928(02)00597-1. [DOI] [PubMed] [Google Scholar]
- 13.Mrochek JE, Dinsmore SR, Waalkes TP. Clin Chem. 1975;21:1314–1322. [PubMed] [Google Scholar]
- 14.Zabrouskov V, Han X, Welker E, Zhai H, Lin C, van Wijk KJ, Scheraga HA, McLafferty FW. Biochemistry. 2006;45:987–992. doi: 10.1021/bi0517584. [DOI] [PMC free article] [PubMed] [Google Scholar]
- 15.Balaguer E, Neususs C. Anal Chem. 2006;78:5384–5393. doi: 10.1021/ac060376g. [DOI] [PubMed] [Google Scholar]
- 16.An HJ, Peavy TR, Hedrick JL, Lebrilla CB. Anal Chem. 2003;75:5628–5637. doi: 10.1021/ac034414x. [DOI] [PubMed] [Google Scholar]
- 17.Kolarich D, Weber A, Pabst M, Stadlmann J, Teschner W, Ehrlich H, Schwarz HP, Altmann F. Proteomics. 2008;8:254–263. doi: 10.1002/pmic.200700720. [DOI] [PubMed] [Google Scholar]
- 18.Juhasz P, Martin SA. Int J Mass Spectrom Ion Process. 1997;169/170:217–230. [Google Scholar]
- 19.Yu YQ, Fournier J, Gilar M, Gebler JC. Anal Chem. 2007;79:1731–1738. doi: 10.1021/ac0616052. [DOI] [PubMed] [Google Scholar]
- 20.Bogdanov B, Smith RD. Mass Spec Reviews. 2005;24:168–200. doi: 10.1002/mas.20015. [DOI] [PubMed] [Google Scholar]
- 21.Zhang Z, Pan H, Chen X. Mass Spec Reviews. 2009;28:147–176. doi: 10.1002/mas.20190. [DOI] [PubMed] [Google Scholar]
- 22.Sutton CW, O’Neill JA, Cottrell JS. Anal Biochem. 1994;218:34–46. doi: 10.1006/abio.1994.1138. [DOI] [PubMed] [Google Scholar]
- 23.Seipert RR, Dodds ED, Clowers BH, Beecroft SM, German JB, Lebrilla CB. Anal Chem. 2008;80:3684–3692. doi: 10.1021/ac800067y. [DOI] [PMC free article] [PubMed] [Google Scholar]
- 24.Seipert RR, Dodds ED, Lebrilla CB. J Proteome Res. 2009;8:493–501. doi: 10.1021/pr8007072. [DOI] [PMC free article] [PubMed] [Google Scholar]
- 25.Deguchi K, Ito H, Bada T, Hirabayashi A, Nakagawa H, Fumoto M, Hinou H, Nishumura S. Rapid Commun Mass Spectrom. 2007;21:691–698. doi: 10.1002/rcm.2885. [DOI] [PubMed] [Google Scholar]
- 26.Deguchi K, Ito H, Takegawa Y, Shinji N, Nakagawa H, Nishumura S. Rapid Coomun Mass Spectrom. 2006;20:741–746. doi: 10.1002/rcm.2368. [DOI] [PubMed] [Google Scholar]
- 27.Axen R, Porath J, Ernback S. Nature. 1967;214:1302–1304. doi: 10.1038/2141302a0. [DOI] [PubMed] [Google Scholar]
- 28.Clowers BH, Dodds ED, Seipert RR, Lebrilla CB. Anal Biochem. 2008;381:205–213. doi: 10.1016/j.ab.2008.06.041. [DOI] [PMC free article] [PubMed] [Google Scholar]
- 29.An HJ, Tillinghast JS, Woodruff DL, Rocke DM, Lebrilla CB. J Proteome Res. 2006;5:2800–2808. doi: 10.1021/pr0602949. [DOI] [PubMed] [Google Scholar]
- 30.Wei Z, Nishimura T, Yoshida S. J Dairy Sci. 2000;83:683–689. doi: 10.3168/jds.S0022-0302(00)74929-0. [DOI] [PubMed] [Google Scholar]
- 31.Huberty MC, Vath JE, Yu W, Martin SA. Anal Chem. 1993;65:2791–2800. doi: 10.1021/ac00068a015. [DOI] [PubMed] [Google Scholar]
- 32.Harvey DJ. Proteomics. 2001;1:311–328. doi: 10.1002/1615-9861(200102)1:2<311::AID-PROT311>3.0.CO;2-J. [DOI] [PubMed] [Google Scholar]
- 33.Holland JW, Deeth HC, Alewood PF. Proteomics. 2005;5:990–1002. doi: 10.1002/pmic.200401098. [DOI] [PubMed] [Google Scholar]
- 34.Harrison AG, Young AB. J Mass Spectrom. 2005;40:1173–1186. doi: 10.1002/jms.891. [DOI] [PubMed] [Google Scholar]
Associated Data
This section collects any data citations, data availability statements, or supplementary materials included in this article.