

Abstract
This paper describes a simple modification to traditional confocal fluorescence detection that greatly improves signal-to-noise (S/N) for the high-speed analysis of droplet streams. Rather than using the conventional epi geometry, illumination of the droplet was in the form of a line that is orthogonal to both the direction of flow and the light-collection objective. In contrast to the epi geometry where we observed high levels of scattering background from the droplets, we detected more than 10-fold less background (depending on the laser power used) when orthogonal-line-confocal illumination was used. We characterized this improvement using a standard microfluidic platform over a range of analyte concentrations, and observed an improvement in limits of detection of greater than 10. Using this method, we were able to analyze pico-molar concentrations of analytes contained within picoliter-volume droplets at a rate of greater than 350 droplets per second.
Keywords: droplets, fluorescence, microfluidics, single molecule, high throughput
INTRODUCTION
The use of microfluidic platforms for screening and assays has become an important part of the analytical toolbox 1-7. In recent years, droplet-based systems are showing increasing utility as they allow for sample aliquoting on chip and for carrying out many simultaneous experiments on the samples with no inter-sample mixing 8-17. At present, techniques for encapsulation of species within aqueous droplets have matured 18-20. Strategies for generation of droplets exist from on-demand 21-23 to kHz frequencies 24-25, and these strategies are being incorporated for the analysis of biological samples. Some examples include the encapsulation and analysis of single cells, in-droplet PCR, and protein crystallisation 12, 18, 26-27.
In contrast to the various methods available for the effective encapsulation of species into droplets, techniques for the sensitive readout and analysis of droplet contents are much more lacking 28-30. For example, conducting single-cell experiments in droplets is attractive because the droplet effectively isolates the cell and allows for control of the localized environment surrounding the cell. If the cell was to be lyzed for analysis, the droplet retains the lysate within a small encapsulated volume 18. The challenge in such studies lies in the fact that a single cell yields only a small number of a given type of biomolecules. As a result, it is extremely difficult to carry out the analysis of these molecules in droplets, especially in a high-throughput fashion. One way to overcome this challenge is by amplifying the molecules prior to analysis, such as in PCR 31. Unfortunately, only a very limited set of molecules contained within the cell can be amplified in this fashion. In our own studies, we have become interested in the analysis of miRNA, which can be difficult to amplify using PCR 32-33. This fact motivated us to push the sensitivity of fluorescence detection such that we can detect these molecules without amplification.
One of the most common modes of fluorescence detection is based on the confocal geometry 34, which usually requires the use of a very small probe volume (fL) to achieve high detection sensitivity. In fact, the use of confocal detection within aqueous droplets has been previously demonstrated 11, but requires either static droplets or slow-moving droplets so that the small confocal probe volume has sufficient time to sample through the entire droplet volume. The use of the confocal geometry for rapid flow-through analysis of droplet contents poses several challenges: (1) The droplet volume (pL) is typically many orders of magnitude larger than the diffraction-limited laser focus that defines the confocal probe volume (fL); (2) The refractive-index mismatch between the aqueous droplet and the surrounding immsicible phase can cause significant light scattering/reflection at the droplet interface; (3) For a fast-moving stream of droplets, the detection often must be completed within a very short time (sub-millisecond sampling rate).
These challenges prompted us to evaluate quantitatively the different geometries we might use for carrying out confocal detection and to determine the sensitivity offered by the optimized geometry. In particular, we needed to enlarge the confocal probe volume such that the entire pL-volume droplet can be illuminated as the droplet transits the detection region. This requirement is critical for detecting the presence of molecules at low concentrations (pM), because all molecules of interest within the droplet should be illuminated and excited. While traditional confocal detection using diffraction-limited laser focus can achieve single-molecule sensitivity 35, the actual concentration detection limit is actually quite poor 36, owing to the need to use a small laser focal volume to minimize background noise.
Confocal techniques traditionally utilize an epi-fluorescence configuration, where the excitation laser light and the emitted fluorescence are delivered and collected using the same objective lens and along the same optical axis. We found we were unable to achieve the detection sensitivity we needed (pM concentrations of analytes) using this geometry. Therefore, we changed the optical path for the excitation beam and made it orthogonal to the objective and direction of droplet flow. There are several advantages to doing this for analyzing droplet contents: (1) The orthogonal configuration assures minimal back scattering/reflection from the droplet caused by the mismatch in refractive index between the droplet and the surrounding continuous phase; (2) The orthogonal geometry also minimizes illumination of the chip substrate, which again minimizes background noise; (3) It is easy to shape the excitation laser light into a line without the need to use cylindrical optics 34, because the relatively long depth-of-focus inherently forms a line that illuminates the entire width of the channel; (4) In comparison to shaping a line focus in the focal plane using cylindrical optics, the line illumination created by the orthogonal configuration is more homogeneous and the illuminated volume can be easily adjusted by changing the beam waist of the laser focus; (5) In the orthogonal configuration, in contrast to the epi geometry, the excitation beam and the collected light are no longer controlled by the same objective, which makes it possible to optimize the excitation conditions independently of the collection of the fluorescent light, a very important practical advantage. Here, we characterize the improvement offered by orthogonal line-confocal illumination for detecting low-concentration species in fast-flowing droplets.
MATERIALS AND METHOD
Microfluidic chip and formation of droplet streams
The fluidic chip was fabricated using traditional two-layer photolithography and rapid prototyping in PDMS (polydimethylsiloxane) 37. Figure 1a shows a schematic layout of this chip, which consists of microchannel systems of two different heights: the flow region has a 150 μm square cross section and the inner fluid input channels have a 25 μm square cross section.
Figure 1.
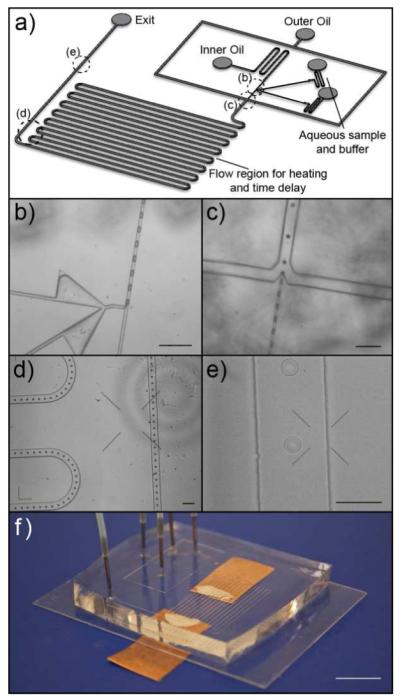
Microfluidic system for droplet formation and manipulation. (a) Schematic showing the overall chip design. The dotted circles labeled (b-e) in the schematic represent regions of the chip that are shown in the corresponding panels (b-e). In this chip design, the droplets were first formed using a T-channel geometry (b), after which the spacing between the droplets was adjusted using hydrodynamic focusing (c). The droplet stream then flow through a serpentine channel system (d) – which may be useful for different droplet manipulations such as for continuous-flow PCR or simply as a delay line to allow time for hybridization of DNA or binding of protein targets - before each droplet was interrogated at the detection region (e). (f) Photograph of a fully assembled chip with tubing and interconnects; the electrical connections (copper pads) attached to the underside of the cover glass, which was patterned with ITO electrodes, allow for on-chip heating. Scale bars in (b-d) represent 200 μm; scale bars in (e) and (f) represent 100 μm and 10 mm respectively.
To form droplets, a medium viscosity silicone oil (Dow Corning 200 fluid, 50cSt, Sigma Aldrich) was used as the continuous phase. In addition, to faciliate droplet formation and to stabilize the droplet stream, we used a silicone based non-ionic surfactant (Gransurf 67, Grant Industries) with a low HLB (Hydrophile-Lipophile balance). This surfactant is also useful for minimizing the interaction between the contained molecules and the droplet interface because of the PEGylated nature of the surfactant.
To drive fluid flow, we used gas tight Hamilton syringes in conjunction with syringe pumps (33 twin, Harvard Apparatus). The use of gas tight glass syringes was important for minimizing the fluidic capacitance of the system. Furthermore, Teflon tubing (PTFE 20 gauge, Zeus Industrial Products) was used to connect the syringes to the chip as Teflon tubing has a much lower expansion coefficient than the popular polyethylene tubing. 20 gauge Becton Dickinson surgical needles were used as interconnects from the syringes and the PDMS chip to the PTFE tubing.
The experiment was carried out by first establishing a pressure balanced system with all fluids flowing through the chip, followed by gradually increasing the pressure applied to the aqueous phase until a stable stream of droplets of the desired size (30 μm in diameter) was achieved. We were able to adjust the droplet size, inter-droplet spacing, and flow speed by varying the flow rates of the oils in the inner and outer channels in conjunction with the aqueous phase flow (illustrated in Fig. 1). An equilibration time of one minute was needed between each adjustment of the respective aqueous and oil flows. Images of the generated droplet stream at various sections of the device are displayed in figure 1 (b-e).
We used a high-speed camera (GC1380, Prosilica) to visualize the droplet stream. Once a stable stream was established, we switched the microscope from bright-field imaging using the high-speed camera to fluorescence confocal detection using a SPAD (single-photon avalanche photo-diode) at 2k Hz sampling rate. The droplet size, stream position, and fluorecence detection region were all checked at the start and end of each data collection run to ensure positional accuracy of the stream and to make sure there was no significant photobleaching of the solutions within the chip and tubing during each run. For each data collection run, we recorded and averaged the signals from at least 10,000 droplets. The data point we collected for each concentration was measured at least three times, with each time using a new chip.
We used 200 μm thick custom cut glass coverslips made from ultra-pure D263 Schott glass to minimise scatter and fluorescence components from the glass. This was then coated on one side with a thin layer (10Ω/sq) of Indium Tin Oxide (ITO) to allow for transparent electrodes/heating elements to be patterened. For patterning, regions of the ITO chip were masked using a silicone based tape and then ITO etched using a warm solution of HNO3/HCl. Copper wires were connected to the ITO patterned regions using a silver based conductive epoxy. The use of ITO allowed for observations to be made over the entirety of the microfluidic channel, due to its transparent nature, however, fluorecence measurements were made through a region not patterned with ITO.
The experiments were done using fluorescein in concentrations that ranged from 100 nM to 100 pM in a 1× PBS solution (pH of 7.4). We chose fluorescein as a fluorophore because fluorescein isothiocyanate (FITC), with an isothiocyanate functional group, is a common fluorescent tag used in biological labeling reactions, as it is reactive towards amine groups and can be easily incorporated into DNA/RNA probes, such as molecular beacons. PBS was chosen as it is a widely used biological buffer.
Optical setup
Figures 2 and 3 show schematically our optical setup. For both the epi-fluorescence and orthogonal-line-confocal configuration, a solid-state blue laser emitting at 488 nm (Sapphire, Coherent Inc.) was used as the excitation source. The beam power was attenuated using two sets of polarization cube beamsplitters (Thorlabs) and half waveplates (Thorlabs, Zero-Order, 488 nm). A Nikon TE2000 microscope equipped with a 20× Plan Apochromat 0.75 NA objective was used in our experiments. We intentionally used a low-magnification and long-working-distance (1 mm) air objective so we can have greater flexibility in our microchip design (with regard to thickness of glass and the PDMS layers) and so that we can implement temperature control by patterning heaters directly onto the coverlip (e.g. to control hybridization/annealing of DNA) without the concern of thermal coupling to the objective or contamination of immersion oil. The pinhole at the confocal plane had a diameter of 500 μm. Both the epi-confocal spot size and the orthogonal-line-confocal excitation beam waist were set to 40 μm at the image plane of the objective. Beam powers were measured after the objective or the aspheric lens used for focusing the laser light into the chip. Fluorescence detection was performed using a single-photon avalanche photo-diode (SPAD; SPCM-AQR-12, Perkin Elmer).
Figure 2.
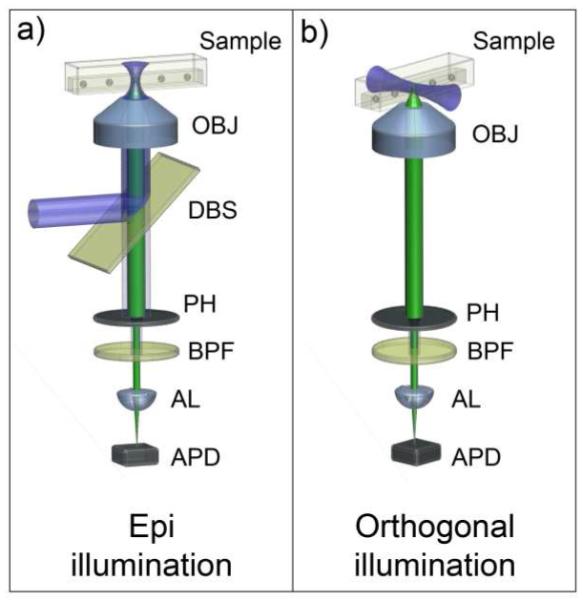
Schematic illustration showing the two optical systems that are being compared. (a) shows the large area epi-confocal arrangement, and (b) shows the arrangement for orthogonal-line-confocal excitation. OBJ = Microscope objective, DBS = Dichroic beam splitter, PH = Pinhole, BPF = Band pass filter, AL = Aspheric lens, APD = Avalanche photo diode.
Figure 3.

Optical configuration for orthogonal line confocal excitation. (a) Schematic layout of the optical train used to generate the orthogonal line excitation; T1 and T2 are telescopes, AL is an aspheric lens, and OBJ is the microscope objective. (b) Photograph showing the actual layout of the optical train; blue arrows were drawn in to illustrate the beam path. (c) An overlay image showing a droplet transiting the excitation volume; the laser excitation volume was imaged by filling the channel with fluorescein and by imaging the emitted fluorescence from the excited dyes. The scale bar in the image represents 30 μm.
The 488 nm laser line was directed through a halfwave plate then through a polarising cube beam splitter. The p-polarised light passing through the cube was used for the orthogonal-line-confocal excitation, while the reflected s-polarised light was used for the epi-confocal detection. A second halfwave plate and polarising beam splitter were used on the epi-confocal beam path to allow for tunability of the laser power of both beam paths. The epi-confocal beam was then expanded and directed into the rear of the microscope through a tunable aperture. The desired beam size at the focal plane of the objective was created by underfilling the back aperture of the ojective, therefore not using the full NA. This was achieved by using a telescope lens pair, then followed by an iris which was used to make small adjustments to the beam diameter prior to entering the microscope.The orthogonal line confocal excitation beam was directed through a 2× telescope, then directed to the microcope stage using mirrors and a periscope. Close to the microscope stage, the beam was further expanded by 2× prior to focusing into the side of the microfluidic device through a 20 mm focal length aspheric lens. Lateral positioning and angle of approach to the sample channel inside the microfluidic device were adjusted using kinematic lens and mirror mounts. The optical train was setup in this way to allow for control of the beam size and divergence as close to the aspheric lens as possible.
RESULTS AND DISCUSSION
Microfluidic design considerations
For a fast-flowing stream of droplets, it is important to maintain a stable flow for all applications. Furthermore, for many biological experiments (e.g. DNA hybridization or single-cell assays), it is also important to control the temperature of the droplets flowing through the chip. As a result, we chose to use silicone oil as our continuous phase because the physical properties of silicone oil are not significantly affected within a broad temperature range of −40°C to 200°C 38. As mentioned previously, we also used gas tight glass syringes and Teflon tubing to minimize the fluidic capacitance of the system.
For temperature control, we used ITO (indium tin oxide) coated glass slides so we can employ resistive heating to heat selected portions of the chip. The intent to incorporate this on-chip temperature control required the use of long working distance air objectives, to minimize thermal coupling and cross talk of the objective to the sample. We determined that a moderate numerical aperture (NA), low magnification, long working distance objective gave the best trade-off between sampling depth, and the light collection efficiency through calculation of the 3D point spread function (PSF) and light collection angles.
For droplet size, we chose to form droplets that were 30 μm in diameter, because we felt this size is most suitable for accommodating single cells 18. Droplets of this size could be formed readily using our microfluidic system and the silicone oil and surfactant we selected. In our microfludic design, droplets were formed and accelerated into the flow channel by using a combination of a T-junction and a flow-focusing geometry. The aqueous droplet was initially broken off from the aqueous phase into a plug at the intersection of the T-junction, which had a 25 μm square cross section (Fig. 1b). This plug flowed along this channel and then experienced a sheath flow from the flow-focusing channels, which accelerated the plug and assisted its flow path down the larger channel (150 μm square cross section), in which the plug became a free floating droplet (Fig. 1c).
In most droplet experiments, droplet streams were generated with either the T-junction or the flow-focusing geometry, but usually not in combination. We found that we could independently vary the size of the droplets, the inter-droplet spacing, and the flow speed of the droplets when we integrated these two geometries together. The flow conditions in the T-junction mainly determined the droplet size, whereas the flow rates in the flow-focusing channels could be tuned to vary inter-droplet spacing and flow speed. This finer level of control over the droplets’ volume and spacing will be important in most biological applications.
Optical design considerations
In designing our optical system, we aimed to implement a true on-line detection scheme that is de-coupled from the microfluidic system and which can be applied broadly to any droplet microfluidic device. A key advantage to the orthogonal geometry in comparison with the epi configuration is that it de-couples the excitation path from the light collection objective and optics. This de-coupling reduces both background and noise allowing for easier discrimination of the fluorescence signal.
The fact that the orthogonal system should offer lower background noise is clear and has been mentioned previously. There is simply less back scattering and reflection from the droplet, the substrate, and various interfaces (where there is a refractive-index mismatch) in the orthogonal system than in the epi geometry. Additionally, because the excitation and collection paths are de-coupled, it is also possible to use less optical elements in the detection path (e.g. dichroics).
The de-coupling between excitation and light collection also helps to enhance the fluorescent signal. In our optical system, we used a moderate NA (0.75) long-working distance air objective. Despite the moderate NA, the depth-of-focus is still shallower than the height of the droplet. Using a 20× 0.75 NA objective and a pinhole of 500 μm, the forward projected pinhole size (i.e. the pinhole size at the object plane) is 25 μm. The 3D point spread function was calculated, using wide-area illumination instead of point excitation, to show a probe depth of ~ 14 μm, or about half the diameter of our droplet. Using this probe depth and the forward projected pinhole size of 25 μm, the volume of a 30 μm diameter droplet that is sampled as it flows through the detection volume is 61%. This can be increased to 65% by increasing the pinhole size beyond 0.6 mm, but the collection volume is ultimately limited by the collection depth of the objective.
If we were to create our excitation focus through this objective, then our droplet will not be illuminated evenly, and in fact, about half of the analytes in our droplet will be very poorly excited. This issue is circumvented when we use the orthogonal geometry, which easily creates a homogeneous focused laser line that covers the entire width and height of the channel and droplet (Fig. 3c). Because we are using the z-direction of the laser focus to form the length of the illumination line, rather than trying to shape the beam in the focal plane, the illumination line offers even excitation across the entire droplet. Tuning the width of the excitation line is also simple and is entirely de-coupled from the collection optical path. Indeed, by using a line focus with a narrow beam waist, it should be possible to carry out axial optical sectioning along the height of the channel if needed, and in this case, the axial sectioning will be dictated by the width of the excitation beam rather than by the confocal pinhole.
We note that the PSF is not an absolute measure of collection depth, and that the objective can still collect some light from below and above the depth of focus of the objective. For imaging, light that is collected along the optical axis and which is outside of the depth of focus will appear blurred, but for point detection, as in our case, this is not an issue. Overall, separation of laser excitation and light collection allows for independent control of the excitation beam without sacrificing the light collection efficiency of the optical system. The main drawback with the orthogonal geometry is the difficulty with forming a very tight laser focus, because of the constraints imposed by the focusing lens and the working distance that is needed for focusing from the side of the chip. We calculate that it is possible to obtain an airy disk diameter of ~8 μm with a Rayleigh length of 110 μm using our current optical setup; we empirically determined, however, that beam widths below 20 μm are difficult to achieve. For forming diffraction-limited laser focus, the epi-confocal geometry would still be the most suitable.
Comparison between the epi and orthogonal excitation configurations
Figure 4 shows raw time traces of photon counts taken using the epi (Fig. 4a) and orthogonal (Fig. 4b, 4c) geometry. The laser illumination power, the concentration of fluorescein within the droplets, and all other settings used to acquire data in Fig. 4a and 4b were identical except for the difference in excitation configuration. It is evident that the background in orthogonal illumination is much lower (~ 10×) than epi. This much reduced background permits the use of higher laser power to achieve a lower detection limit. In Fig. 4c, the excitation power was increased ~ 10× from 0.75 mW to 7 mW, while the concentration of the analyte was decreased 20× from 5 nM to 250 pM. Here, the signal-to-noise is still excellent (> 20).
Figure 4.
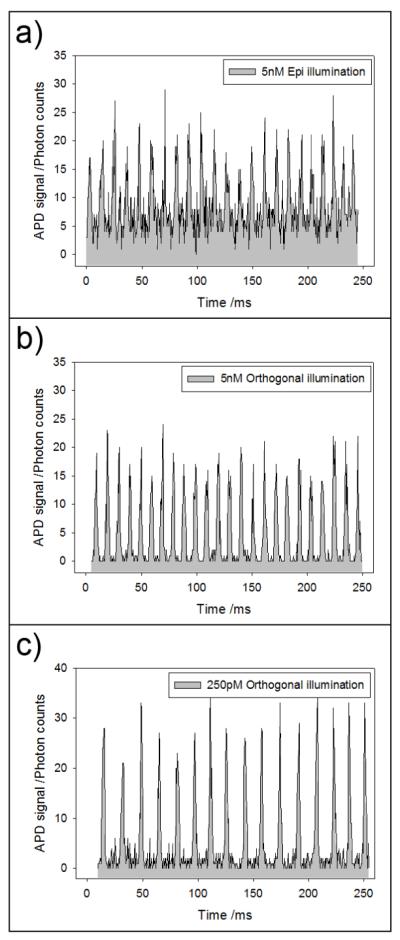
Detection of droplet streams. (a) Time trace showing the detection of individual passing droplets (each photon spike corresponds to one droplet) using the epi-confocal geometry. Each droplet contains 5 nM of fluorescein. (b) Detection of the same droplet stream as in (a), but with orthogonal-line-confocal excitation. (c) Even at 250 pM concentrations of fluorescein, which corresponded to ~2200 molecules of fluorescein in the 30 μm diameter droplet, the signal-to-noise ratio was excellent. The laser power used in (a) and (b) was 0.75 mW, and in (c) was 7 mW.
A concentration of 250 pM corresponds to ~2200 molecules of fluorescein present in the 30 μm diameter droplet. We attempted the same experiment using 250 pM of fluorescein but with the epi configuration, but we were unable to detect any discernible signal/peak and observed only a very high background (data not shown).
Figure 5 summarizes the difference between epi and orthogonal excitation by plotting out the difference in background and noise as a function laser power, as well as normalized (to laser power) peak height and signal-to-noise. For this quantitative characterization, we wrote a custom Labview program that extracts from the raw photon count time traces the following data: peak height, peak area and the background and noise between the peaks. These extracted values were collated from each of the individual runs, where each run collects data from at least 10,000 droplets, then averaged between all the runs (at least 3) for each laser power and concentration of fluorescein.
Figure 5.

Comparisons of background and signal-to-noise between epi- and orthogonal illumination strategies. (a) and (b) compare both background and noise, respectively. (c) shows a comparison between the peak heights normalized against excitation power for both illumination strategies at each concentration. The variance in the signal peak heights between both excitation methods was measured to be within a 95% confidence interval. (d) depicts the accumulated results, showing an increase in signal-to-noise ratio and the increased sensitivity through lowering of the background signal that allows for detection at much lower concentrations.
The dramatic difference in background and noise offered by the two excitation scheme is evident from Fig. 5a and Fig. 5b, especially at high laser powers. In contrast, the average peak height, when normalized to the excitation laser power, is comparable between both excitation geometry (Fig. 5c). Figure 5d is a log-log plot that shows the difference in the signal-to-noise (s/n) ratio normalized to laser power. Here, the s/n was calculated using the mean peak height divided by the standard deviation of the background. To be able to detect the droplet and to stay within the linear range of the detector, we used progessively higher laser powers as the concentration of fluorescein was decreased. As a result, the normalized s/n was obtained by taking the measured s/n divided by the laser power we employed. The s/n values for the lowest two concentrations (1 nM and 250 pM) were missing on the plot for epi-confocal because we were unable to detect any peaks at those low concentrations. In contrast, for orthogonal line-confocal excitation, we were able to achieve a s/n (not normalized to power) of > 20 at 250 pM. This fact again illustrates the marked improvement in detection limit offered by the orthogonal over the epi configuration.
CONCLUSION
Although orthogonal excitation and detection is the geometry of choice used in bulk fluorescence measurements (e.g. cuvettes or capillaries), this configuration is rarely used in a microscopy and microfluidic setting where epi-illumination is the dominant configuration. The planar nature of microfluidic systems means there is generally little scatter in most situations, especially when high NA objectives are used in a confocal arrangement. Additionally, there is the general impression that implementing epi illumination is simpler than the orthogonal one because of the planar construction of the microscope and chip. Here, we show the implementation of orthogonal line confocal excitation is simple for the detection of droplet contents, even when using a relatively high NA (0.75) objective on an inverted microscope. We quantified the improvements offered by orthogonal over the epi configuration, and showed that for droplets the back reflection/scattering is a significant contributor to noise owing to the refractive-index mismatch between the aqueous droplet and the surrounding immiscible phase. As a result, for fluorescence detection of droplet contents, orthogonal line confocal excitation should be employed when high sensitivity is required.
Acknowledgement
This work was supported by NSF (CHE-0844688) and NIH (NS052637 and CA147831).
REFERENCES
- 1.Chiu DT, Lorenz RM, Jeffries GDM. Droplets for Ultrasmall-Volume Analysis. Analytical Chemistry. 2009;81(13):5111–5118. doi: 10.1021/ac900306q. [DOI] [PMC free article] [PubMed] [Google Scholar]
- 2.Srinivasan V, Pamula VK, Fair RB. An integrated digital microfluidic lab-on-a-chip for clinical diagnostics on human physiological fluids. Lab on a Chip. 2004;4(4):310–315. doi: 10.1039/b403341h. [DOI] [PubMed] [Google Scholar]
- 3.Hong JW, Quake SR. Integrated nanoliter systems. Nat Biotech. 2003;21(10):1179–1183. doi: 10.1038/nbt871. [DOI] [PubMed] [Google Scholar]
- 4.Barbulovic-Nad I, Yang H, Park PS, Wheeler AR. Digital microfluidics for cell-based assays. Lab on a Chip. 2008;8(4):519–526. doi: 10.1039/b717759c. [DOI] [PubMed] [Google Scholar]
- 5.Sinclair J, Pihl J, Olofsson J, Karlsson M, Jardemark K, Chiu DT, Orwar O. A cell-based bar code reader for high-throughput screening of ion channel-ligand interactions. Analytical Chemistry. 2002;74(24):6133–6138. doi: 10.1021/ac026133f. [DOI] [PubMed] [Google Scholar]
- 6.Ohno K, Tachikawa K, Manz A. Microfluidics: Applications for analytical purposes in chemistry and biochemistry. Electrophoresis. 2008;29(22):4443–4453. doi: 10.1002/elps.200800121. [DOI] [PubMed] [Google Scholar]
- 7.Huebner A, Sharma S, Srisa-Art M, Hollfelder F, Edel JB, Demello AJ. Microdroplets: A sea of applications? Lab on a Chip. 2008;8(8):1244–1254. doi: 10.1039/b806405a. [DOI] [PubMed] [Google Scholar]
- 8.Edgar JS, Milne G, Zhao Y, Pabbati CP, Lim DS, Chiu DT. Compartmentalization of Chemically Separated Components into Droplets. Angew Chem Int Ed Engl. 2009;48(15):2719–2722. doi: 10.1002/anie.200805396. [DOI] [PMC free article] [PubMed] [Google Scholar]
- 9.He M, Sun C, Chiu DT. Concentrating Solutes and Nanoparticles within Individual Aqueous Microdroplets. Analytical Chemistry. 2004;76(5):1222–1227. doi: 10.1021/ac035196a. [DOI] [PubMed] [Google Scholar]
- 10.Lorenz RM, Edgar JS, Jeffries GDM, Zhao YQ, McGloin D, Chiu DT. Vortex-trap-induced fusion of femtoliter-volume aqueous droplets. Analytical Chemistry. 2007;79(1):224–228. doi: 10.1021/ac061586w. [DOI] [PMC free article] [PubMed] [Google Scholar]
- 11.Rane TD, Puleo CM, Liu KJ, Zhang Y, Lee AP, Wang TH. Counting single molecules in sub-nanolitre droplets. Lab on a Chip. 2010;10(2):161–164. doi: 10.1039/b917503b. [DOI] [PMC free article] [PubMed] [Google Scholar]
- 12.Kiss MM, Ortoleva-Donnelly L, Beer NR, Warner J, Bailey CG, Colston BW, Rothberg JM, Link DR, Leamon JH. High-Throughput Quantitative Polymerase Chain Reaction in Picoliter Droplets. Analytical Chemistry. 2008;80(23):8975–8981. doi: 10.1021/ac801276c. [DOI] [PMC free article] [PubMed] [Google Scholar]
- 13.Kotz KT, Gu Y, Faris GW. Optically Addressed Droplet-Based Protein Assay. Journal of the American Chemical Society. 2005;127(16):5736–5737. doi: 10.1021/ja050249m. [DOI] [PubMed] [Google Scholar]
- 14.Schmitz CHJ, Rowat AC, Koster S, Weitz DA. Dropspots: a picoliter array in a microfluidic device. Lab on a Chip. 2009;9(1):44–49. doi: 10.1039/b809670h. [DOI] [PubMed] [Google Scholar]
- 15.Kumaresan P, Yang CJ, Cronier SA, Blazei RG, Mathies RA. High-throughput single copy DNA amplification and cell analysis in engineered nanoliter droplets. Analytical Chemistry. 2008;80(10):3522–3529. doi: 10.1021/ac800327d. [DOI] [PubMed] [Google Scholar]
- 16.Hashimoto M, Feng J, York RL, Ellerbee AK, Morrison G, Thomas SW, Mahadevan L, Whitesides GM. Infochemistry: Encoding Information as Optical Pulses Using Droplets in a Microfluidic Device. Journal of the American Chemical Society. 2009;131(34):12420–12429. doi: 10.1021/ja904788m. [DOI] [PubMed] [Google Scholar]
- 17.Chen D, Du W, Liu Y, Liu W, Kuznetsov A, Mendez FE, Philipson LH, Ismagilov RF. The chemistrode: a droplet-based microfluidic device for stimulation and recording with high temporal, spatial, and chemical resolution. Proc Natl Acad Sci U S A. 2008;105(44):16843–8. doi: 10.1073/pnas.0807916105. [DOI] [PMC free article] [PubMed] [Google Scholar]
- 18.He MY, Edgar JS, Jeffries GDM, Lorenz RM, Shelby JP, Chiu DT. Selective encapsulation of single cells and subcellular organelles into picoliter- and femtoliter-volume droplets. Analytical Chemistry. 2005;77(6):1539–1544. doi: 10.1021/ac0480850. [DOI] [PubMed] [Google Scholar]
- 19.Clausell-Tormos J, Lieber D, Baret J-C, El-Harrak A, Miller OJ, Frenz L, Blouwolff J, Humphry KJ, Köster S, Duan H, Holtze C, Weitz DA, Griffiths AD, Merten CA. Droplet-Based Microfluidic Platforms for the Encapsulation and Screening of Mammalian Cells and Multicellular Organisms. Chemistry and Biology. 2008;15(5):427–437. doi: 10.1016/j.chembiol.2008.04.004. [DOI] [PubMed] [Google Scholar]
- 20.Chabert M, Viovy JL. Microfluidic high-throughput encapsulation and hydrodynamic self-sorting of single cells. Proceedings of the National Academy of Sciences of the United States of America. 2008;105(9):3191–3196. doi: 10.1073/pnas.0708321105. [DOI] [PMC free article] [PubMed] [Google Scholar]
- 21.Lorenz RM, Edgar JS, Jeffries GDM, Chiu DT. Microfluidic and optical systems for the on-demand generation and manipulation of single femtoliter-volume aqueous droplets. Analytical Chemistry. 2006;78(18):6433–6439. doi: 10.1021/ac060748l. [DOI] [PubMed] [Google Scholar]
- 22.Lorenz RM, Fiorini GS, Jeffries GD, Lim DS, He M, Chiu DT. Simultaneous generation of multiple aqueous droplets in a microfluidic device. Anal Chim Acta. 2008;630(2):124–30. doi: 10.1016/j.aca.2008.10.009. [DOI] [PMC free article] [PubMed] [Google Scholar]
- 23.He MY, Kuo JS, Chiu DT. Electro-generation of single femtoliter- and picoliter-volume aqueous droplets in microfluidic systems. Applied Physics Letters. 2005;87(3) [Google Scholar]
- 24.Theberge AB, Whyte G, Huck WTS. Generation of Picoliter Droplets with Defined Contents and Concentration Gradients from the Separation of Chemical Mixtures. Analytical Chemistry. 2010;82(9):3449–3453. doi: 10.1021/ac1005316. [DOI] [PubMed] [Google Scholar]
- 25.Solvas XCI, Srisa-Art M, Demello AJ, Edel JB. Mapping of Fluidic Mixing in Microdroplets with 1 mu s Time Resolution Using Fluorescence Lifetime Imaging. Analytical Chemistry. 2010;82(9):3950–3956. doi: 10.1021/ac100055g. [DOI] [PubMed] [Google Scholar]
- 26.Beer NR, Wheeler EK, Lee-Houghton L, Watkins N, Nasarabadi S, Hebert N, Leung P, Arnold DW, Bailey CG, Colston BW. On-chip single-copy real-time reverse-transcription PCR in isolated picoliter droplets. Analytical Chemistry. 2008;80(6):1854–1858. doi: 10.1021/ac800048k. [DOI] [PubMed] [Google Scholar]
- 27.Zheng B, Roach LS, Ismagilov RF. Screening of protein crystallization conditions on a microfluidic chip using nanoliter-size droplets. Journal of the American Chemical Society. 2003;125(37):11170–11171. doi: 10.1021/ja037166v. [DOI] [PubMed] [Google Scholar]
- 28.Edgar JS, Pabbati CP, Lorenz RM, He MY, Fiorini GS, Chiu DT. Capillary electrophoresis separation in the presence of an immiscible boundary for droplet analysis. Analytical Chemistry. 2006;78(19):6948–6954. doi: 10.1021/ac0613131. [DOI] [PMC free article] [PubMed] [Google Scholar]
- 29.Roman GT, Wang M, Shultz KN, Jennings C, Kennedy RT. Sampling and Electrophoretic Analysis of Segmented Flow Streams Using Virtual Walls in a Microfluidic Device. Analytical Chemistry. 2008;80(21):8231–8238. doi: 10.1021/ac801317t. [DOI] [PMC free article] [PubMed] [Google Scholar]
- 30.Fidalgo Luis M., Whyte G, Ruotolo Brandon T., Benesch Justin L. P., Stengel F, Abell C, Robinson Carol V., Huck Wilhelm T. S. Coupling Microdroplet Microreactors with Mass Spectrometry: Reading the Contents of Single Droplets Online. Angewandte Chemie. 2009;121(20):3719–3722. doi: 10.1002/anie.200806103. [DOI] [PubMed] [Google Scholar]
- 31.Beer NR, Hindson BJ, Wheeler EK, Hall SB, Rose KA, Kennedy IM, Colston BW. On-chip, real-time, single-copy polymerase chain reaction in picoliter droplets. Analytical Chemistry. 2007;79(22):8471–8475. doi: 10.1021/ac701809w. [DOI] [PubMed] [Google Scholar]
- 32.Raymond CK, Roberts BS, Garrett-Engele P, Lim LP, Johnson JM. Simple, quantitative primer-extension PCR assay for direct monitoring of microRNAs and short-interfering RNAs. RNA. 2005;11(11):1737–1744. doi: 10.1261/rna.2148705. [DOI] [PMC free article] [PubMed] [Google Scholar]
- 33.Chen C, Ridzon DA, Broomer AJ, Zhou Z, Lee DH, Nguyen JT, Barbisin M, Xu NL, Mahuvakar VR, Andersen MR, Lao KQ, Livak KJ, Guegler KJ. Real-time quantification of microRNAs by stem-loop RT-PCR. Nucl. Acids Res. 2005;33(20):e179. doi: 10.1093/nar/gni178. [DOI] [PMC free article] [PubMed] [Google Scholar]
- 34.Schiro PG, Kuyper CL, Chiu DT. Continuous-flow single-molecule CE with high detection efficiency. Electrophoresis. 2007;28(14):2430–2438. doi: 10.1002/elps.200600730. [DOI] [PubMed] [Google Scholar]
- 35.Nie S, Chiu DT, Zare RN. Probing Individual molecules with confocal fluorescence microscopy. Science (Washington, D. C.) 1994;266:1018–1021. doi: 10.1126/science.7973650. [DOI] [PubMed] [Google Scholar]
- 36.Lundqvist A, Chiu DT, Orwar O. Electrophoretic separation and confocal laser-induced fluorescence detection at ultralow concentrations in constricted fused-silica capillaries. Electrophoresis. 2003;24(11):1737–1744. doi: 10.1002/elps.200305429. [DOI] [PubMed] [Google Scholar]
- 37.McDonald JC, Duffy DC, Anderson JR, Chiu DT, Wu H, Schueller OJA, Whitesides GM. Fabrication of microfluidic systems in poly(dimethylsiloxane) Electrophoresis. 2000;21(1):27–40. doi: 10.1002/(SICI)1522-2683(20000101)21:1<27::AID-ELPS27>3.0.CO;2-C. [DOI] [PubMed] [Google Scholar]
- 38.Sgro AE, Allen PB, Chiu DT. Thermoelectric manipulation of aqueous droplets in microfluidic devices. Analytical Chemistry. 2007;79(13):4845–4851. doi: 10.1021/ac062458a. [DOI] [PMC free article] [PubMed] [Google Scholar]