Abstract
The metabolism of glycosphingolipids by the malaria-causing parasite Plasmodium falciparum plays an important role in the progression of the disease. We report a new and highly sensitive method to monitor the uptake of glycosphingolipids in infected red blood cells (iRBCs). A tetramethylrhodamine-labeled glycosphingolipid (GM1-TMR) was used as a substrate. Uptake was demonstrated by fluorescence microscopy. The iRBCs were lysed with a 15% solution of saponin and washed with phosphate buffered saline to release intact parasites. The parasites were further lysed and the resulting homogenates were analyzed by capillary electrophoresis with laser-induced fluorescence detection. The lysate from erythrocytes infected at 1% parasitemia generated a signal twenty standard deviations larger than uninfected erythrocytes, which suggests that relatively low infection levels can be studied with this technique.
Malaria is an endemic disease occurring mostly in tropical regions worldwide, with up to 500 millions of cases reported yearly.1 Among the malaria parasites infecting humans, Plasmodium falciparum is the most virulent, causing about one million deaths every year. The disease is contracted through a mosquito bite of the female Anopheles species, which transmits the parasites to the humans. The parasite grows in the liver before it is released in the blood stream to infect and destroy the erythrocytes.2 This stage of the infection is accompanied by various symptoms such as fever, chills, and general malaise. The global impact of the disease has made the search for malaria therapies one of the priorities of the World Health Organization.3
Commonly used antimalarials include chloroquine, sulphadoxine-pyrimethamine, mefloquine, and more recently artemisinin combination therapy. However, there is concern over the development of drug resistance, and there is interest in the development of therapeutics with novel modes of action.4 Glycolipids have been identified as potential therapeutic targets.5 An early study of the lipid content in malaria-infected rat red blood cells (iRBCs) reported a significant increase in the phospholipid content due to the parasite’s activity,6 which suggests that developing parasites are actively metabolizing these compounds. Initially, only sphingomyelin was shown to be synthesized by P. falciparum,7–8 which is necessary for the formation of tubovesicular membranes.9 Further studies revealed the de-novo biosynthesis of other glycosphingolipids such as glycosyl-ceramide by the parasite.10 The observation that glycosphingolipid metabolism plays an important role in the development of the malaria parasite, combined with our ability to monitor the various metabolic products, suggests a method for elaborating therapeutic strategies to disrupt this metabolism, and thus disrupt the developmental cycle of the parasite.
The common technique used for the analysis of glycolipids is thin layer chromatography, which is laborious and often does not provide the sensitivity and/or the resolution required when sampling components present in trace amounts. Alternatively, exogenous lipids analogues containing a fluorescent or radioactive label can be taken up by a wide range of cells and display biological functions similar to their endogenous counterparts. For example, radiolabeled (3H-labeled) GM1, which is among the most complex glycosphingolipids used as a substrate, has been demonstrated to be taken up by cells in culture to undergo metabolic conversion.11–13 Fluorescently-labeled lipids are also being used for various studies. Attaching a fluorescent tag in place of the fatty acid portion of the lipid provides means to study intracellular lipid trafficking, localization and metabolism. Pagano et al. have demonstrated the successful labeling of the mitochondria, endoplasmic reticulum, and nuclear envelope of cultured fibroblasts by the probe N-[N-(7-nitro-2,1,3-benzoxadiazol-4-yl)-ε-aminohexanoyl]-D-erythro-sphingosine (NBD).14 They also used BODIPY labeled lipid to study the endocytotic nature of lipid internalization from the cell surface investigated by fluorescence microscopy.15–16 Haldar et al. treated iRBCs with N-[7-(4-nitrobenzo-2-oxa-1,3-diazole)]aminocaproyl sphingosine (C6-NBD-cer), and employed thin layer chromatography and spectroscopy to monitor uptake and metabolism to the labeled sphingosine-1-phosphocholine.17
We developed an analytical method taking advantage of the attachment of the fluorescent probe tetramethylrhodamine to the glycosphingolipid GM1.18 This labeled substrate was used for the study of lipid metabolism in single mammalian cells, as well as primary cells using capillary electrophoresis coupled to laser-induced fluorescence (CE-LIF).19–20 CE-LIF presents advantages over TLC of much shorter analysis time and dramatically improved detection limits, which are routinely in the low picomolar concentration range.21
This paper reports a simple assay demonstrating exogenous lipid uptake in malaria-infected erythrocytes. In addition to CE-LIF analysis of the cellular homogenates obtained from iRBCs, the uptake of the lipid was observed using confocal microscopy. This method allows for the monitoring of uptake of a fluorescent glycosphingolipid by a cell population and thus provides the basis for differentiation between infected and uninfected red blood cells.
Experimental Methods
Reagents
The tetramethylrhodamine-labeled glycosphingolipid used here (GM1) was synthesized as reported elsewhere:18 a mixture of C18 and C20 GM1 extracted from bovine brain was treated with ceramide N-deacylase to cleave the long chain fatty acid, then separated by reversed-phase chromatography to isolate the C18-lyso-GM1. The fluorescent dye tetramethylrhodamine (TMR) was subsequently added by acylation on the available amino group. This standard was dissolved in deionized water at a concentration of 130 μM.
Growth conditions
Human type A+ red blood cells and plasma from an anonymous donor were used for culturing Plasmodium falciparum 3D7 parasites. Asynchronous P. falciparum parasites were grown in a 2% suspension of human Type A+ red blood cells in complete RPMI culture medium (HEPES, L-glutamine, 20% human A+ plasma) at 4% hematocrit. Cultures were grown in standard tissue culture T25 plug-seal flasks and gassed with a blood gas mixture (5% O2, 5% CO2, and 90% N2 blood) and placed in a 37°C incubator. Parasites used in labeling experiments were grown in RPMI medium without human plasma for 24 hours, after dilution with RPMI medium to obtain cultures with different parasitemia levels (1 to 14%). Parasites pulsed with various dye-lipid mixtures were maintained as 200 μL cultures in wells of a flat-bottom tissue culture plate. Tissue culture plates were gassed within a modular incubator and then placed in a 37 °C incubator.
Parasite lysates
After 24 hours, lysis of the red blood cell was performed with a 15% solution of saponin (Sigma),19 leaving the free parasite intact after several washes with phosphate buffered saline (PBS).20 Further lysis of the parasites by vortexing and sonication (80% duty cycle for 15 minutes) was performed, and the resulting lysates were suspended in 50 μL PBS before storage at −80°C. Five microliters of each sample was mixed with 35 μL of separation buffer for capillary electrophoresis analysis.
Capillary electrophoresis
The capillary electrophoresis instrument used here has been previously reported in the analysis of glycosphingolipids in single cells,21 and has demonstrated single-molecule sensitivity and a wide dynamic range.22–26 An uncoated fused-silica capillary 32-cm long, 31-μm ID and 147-μm OD (Polymicro, Phoenix, AZ) was used for the separation. A postcolumn sheath-flow cuvette was used for fluorescence detection. Excitation was produced by a 10-mW frequency-doubled Nd:YAG laser operating at 532 nm. Emission was collected by a 0.45 NA microscope objective, passed through a 580 DF40 band-pass filter, imaged onto a GRIN-lens coupled fiber optic, and detected by a single-photon counting avalanche photodiode.
The separation was performed in a buffer consisting of 10 mM sodium tetraborate, 35 mM sodium deoxycholate, and 5 mM methyl-β-cyclodextrin. The sample was injected eletrokinetically (1 kV for 1 s) and the separation voltage was 18 kV. The signal was recorded at 50 Hz on a PC. A 5-point median filter was used to remove spikes and a Gaussian filter with a 0.2 s full width at half height was used to smooth the data. A nonlinear least-squares routine was used to fit a Gaussian function to the peak.
Safety
Plasmodium requires handling under level 2 biosafety level. The blood samples were obtained from an anonymous, healthy donor; standard handling conditions for blood-bourn diseases were employed.
Results and discussion
Fluorescence microscopy
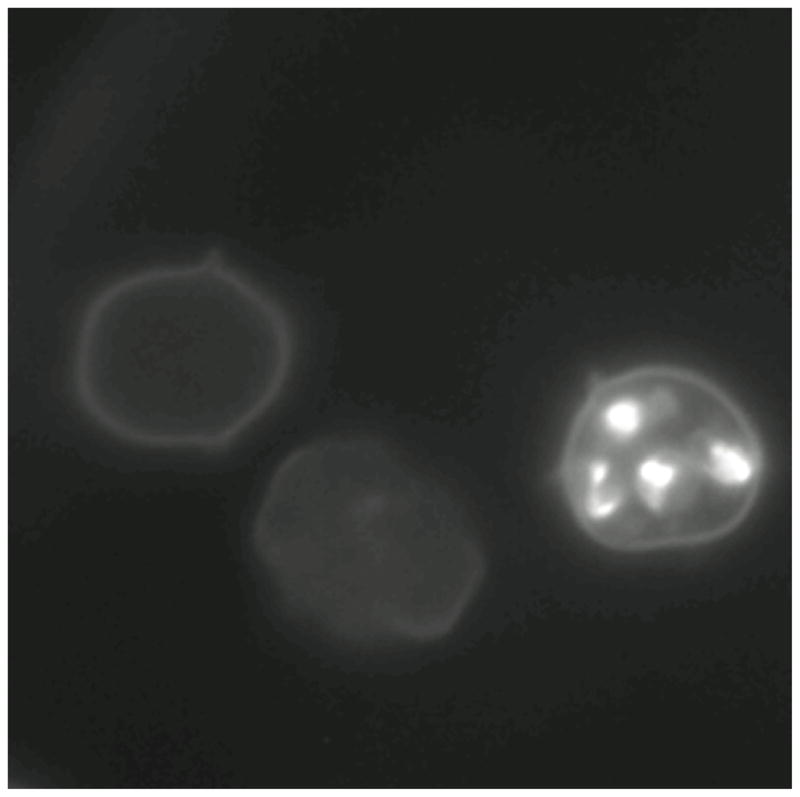
Figure 1 presents a fluorescent micrograph of three erythrocytes that had been incubated with GM1-TMR for 24 hours. The cells came from the same dish, which was generated at a low parasitemia level where only a small percentage of cells was infected. Two uninfected cells show a faint fluorescence halo, presumably due to minor accumulation of the fluorescent sphingolipid in the cell membrane. A control culture of uninfected cells presents the same halo.
Figure 1.

Fluorescent micrograph of Plasmodium falciparum iRBCs after 24 hours incubation with GM1-TMR.
In contrast, an iRBC shows four bright spots due to the uptake of the reagent by the malaria parasite. This image shows that the GM1-TMR is not only taken up by erythrocytes, but that it is also transported to the parasite, where it is concentrated. This result is slightly surprising since GM1 is not known to be a native sphingolipid in P. falciparum. Nevertheless, the reagent passes the blood-cell membrane and accumulates in the parasite. This image suggests that the GM1-TMR could be used as a fluorescent stain for the malaria parasite.
Capillary electrophoresis
We analyzed the lysate of GM1-TMR-treated iRBCs using capillary electrophoresis with laser-induced fluorescence detection. Unfortunately, the electropherograms from the infected and uninfected cells were similar, particularly at low parasitemia levels. The fluorescent background halo observed from the large number of uninfected cells generated a peak that swamped the fluorescence generated by the parasites.
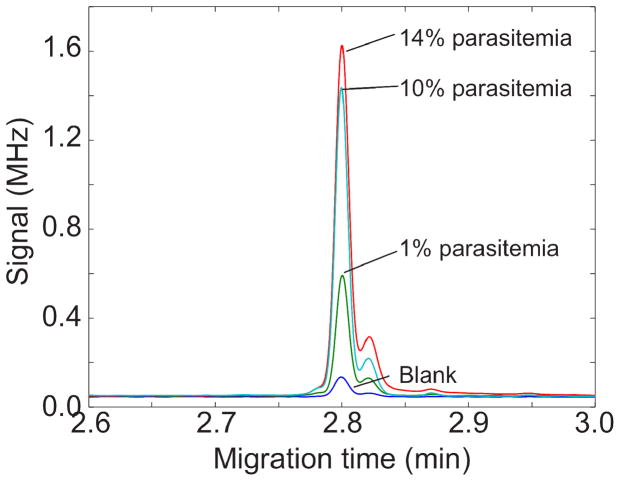
To reduce the background signal, we treated the cells with saponin, which lyses red blood cells but keeps the parasite intact.19–20 After washing to remove much of the background reagent, the parasites are lysed. Figure 2 presents electropherograms from uninfected erythrocytes and erythrocytes with 1, 10, and 14% parasitemia. In all cases, the cells were incubated with the fluorescent sphingolipid before lysis. The blank was generated from uninfected cells. The electropherograms consist of a large reagent peak and a much smaller and slower migrating impurity peak, which is presumably the trimethylrhodamine derivative. The separation is reasonably efficient, routinely generating over 250,000 plates. Table 1 summarizes the results from triplicate electropherograms at each parasitemia level.
Figure 2.
Electropherograms of the lysate from GM1-TMR treated uninfected erythrocytes (blank) and from 1, 10, and 14% parasitemia. Electropherograms shifted to align peaks. Y axis units are in millions of photocounts per second.
Table 1.
Results of electrophoresis analysis of iRBCs
| Parasitemia | peak height (MHz) (N = 3) | peak area (Mcounts) (N = 3) | signal-to-noise | plate count |
|---|---|---|---|---|
| 0% | 0.10 ± 0.02 | 1.7 ± 0.3 | 170 ± 80 | 250,000 ± 10,000 |
| 1% | 0.51 ± 0.02 | 7.9 ± 0.3 | 900 ± 100 | 290,000 ± 10,000 |
| 10% | 1.59 ± 0.10 | 25 ± 2 | 2400 ± 600 | 280,000 ± 20,000 |
| 14% | 1.50 ± 0.13 | 23 ± 2 | 2100 ± 900 | 300,000 ± 10,000 |
The extent of infection is expressed in terms of parasitemia, which is the fraction of red blood cells that are infected. Parasitemia is determined by microscopic observation of dried blood films that has been treated with Giemsa or Wright’s stain. Infection levels range from 0.0001% to over 10%, and the World Health Organization includes a parasitemia level greater than 0.2% for severe malaria. Measurement of low parasitemia levels is challenging; up to 300 microscope fields must be examined to determine a negative result.
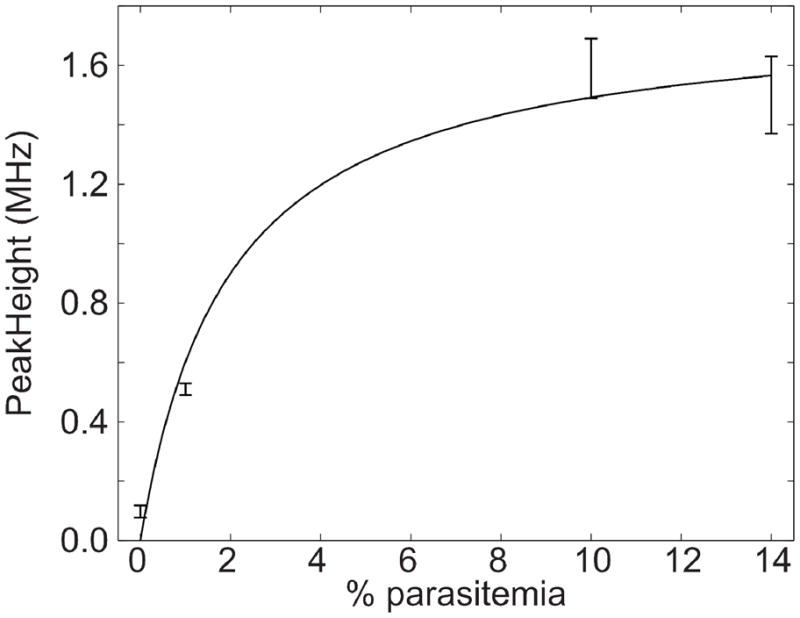
Control cells generate a relatively modest peak height, which increased significantly for 1% parasitemia levels (P=1-1×10⁻⁵). The peak area appears to saturate for modest parasitemia levels, figure 3. We fit the data with a saturation equation
Figure 3.

Plot of peak height versus % parasitemia. Peak height was obtained by using a nonlinear least squares routine to fit a Gaussian function to the data of Figure 2. Error bars are ± one standard deviation from three electrophoretic replicates. The smooth curve is a weighted nonlinear least-squares fit of a saturation function to the data.
The result of the nonlinear regression analysis is shown as the smooth curve in the figure. The signal appears to saturation for parasitemia levels greater than a few percent, possibly due to exhaustive extraction of the reagent by the parasites. The peak generated by the 1% parasitemia cells was twenty standard deviations larger than the peak generated by the blank, which suggests that parasitemia levels approaching a part per thousand can be detected with this technology.
Conclusions
We make several conclusions from these results. First, the fluorescently labeled sphingolipid is taken up by erythrocytes and accumulated by the parasite. Second, the parasite takes-up the labeled sphingolipid at much higher concentration than red blood cells. Third, the labeled sphingolipid is a stain for the malaria parasite, which may have some value in microscopy. Fourth, the modest background due to erythrocyte take-up of the labeled sphingolipid interferes in the use of capillary electrophoresis analysis of iRBCs at low parasitemia levels. Fifth, selective lysis of red blood cells, followed by washing of the intact parasites, reduces the background significantly, allowing use of capillary electrophoresis to detect parasitemia levels of a few parts-per-thousand. Finally, there is no evidence for metabolism of the labeled sphingolipid. This later conclusion is not surprising; GM1 is not known to be produced by the malaria parasite, and there is no reason to expect the presence of either catabolic or anabolic enzymes that act on this substrate within the organism.
It will be of great interest to repeat this experiment with fluorescently labeled glycosyl-ceramide and sphingomyelin. These compounds are endogenous in P. falciparum, and their metabolism could be tracked by capillary electrophoresis with ultrasensitive laser-induced fluorescence detection, which may be of value in screening libraries for inhibitors of glycolipid metabolism.
Finally, we should mention that flow cytometry would not be a useful alternative screening technology. Flow cytometry provides information on uptake, but is silent on metabolism. A metabolic cytometry technique is required to monitor the effects of a drug on metabolic pathways.
Literature Cited
- 1.Snow RW, Guerra CA, Noor AM, Myint HY, Hay SI. Nature. 2005;434:214–217. doi: 10.1038/nature03342. [DOI] [PMC free article] [PubMed] [Google Scholar]
- 2.Miller LH, Baruch DI, Marsh K, Doumbo OK. Nature. 2002;415:673–679. doi: 10.1038/415673a. [DOI] [PubMed] [Google Scholar]
- 3.Bryce J, Boschi-Pinto C, Shibuya K, Black RE WHO Child Health Epidemiology Reference Group. Lancet. 2005;365:1147–1152. doi: 10.1016/S0140-6736(05)71877-8. [DOI] [PubMed] [Google Scholar]
- 4.Ridley RG. Nature. 2002;415:686–693. doi: 10.1038/415686a. [DOI] [PubMed] [Google Scholar]
- 5.Lauer SA, Ghori N, Haldar K. Proc Natl Acad Sci U S A. 1995;92:9181–9185. doi: 10.1073/pnas.92.20.9181. [DOI] [PMC free article] [PubMed] [Google Scholar]
- 6.Lawrence CW, Cenedella RJ. Exp Parasitol. 1969;26:181–186. doi: 10.1016/0014-4894(69)90110-6. [DOI] [PubMed] [Google Scholar]
- 7.Haldar K, Uyetake L, Ghori N, Elmendorf HG, Li WL. Mol Biochem Parasitol. 1991;49:143–156. doi: 10.1016/0166-6851(91)90137-u. [DOI] [PubMed] [Google Scholar]
- 8.Ansorge I, Jeckel D, Wieland F, Lingelbach K. Biochem J. 1995;308(Pt 1):335–341. doi: 10.1042/bj3080335. [DOI] [PMC free article] [PubMed] [Google Scholar]
- 9.Haldar K. Trends Cell Biol. 1996;6:398–405. doi: 10.1016/0962-8924(96)10032-5. [DOI] [PubMed] [Google Scholar]
- 10.Gerold P, Schwarz RT. Mol Biochem Parasitol. 2001;112:29–37. doi: 10.1016/s0166-6851(00)00336-4. [DOI] [PubMed] [Google Scholar]
- 11.Fishman PH, Bradley RM, Hom BE, Moss J. J Lipid Res. 1983;24:1002–1011. [PubMed] [Google Scholar]
- 12.Ghidoni R, Fiorilli A, Trinchera M, Venerando B, Chigorno V, Tettamanti G. Neurochem Int. 1989;15:455–465. doi: 10.1016/0197-0186(89)90164-2. [DOI] [PubMed] [Google Scholar]
- 13.Riboni L, Bassi R, Conti M, Tettamanti G. FEBS Lett. 1993;322:257–260. doi: 10.1016/0014-5793(93)81582-k. [DOI] [PubMed] [Google Scholar]
- 14.Pagano RE, Martin OC. Biochemistry. 1988;27:4439–4445. doi: 10.1021/bi00412a034. [DOI] [PubMed] [Google Scholar]
- 15.Pagano RE, Watanabe R, Wheatley C, Chen CS. Chem Phys Lipids. 1999;102:55–63. doi: 10.1016/s0009-3084(99)00075-4. [DOI] [PubMed] [Google Scholar]
- 16.Marks DL, Singh RD, Choudhury A, Wheatley CL, Pagano RE. Methods. 2005;36:186–195. doi: 10.1016/j.ymeth.2004.12.001. [DOI] [PubMed] [Google Scholar]
- 17.Haldar K, Uyetake L, Ghori N, Elmendorf HG, Li WL. Mol Biochem Parasitol. 1991;49:143–156. doi: 10.1016/0166-6851(91)90137-u. [DOI] [PubMed] [Google Scholar]
- 18.Larsson EA, Olsson U, Whitmore CD, Martins R, Tettamanti G, Schnaar RL, Dovichi NJ, Palcic MM, Hindsgaul O. Carbohydr Res. 2007;342:482–489. doi: 10.1016/j.carres.2006.10.002. [DOI] [PMC free article] [PubMed] [Google Scholar]
- 19.Siddiqui WA, Kan SC, Kramer K, Richmond–Crum SM. Bull World Health Organ. 1979;57(Suppl 1):75–82. [PMC free article] [PubMed] [Google Scholar]
- 20.Ansorge I, Jeckel D, Wieland F, Lingelbach K. Biochem J. 1995;308:335–341. doi: 10.1042/bj3080335. [DOI] [PMC free article] [PubMed] [Google Scholar]
- 21.Whitmore CD, Hindsgaul O, Palcic MM, Schnaar RL, Dovichi NJ. Anal Chem. 2007;79:5139–5142. doi: 10.1021/ac070716d. [DOI] [PubMed] [Google Scholar]
- 22.Whitmore CD, Prendergast J, Essaka D, Hindsgaul O, Palcic MP, Schnaar RL, Dovichi NJ. In: Chemical Cytometry: Ultrasensitive Analysis of Single Cells. Lu C, editor. Wiley-VCH; 2010. pp. 21–30. [Google Scholar]
- 23.Whitmore CD, Olsson U, Larsson EA, Hindsgaul O, Palcic MM, Dovichi NJ. Electrophoresis. 2007;28:3100–3104. doi: 10.1002/elps.200700202. [DOI] [PubMed] [Google Scholar]
- 24.Chen DY, Dovichi NJ. Anal Chem. 1996;68:690–696. [Google Scholar]
- 25.Whitmore CD, Essaka D, Dovichi NJ. Talanta. 2009;80:744–748. doi: 10.1016/j.talanta.2009.07.060. [DOI] [PMC free article] [PubMed] [Google Scholar]


