

Abstract
Alagille syndrome, a chronic hepatobiliary disease, is characterized by paucity of intrahepatic bile ducts (IHBDs). To determine the impact of Notch signaling specifically on IHBD arborization we studied the influence of both chronic gain and loss of Notch function on the intact three-dimensional IHBD structure using a series of mutant mouse models and a resin casting method. Impaired Notch signaling in bi-potential hepatoblast progenitor cells (BHPCs) dose-dependently decreased the density of peripheral IHBDs, whereas activation of Notch1 results in an increased density of peripheral IHBDs. While Notch2 has a dominant role in IHBD formation there is also a redundant role for other Notch receptors in determining the density of peripheral IHBDs. Since changes in IHBD density do not appear to be due to changes in cellular proliferation of bile duct progenitors, we suggest that Notch plays a permissive role in cooperation with other factors to influence lineage decisions of BHPCs and sustain peripheral IHBDs.
Conclusion
There is a threshold requirement for Notch signaling at multiple steps, IHBD tubulogenesis and maintenance, during hepatic development that determines the density of three-dimensional peripheral IHBD architecture.
Keywords: Alagille, cholangiocyte, RBP-JK, resin casting, Albumin-Cre
Notch signaling is an evolutionarily conserved intercellular signaling pathway required for cell specification, lineage commitment and maintenance of stem/progenitor cells, both during development and in adults (1). Altered Notch signaling may lead to impairment of tissue development and function (2) due to precocious differentiation of progenitor cell populations. In humans, mutations in both JAGGED1 (JAG1) and NOTCH2, a Notch pathway ligand and receptor respectively, cause Alagille syndrome (AGS) (3–5). AGS is an autosomal dominant disorder that is primarily characterized by neonatal jaundice, cholestasis and paucity of IHBDs, although AGS patients also may have characteristic facies along with abnormalities of heart, eye, skeleton, vasculature, kidney and pancreas (6).
In mammals, four Notch receptors (Notch1 [N1], N2, N3 and N4) transduce signals from two families of ligands (Jagged1 [Jag1], Jag2, Delta-like-1 [Dll1], Dll3, and Dll4) expressed on the surface of neighboring cells. Previously it has been shown that both N1 and N2 are essential for embryonic development (7–9), since mice that globally lack these receptors die early during embryonic development. In contrast, N3 and N4 are not essential, since mice lacking these receptors are viable (10,11). However, when either N1 or N2 are deleted, N3 and N4 exhibit various degrees of redundant function (12).
It has previously been observed that mice that are heterozygous for both a null Jag1dDSL allele and for a hypomorphic N2swl1 mutation partially recapitulate AGS (13). These mice exhibit liver defects (jaundice and bile duct paucity) as well as other abnormalities that characterize AGS in humans. More recent experiments have begun to explore the effects of changing Notch signaling specifically in liver. These studies suggest that mutations in either Jag1 or N2, but not in N1, are the cause of IHBD morphogenetic defects (14–16). Additionally, loss of RBP-JK (DNA-binding partner for all Notch receptors) or activation of either N1 or N2 elicits reduced or excessive ductal plate structures, respectively (17,18).
While the specific Notch ligands and receptors that are responsible for defects in AGS patients is becoming clear, our understanding of how reduction of Notch signaling below a critical threshold causes defects in IHBD structure is not understood. For instance, it is not clear whether levels of Notch activity influence IHBD defects due to change in cell fate determination, altered cellular proliferation or maintenance of the bile duct structure. It is also unresolved as to whether different sensitivities to Notch signaling levels exist for specific IHBDs in the three-dimensional IHBD architecture.
To systematically analyze contribution of Notch signaling to formation and patterning of mouse biliary system we used a Cre-LoxP strategy to specifically inactivate and activate Notch signaling within BHPCs. The ability to view and assess regional differences within the IHBD system was enhanced by use of a resin casting method. We observed 1) dose-dependent reductions of peripheral IHBD branches in BHPC-specific deletion of N2 alone, both N2 and N1 receptors, and RBP-JK, suggesting redundant roles for N1, N3 and/or N4, 2) increased density of IHBDs when N1 is activated in BHPCs and 3) different underlying two-dimensional cytokeratin phenotypes as a result of varying Notch signaling dosage. Together, these findings indicate that Notch signaling is required at different thresholds for multiple steps of peripheral IHBD formation.
Materials and Methods
Mouse lines
On a CD1 background, mice carrying Albumin-Cre transgene (Alb-Cre)(19) crossed with conditional deletion alleles for N1 (Notch1flox/flox, N1 KO)(12), N2 (Notch2flox/flox, N2 KO)(20), RBP-JK (RBP-JKflox/flox, RBP KO)(21), conditional activation allele for N1 (ROSANotch1, NICD)(22) and ROSA26 reporter allele (R26R)(23). Further crosses performed to obtain homozygous genotypes. Genotyping performed by PCR analysis using previously published primer pairs. All breeding and experimental procedures done with prior approval by Vanderbilt Institutional Animal Care and Use Committee. Infection with Helicobacter hepaticus ruled out by testing fecal samples for bacterial DNA by PCR.
Serum Chemistry
Blood collected post-mortem. ALT and TB colorimetric endpoint assays performed on serum (TecoDiagnostics; Anaheim, CA).
Resin Casting
Mice sacrificed and common bile duct (CBD) isolated and cannulated above pancreas using stretched polyethylene-10 tubing. Cannulae secured in CBD by ligature of 5.0 silk. PBS manually flushed through CBD to ensure proper cannulation. 1mL of liquid Mercox II resin (Ladd Industries; Williston, VT) mixed with 0.1g of catalyst. Resin mixture injected by retrograde, manual perfusion into CBD until resistance met. Cannula removed and CBD ligated. Whole liver resected from abdominal cavity and floated in warm tap water for 10–30 minutes for curing. Individual lobes separated and placed in 15% KOH overnight at room temperature to macerate tissue. Casts rinsed with water and allowed to dry before imaging using Leica MZ 16 FA stereoscope and QImaging RETIGA 4000R camera.
RNA preparation and Quantitative Real-Time PCR
Total RNA prepared using TRIZOL (Invitrogen; Carlsbad, CA) and Turbo DNA-Free kit (Ambion; Austin, TX). 2.5µg of total RNA was used in cDNA synthesis performed with SuperScript III First-Strand (Invitrogen; Carlsbad, CA). qRT-PCR carried out using ABI Prism 7900. N1, N2, N3, N4 and Hes1 mRNA measured from three independent samples per genotype run in triplicate. Primer sequences in Supplementary Table 1.
Beta-galactosidase Activity and Immunohistochemistry
Liver tissue fixed for 4–6 hours at 4°C in 4% formaldehyde. To detect beta-galactosidase activity, tissue washed in PBS, equilibrated in 30% sucrose and embedded in O.C.T. (Ted Pella; Redding, CA). Frozen 10µM sections incubated with 2mM MgCl2, 5mM K3, 5mM K4, 0.1% Triton-X 100 and 1mg/ml X-Gal in PBS and color development monitored. Sections post-fixed and counterstained with nuclear fast red (Newcomer Supply; Middleton, WI). For immunohistochemistry, paraffin embedded tissue sectioned at 6µM. Proteinase K (Dako; Carpinteria, CA) used for antigen retrieval. Sections incubated with primary antibody overnight at 4°C in 1% BSA, and then incubated with appropriate secondary antibodies overnight at 4°C diluted in 1% BSA (Supplementary Table 2). For Biotin-SP conjugated anti-IgG, R.T.U. Vectastain Elite Universal ABC kit (Vector; Burlingame, CA) developed using the substrate DAB (Vector). For immunofluorescence, Biotin-SP conjugated anti-IgG used with Streptavidin conjugated CY3 (Jackson ImmunoResearch; West Grove, PA) or Alexa 488 (Invitrogen; Carlsbad, CA) and Peroxidase conjugated anti-IgG used with Tyramide-FITC (Perkin Elmer; Waltham, MA) at 1:300. Images acquired using Axioplan2 microscope and QImaging RETIGA EXi camera.
Proliferation Analysis
BrdU (Sigma; St. Louis, MO) injected at 100 mg/kg body weight 1-hour prior to sacrifice at P15. For P30, BrdU administered at 1 mg/ml in drinking water for 4 days.
Results
The dosage of Notch signaling regulates three-dimensional IHBD architecture
To better understand pathophysiology of AGS, we characterized a series of mouse models that either disrupt or activate Notch signaling specifically within the BHPC-lineage using Cre-LoxP. An Albumin-Cre transgene (Alb-Cre), which expresses Cre in a BHPC-specific manner, enabled us to ask whether Notch signaling is required in hepatoblasts to regulate formation and maintenance of IHBD architecture. As previously reported (16), the Alb-Cre transgene is expressed in most or all hepatoblasts prior to differentiation and their derivatives (hepatocytes and cholangiocytes), as assessed by reporter analysis (Supplementary Fig. 1A,B). Since mature cholangiocytes do not express albumin (24), the results we observe are due to recombination having occurred in BHPCs prior to formation of IHBDs. Changes in Notch activity within the liver of these mouse models are exhibited through modulations of Hes1, a Notch target gene (Supplementary Fig. 2).
To circumvent limitations of serial sectioning and two-dimensional analysis, we used resin casting to examine the global three-dimensional structure of the IHBD system. Although this method may not resolve canals of Hering or bile canaliculi, the gross effects of both augmenting and impairing Notch signaling on three-dimensional architecture of the intact IHBD system are easily visualized. Figure 1 shows representative data from left lobe casts of each genotype at P120. The biliary system control casts (Fig. 1A,A’) demonstrate the level of detail attained. Major IHBDs, nomenclature outlined by Crawford (25), appear to be formed in a regular pattern.
Fig. 1. Three-dimensional resin casting of the biliary system reveals a role for Notch signaling in determining IHBD density.

A retrograde injection of a liquid resin/catalyst mix into the common bile duct was performed to obtain a three-dimensional cast of the biliary architecture. (A–E) Representative images of the ventral surface of the left lobe resin casts are shown with red squares to designate the area in A’–E’ at P120. (A,A’) Control mice [Alb-Cre], 10 full casts from 4 different familial crosses were analyzed. (B,B’) N2 KO, 6 full casts from 3 different familial crosses were analyzed. (C,C’) N1/N2 DKO, 3 full casts from 3 different familial crosses were analyzed. (D,D’) RBP KO, 6 full casts from 3 different familial crosses were analyzed. (E,E’) one copy of NICD, 5 full casts from 4 different familial crosses were analyzed. Loss of Notch signaling reveals dose-dependent loss of branch density, whereas constitutive activation of Notch signaling reveals an increase in branch density. Scale bar = 2mm.
Next, we examined IHBD resin casts of N1 KO, N2 KO or N1/N2 DKO mice conditionally deleted in liver by Alb-Cre (data not shown, Fig. 1B,C). As previously reported, N1 KO mice lack an observable phenotype (16). Examination of resin casts revealed that N2 KO or N1/N2 DKO mice properly form major branches of the biliary system. However, density of branches arising from major branches is diminished. Additionally, this approach uncovers a correlation with dosage of Notch receptors and IHBD density, as N1/N2 DKO IHBD casts are less dense than N2 KO casts. While N1/N2 DKO does not eliminate formation of branches radiating from major branches completely, distal branches are abnormal in appearance consistent with partial obstruction by a bile plug, correlating with a rise in TB and ALT (Fig. 1C’, Table 1). Resin casts are made by retrograde injection into the common bile duct; therefore we infer that abnormal structures are connected to main ductal branches. While quantitative genomic PCR of cells from hilar duct regions indicates that cells contributing to hilar IHBDs have deleted N1 and N2 (Supplementary Fig. 4), we cannot completely rule out that all cells contributing to the hilar ducts have undergone recombination.
Table 1. Serum Chemistry Analysis.
Serum was obtained from 2–4 month old mice of indicated genotypes and analyzed for Alanine Aminotransferase (ALT) and Total Bilirubin (TB).
| Genotype | n | ALT | n | TB |
|---|---|---|---|---|
| Control | 40 | 57.5 ± 5.5 | 37 | 1.2 ± 0.1 |
| N2 KO | 17 | 75.1 ± 14.4 | 15 | 1.0 ± 0.2 |
| N1N2 DKO | 13 | 95.5 ± 14.3 * | 12 | 2.2 ± 0.6 |
| RBP KO | 24 | 123.6 ± 14.4 ** | 17 | 2.1 ± 0.9 |
| NICD | 27 | 47.3 ± 3.2 | 23 | 0.9 ± 0.1 |
Values are mean (IU/L) ± standard error of the mean. p values are calculated by a one-way ANOVA with a Dunnett’s post-test comparing to control mice. Control values are pooled from littermate controls from all genetic backgrounds.
Next, to determine if any of the four Notch receptors play compensatory roles in the formation of biliary ducts we examined RBP KO mice that were conditionally deleted in BHPCs by Alb-Cre (Fig. 1D). Since RBP-JK is the DNA-binding partner required for all Notch receptors to activate target gene expression, this approach eliminates signaling from all Notch receptors. RBP KO mice had greater elevation of ALT levels (Table 1) suggesting severe IHBD structural defects. Consistent with this, casts from RBP KO mice exhibited an abnormal mesh-like appearance at distal portions of branches (Fig. 1D’). The density of branches arborizing from major branches appeared diminished compared to N1/N2 DKO mice, suggesting that this technique may have uncovered redundant function of N3 and/or N4. Indeed, real time PCR identified a significant increase in N3 and N4 mRNA levels in N1/N2 DKO and N1, N2, N3 and N4 mRNA levels in RBP KO mice at P15 (Fig. 2). These data thereby support the idea of a compensatory increase in available Notch receptor mRNA as levels of Notch activity decrease (Supplementary Fig. 3).
Fig. 2. Notch receptor mRNA expression increases as Notch signaling dosage decreases at P15.
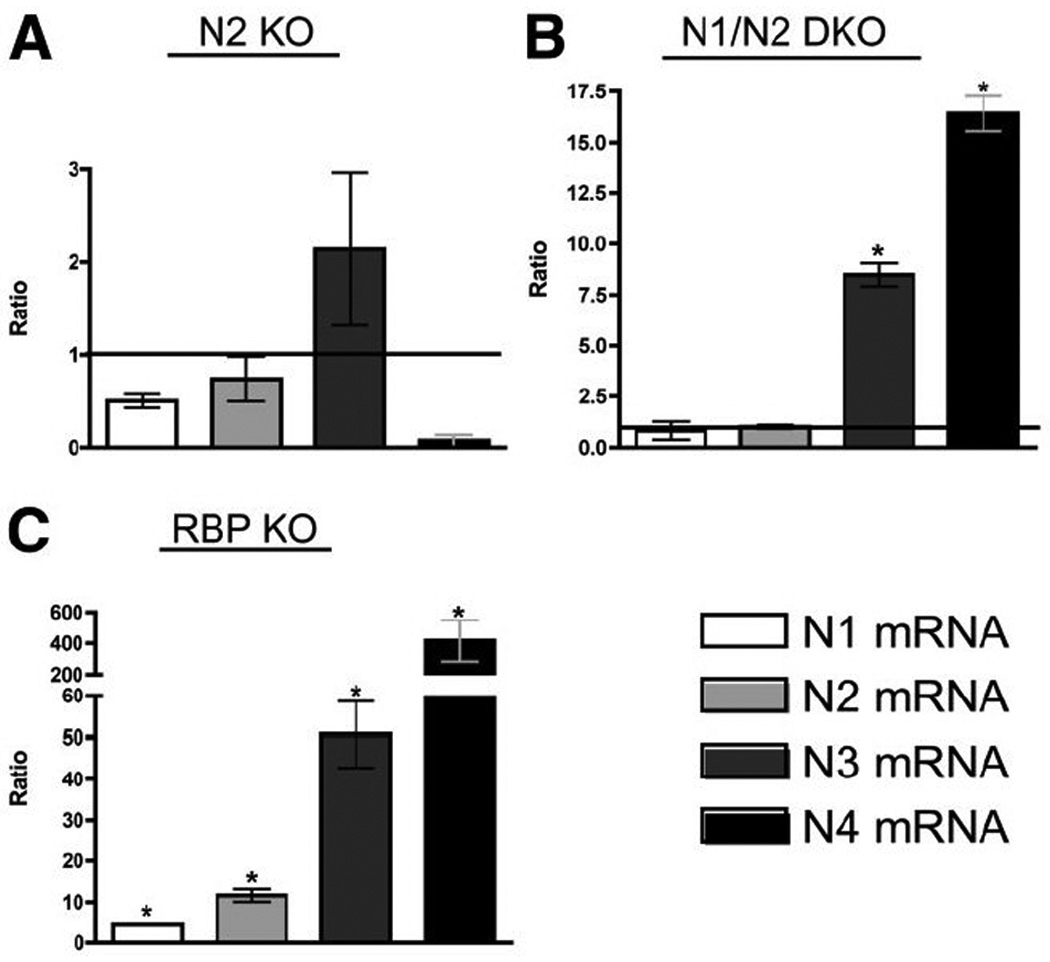
The relative expression ratio of Notch receptors was calculated using real-time PCR efficiency and the deviation in cycle threshold (Ct) of experimental versus control [without Alb-Cre] samples, expressed in comparison to HPRT mRNA levels. (A) In N2 KO, there are no significant changes in receptor mRNA. (B) In N1/N2 DKO there is significantly higher N3 and N4 mRNA being transcribed. (C) In RPB KO, all Notch receptors are significantly up-regulated, suggesting a feed-forward loop attempting to compensate for the loss of Notch signaling. Despite increased receptor expression, without RBP-JK, Notch receptors cannot activate downstream targets. Statistical analysis was performed using a one-way ANOVA with Tukey’s Multiple Comparison Test. Error bars are standard error of the mean. *P<0.05.
Since loss of Notch signaling within BHPCs results in reduced density of peripheral IHBDs, we hypothesized that Notch signaling is necessary and sufficient to regulate branch density. To determine whether Notch activation is sufficient to increase branch density, we activated N1 within BHPCs using a transgenic mouse line where the N1 intracellular domain (NICD) is inducibly expressed under control of the ubiquitously expressed ROSA26 locus. In mice overexpressing one copy of NICD, resin casts revealed a marked increase in IHBD density (Fig. 1E,E’).
Specified cytokeratin 19-positive cholangiocytes require Notch signaling to form patent IHBDs
To determine the underlying two-dimensional histopathology that correspond to the three-dimensional resin cast architecture, we evaluated whether cholangiocytes were present and remodeled into patent bile ducts when Notch signaling is either deficient or ectopically activated within BHPCs at P120. Cytokeratin 19 (CK19) was used as a cholangiocyte-lineage marker. In NICD mice, CK19+ cells are observed within large regions of hepatic parenchyma at P120 (Fig. 3E,J). Conversely, in RBP KO mice, which are entirely deficient in Notch signaling, fewer CK19+ cells are present at the periphery relative to control mice at P120 (Fig. 3F,I). Since loss of RBP-JK represents a state in which no Notch signals are transduced, this generates a situation in which potential redundant functions of N3 and/or N4 could be assessed. In agreement with previous findings (16), N2 KO and N1/N2 DKO mice at P120 have un-remodeled CK19+ cells at the periphery that do not resolve to form patent ducts (Fig. 3G,H). Therefore, cholangiocytes are specified when dosage of Notch signaling is reduced, but they are unable to undergo morphogenesis and are not eliminated at the periphery. In addition, un-remodeled CK19+ cells are maintained at least until P120, suggesting that this dosage of Notch signaling is sufficient for IHBD maintenance.
Fig. 3. Changes observed in CK19+ cholangiocyte organization upon alterations in Notch signaling at P120.

Immunostaining for CK19 localization in paraffin sections and counterstained with Mayer’s Hematoxylin. Genotypes designated within figure [control is Alb-Cre]. (A–E) Images obtained at the hilum. (F–J) Images obtained at the periphery. Arrows, bile ducts. Arrowheads, CK19+ cells that have not formed patent bile duct. Plus signs, regions void of CK19+ cells. Scale bar = 100 µm.
Modulations of Notch signaling in the BHPC-lineage cause alterations in IHBD development
To define how different dosages of Notch signaling within the BHPC-lineage are required to regulate IHBD formation, we examined changes in IHBD development in N1/N2 DKO, RBP KO and NICD mice between E16 to P30. Remodeling of ductal plates into IHBDs is thought to begin at the oldest ductal plates surrounding larger portal veins near the hilum and to move toward the periphery of liver lobes tracking the portal venous system (26). Our examination of Alb-Cre-mediated recombination suggests incomplete deletion or activation of floxed alleles when whole liver is assayed at E16 (Supplemental Fig. 2,3). Taking into consideration E16 correlates with initial ductal plate formation at the hilum, to explore differences between hilum and peripheral IHBD development, defined areas were analyzed as indicated in Supplemental Figure 5A,B. Delineation of these areas provides the ability to critically identify the regions as each area of hepatic lobe develops.
As previously described for N1/N2 DKO at late embryonic and early postnatal stages (16), ductal plates are able to form at hilar and peripheral regions, albeit irregular with few typical tubular lumens associated with portal veins (Supplementary Fig. 5C–F,K–N). At E16, ductal plates are also able to form in RBP KO, but visibly fewer wide-spectrum cytokeratin (wsCK)-positive (+) cells and tubular structures are associated with peripheral ductal plates at P3 (Fig. 4B,E). These observations are similar to AFP Cre-mediated deletion of RBP-JK (17). A clear peripheral IHBD phenotypic difference between N1/N2 DKO and RBP KO mice is apparent from P15. Un-remodeled wsCK+ cells persist at the periphery and have not remodeled into patent ducts in N1/N2 DKO mice, suggesting a developmental delay or failure to undergo tubulogenesis (Supplementary Fig. 5P,R). These un-remodeled wsCK+ cells at the periphery become further disorganized upon growth and expansion of hepatic lobes and were not remodeled up to 4 months of age (Fig. 3H), indicating that their failure to remodel is not a developmental delay. RBP KO mice have visibly fewer wsCK+ cells and patent bile ducts associated with portal veins from P3 to 4 months (Fig. 3,4). Hilar regions of both N1/N2 DKO and RBP KO mice have irregular biliary structures that are observed in association with portal inflammation (Supplementary Fig. 5J,6K). These results indicate that, following establishment of the ductal plate, N1 and N2 are necessary for tubulogenesis, but N3 and N4 are sufficient to maintain the un-remodeled wsCK+ cells. Further reduction of Notch signaling in RBP KO mice results in initiation and maintenance of fewer wsCK+ cells throughout liver postnatal growth and remodeling of the peripheral IHBDs.
Fig. 4. Morphological defects of wsCK+ cells in peripheral liver tissue upon BHPC-specific deletion of RBP-JK and activation of N1.
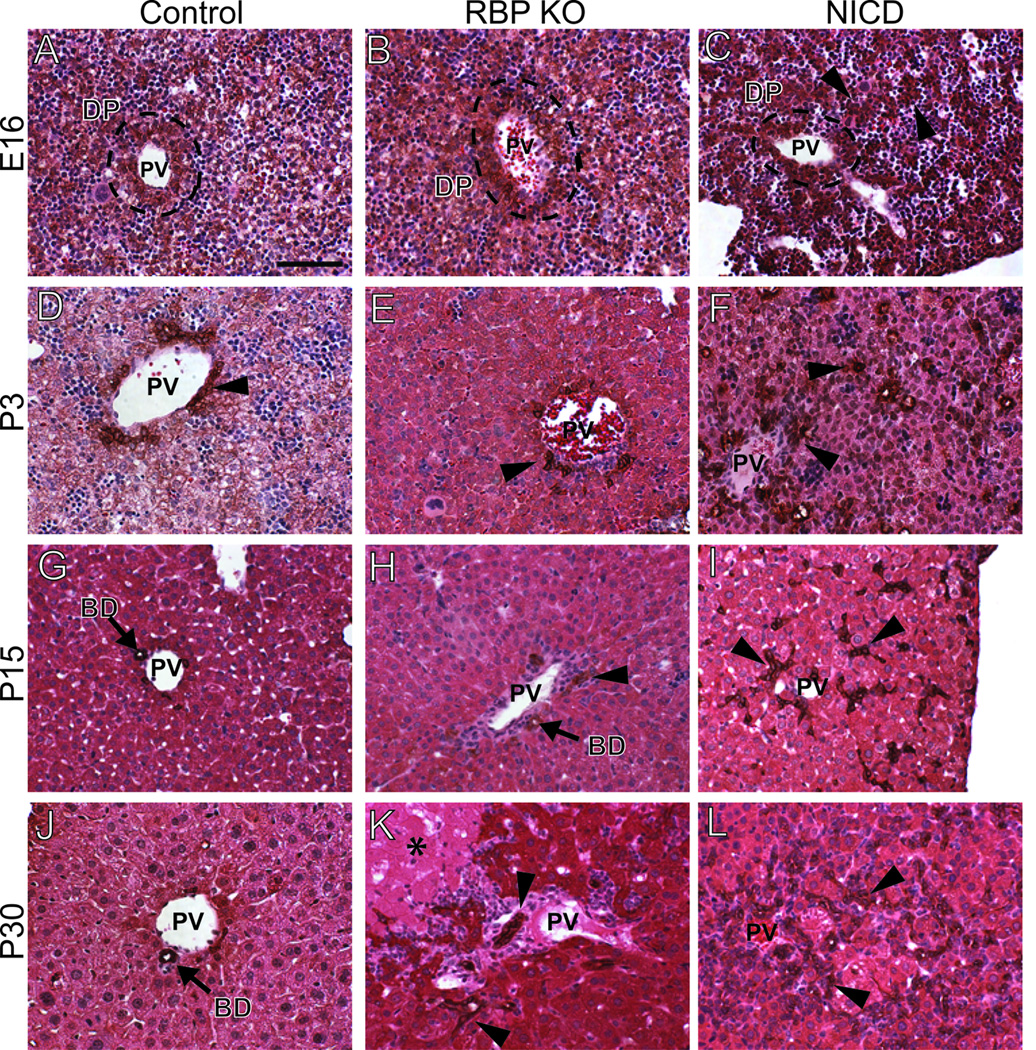
Paraffin sections from control [Alb-Cre] (A,D,G,J), RBP KO (B,E,H,K) and two copies of NICD (C,F,I,L) tissue, over a developmental time course, was immunostained for wsCK to mark cholangiocytes and counterstained with Hematoxylin and Eosin. Images were obtained from the periphery of the left liver lobe as illustrated in Supplementary Figure 5B. (A,B) At E16, control and RBP KO livers appear grossly identical, with wsCK+ cells contributing to a ductal plate. (D,E) At P3, it becomes difficult to locate wsCK+ bile ducts in RBP KO mice. (G,H,J,K) Fewer bile ducts are observed in RBP KO mice compared to control through P15 and P30. (C) At E16, NICD mice appear to have cords of wsCK+ cells radiating from the ductal plate. (F) By P3, these cells have begun to form tubules within the parenchyma. (I,L) The excess wsCK+ cells are maintained through P15 and P30. Arrowheads, ectopic wsCK+ cells. PV, portal vein. DP, ductal plate. BD, bile duct. Scale bar = 100 µm.
To determine if activation of N1 within BHPCs is sufficient to induce cholangiocytes in both hilar and peripheral regions, we examined wsCK+ cell localization in the hepatic parenchyma of NICD mice. At E16, wsCK+ cells were observed in ductal plate structures and non-ductal plate clusters throughout the lobule at both the hilum and periphery (Fig. 4C, Supplementary Fig. 6C). This demonstrates that N1, independent of N2, is sufficient to induce cholangiocyte differentiation independent of local periportal cues. As the postnatal hepatic expansion proceeds from P3 to 4 months, the ectopic wsCK+ cells do not regress and become confined periportally in large zonal regions (Fig. 3E,3J,4F,4I,4L). The ectopic tubular structures formed in the NICD mice are maintained as ducts, as the resin casts demonstrate an increased density of peripheral IHBDs (Fig. 1E).
Previously, it has been proposed that un-remodeled wsCK+ cells are a consequence of cholestasis, such as portal inflammation and bile duct proliferation (14). However, based on our finding (Supplementary Fig. 5) we suggest that un-remodeled progenitors in which Notch signaling is reduced, as in N2 KO and N1/N2 DKO mice, undergo precocious differentiation or become unable to receive cues to undergo further bile duct remodeling. Alternatively, neighboring hepatocytes lacking Notch may fail to produce a potential remodeling signal. Thus, to evaluate the role of proliferation in bile duct remodeling, we measured the proliferation rate of wsCK+ cells. Since there are few cholangiocytes in the cell cycle during tubulogenesis, as revealed by the ability of BHPCs to undergo tubulogenesis in culture in the presence of a DNA synthesis inhibitor (27), we measured incorporation of 5-bromo-2-deoxyuridine (BrdU), a thymidine analogue, into newly synthesized DNA strands after adding it to drinking water at P26. Mice were then analyzed at P30, when un-remodeled wsCK+ cells are present at the periphery (Supplementary Fig. 5R). By analyzing 13 different peripheral regions from two control mice, we estimate that 15.4% of wsCK+ cells normally proliferate over a four-day period. No significant difference was observed in the proliferation of wsCK+ cells at hilar or peripheral regions between mice with differing Notch dosage (Fig. 5L, Supplementary Table 3). However, a significant decrease in proliferation of wsCK+ cells at the periphery was observed in mice expressing activated N1 in BHPCs (Fig. 5L). This difference is due to overall increase in number of wsCK+ cells at the periphery and not a significant change in number of proliferating cells. Mice lacking Notch or containing constitutively active N1 analyzed at P15 with a single BrdU pulse do not exhibit any significant difference in ratios of proliferating to total wsCK+ cells (Fig. 5K, Supplementary Table 3). This implies that un-remodeled wsCK+ cells observed at P15 and P30 in mice deficient for Notch signaling do not arise from aberrant proliferation.
Fig. 5. BrdU incorporation indicates that modulations in Notch signaling do not affect the proliferation index of cholangiocytes.

(A–J) Representative sections from P30 mice labeled for 4 days with BrdU administered via drinking water. Paraffin sections were stained for wsCK to mark the cholangiocytes, BrdU to mark DNA replication and Hoechst to mark DNA. wsCK+ cells and double wsCK/BrdU+ cells were counted from regions in the hilum (A–E) and periphery (F–J). (K–L) Ratio of double positive to total wsCK+ cells, absolute numbers in Supplementary Table 3. (K) Peripheral analysis of P15 mice with 1-hour BrdU pulse. (L) Peripheral analysis of P26 mice administered BrdU for 4 days and sacrificed at P30. NICD mice have a significantly decreased percent proliferation as compared to control [Alb-Cre]. Arrowheads, representative dual-labeled cell. Percent proliferation was calculated per region analyzed and averaged. Statistical analysis was performed using a one-way ANOVA with Dunnett’s post-test. Error bars are standard error of the mean between individual regions. *P<0.05. Scale bar = 100 µm.
Discussion
Notch pathway dosage regulates the peripheral IHBD architecture
In this study, we adapted a resin casting technique to evaluate the sensitivity of three-dimensional IHBD architecture in mice to the absence of Notch signaling. By sequentially lowering the dosage of Notch signaling by eliminating N2, both N1 and N2, or all Notch signaling via deletion of the required DNA-binding partner RBP-JK, we observed a progressive decrease in density of branches arborizing from major bile ducts (Fig. 1). Our findings are consistent with prior studies showing a principal role for N2 in bile duct formation (15,16). However, a redundant role for N1 in the absence of N2 was revealed by use of resin casting. This result, in addition to more severely decreased density of the IHBD system upon RBP KO, suggests that N3 and/or N4 may also have partially redundant roles. This appears to be the case as decreased Notch dosage results in increased mRNA levels of N3 and N4 to compensate at P15, correlating with presence of peripheral un-remodeled wsCK+ cells (Fig. 2, Supplementary Fig. 5P).
We propose that the three-dimensional IHBD architectural results presented in this study provide explanations for the human pathophysiology of AGS patients. The major bile duct branches, as examined here, do not appear to be affected by decreased Notch signaling mediated by Alb-Cre. As in these mouse models, cases of AGS have been described with absence of bile ducts associated with cholestasis in peripheral areas, while hilar regions contain normally developed bile ducts (28). In addition, some older AGS patients present with scintigraphic patterns of prolonged retention of tracer in peripheral regions, but normal clearance in hilar regions (29). Therefore, either major IHBDs are not as sensitive to levels of Notch signaling or major IHBDs develop by a mechanism different from peripheral IHBDs.
Our mouse models similarly exhibit a disruption of peripheral bile duct formation in the setting of functionally formed hilar ducts (Fig. 1). This difference either suggests there is a key difference between mechanisms that determine formation of major branches and peripheral IHBDs, such as conducting, terminal and bile ductules radiating from major bile ducts, or that this difference may simply be a consequence of the timing of Alb-Cre mediated recombination in these experiments. Indeed, although Alb-Cre is expressed in BHPCs, recombination of Notch genes may occur after fate decisions that dictate formation of major bile duct branches has occurred. Analyzing expression levels of Notch receptors and Hes1 in whole liver samples at E16 suggests that some cells have undergone either deletion or activation of Notch signaling, as parenchymal and non-parenchymal cells within the liver have changed levels of Notch receptors and Hes1 expression compared to control samples (Supplemental Fig. 2,3). Quantitative genomic PCR of the N1 and N2 loci at P120 in our N1/N2 DKO mouse model indicates cells contributing to both hilar and peripheral bile duct regions have deleted N1 and N2 (Supplementary Fig. 4). Additionally, the earliest published deletion of Notch signaling, Foxa3-Cre mediated recombination of RBP-JK, results in fewer Sox9+ and CK19+ cells within ductal plate formations, but at least one bile duct per portal vein is still able to form (17). Therefore, regardless of the timing of the deletion with available mouse Cre-lines, major bile ducts are able to form in the absence of Notch signaling. All of this suggests that the three-dimensional architecture of the biliary system has different threshold requirements for Notch activity.
Notch plays a permissive role in the formation of IHBD
Previous studies have demonstrated sufficiency of activated N1 (NICD) expression in hepatoblast cultures to repress hepatocyte differentiation. In addition, NICD expression in combination with Matrigel treatment is able to induce the expression of cholangiocyte markers, although no morphological indications of tubular structures were formed (30). This suggests that a combination of signals in addition to Notch activation is required to direct duct formation subsequent to cholangiocyte specification from hepatoblasts. Our study supports this notion since ligand independent NICD expression, as achieved within BHPCs using Alb-Cre, promotes cholangiocyte differentiation, as assayed by non-proliferative ectopic wsCK+ cells within the parenchyma (Fig. 5K,L). However, these wsCK+ cells appear to be somewhat zonal as early as P3, more concentrated in periportal regions (Fig. 4F). Based on these results, we postulate Notch plays a permissive, not instructive, role within a competence zone, thereby inhibiting hepatocyte differentiation and allowing formation of ducts.
IHBD system requires Notch signaling at multiple steps at different thresholds
Different levels of Notch deficiency within BHPCs result in differing histopathological phenotypes, increased versus decreased wsCK+ and CK19+ cells at the hepatic periphery. N2 KO and N1/N2 DKO mice maintain un-remodeled wsCK+ cells at the periphery, which remain as non-tubular ductal plate structures (Supplementary Fig. 5). These cells could arise from precocious differentiation of cells within the ductal plate or proliferation of cholangiocytes, such as a ductular reaction, both resulting in too many cholangiocytes. We investigated the proliferation index of un-remodeled cytokeratin cells by analyzing the number of wsCK+ cells that are in the cell cycle over a four-day period at P30. Our analysis does not reveal excess proliferation (Fig. 5L), as previously proposed (14). Rather, our findings suggest that Notch deficient un-remodeled wsCK+ cells undergo precocious differentiation to a CK19+ cell fate that is unable either to receive cues for maturation steps, or for elimination if they are not incorporated into a bile duct. Further reduction of Notch activity in RBP KO mice reveals fewer cells contributing to ductal plates and reduced tubulogenesis (Fig. 4E). Indeed, these findings indicate that Notch activity is required at different levels for proper regression of the ductal plate and the process of IHBD tubulogenesis.
One hypothesis for the progressive loss of IHBDs observed in AGS patients has been attributed to a problem involving biliary system maintenance. Notably, excess wsCK+ cells are initiated and maintained in mice where N1 is activated within BHPCs (Fig. 3J,4C). Corroboratively, the excess cholangiocytes produced by the ectopic activation of N1 within BHPCs are able to remodel into ducts and are functionally connected to the extrahepatic biliary system as observed in the resin casts (Fig. 1E). Surprisingly, studies examining the potential of activated N2 within BHPCs, the fundamental IHBD receptor, indicate that N2 promotes tubulogenesis, but is not sufficient to maintain tubular structures outside the local portal environment into adulthood (18). Therefore, our observations demonstrate that N1 is not only sufficient to promote tubulogenesis, but is also sufficient to maintain bile ducts within a large competent periportal zone. From these data, we suggest that N1 may be the dominant receptor in the maintenance of tubular structures into adulthood. Further, our Notch dosage studies reveal that in the absence of N1 and N2, un-remodeled CK19+ cells are maintained at the periphery (Fig. 3G,H). This suggests that N3 and N4 have redundant roles in the ability to maintain CK19+ cells within the local periportal environment. Upon loss of all receptor activity, as in RPB-JK deletion in BHPCs, fewer wsCK+ cells are present at P120 as compared to control, however fewer cells are also present at early postnatal stages (Fig. 3I,4E), therefore, parsing out a specific maintenance defect in the absence of all Notch activity in the RBP KO mouse model is limited with current techniques.
To date, no mouse model has inactivated Notch signaling and disrupted all IHBD formation. This limits our ability to definitively affirm Notch signaling is required for cholangiocyte specification. Nonetheless by examining defined regions within the liver lobe in combination with three-dimensional structural analysis of IHBDs we were able to critically define a requirement for Notch signaling in peripheral IHBD formation and maintenance. Taken together, these results clearly demonstrate a dosage-sensitive Notch requirement within the BHPC-derived ductal plate for formation of peripheral IHBDs. However, to unequivocally determine whether Notch receptors are redundant in the context of IHBD formation, or if there are progenitor classes that form specific IHBD branches and require different Notch receptors, experiments that make use both of additional cellular markers and inducible, lineage-specific Cre mouse lines, will be necessary.
Supplementary Material
Paraffin sections from the left lobe of P30 control [Alb-Cre] (A), N1/N2 DKO (B) and RBP KO (C) mice were immunostained with wsCK and counterstained with Hematoxylin and Eosin. Images were obtained from the periphery as indicated in Supplementary Figure 5B. Arrows, wsCK+ cells. Asterisks, regions of necrotic tissue. Scale bar = 100 µm.
Panels show X-gal detection of Cre-induced recombination of the ROSA26-LacZ reporter allele in frozen sections with a nuclear fast red counterstain. (A) At embryonic day 16, hepatoblasts (arrow) stain blue indicating recombination of the reporter. Cells that are not X-gal positive are hematopoietic cells, as the liver is the major site of hematopoiesis at this age. (B) At postnatal day 30, the two derivatives of the BHPC-lineage, hepatocytes (arrow) and cholangiocytes (indicated BD), are X-gal positive. Cells that are not X-gal positive are non-BHPC-derived, forming the hepatic arteries, portal veins, central veins, mesenchymal cells surrounding the portal triad or the endothelial and stellate cells in the parenchyma. PV, portal vein. BD, bile duct.
The relative expression ratio of Hes1 was calculated using real-time PCR efficiency and the deviation in cycle threshold (Ct) of experimental versus control (without Alb-Cre) samples, expressed in comparison to HPRT mRNA levels. (A) At E16, N1/N2 DKO, RBP KO and NICD show increases in Hes1 mRNA expression, further supporting that Alb-Cre is beginning to express around this stage, and cells begin to compensate for the lack of Notch signaling. (B) By P15, the level of Hes1 has decreased in loss-of-function mutants, and increased in the gain-of-function mutant. Statistical analysis was performed using a one-way ANOVA with Tukey’s Multiple Comparison Test. Error bars are standard error of the mean. *P<0.05.
The relative expression ratio of Notch receptors was calculated using real-time PCR efficiency and the deviation in cycle threshold (Ct) of experimental versus control (without Alb-Cre) samples, expressed in comparison to HPRT mRNA levels. (A,C) At E16, N2 KO and RBP KO demonstrate no affect on Notch receptor mRNA expression. (B) In N1/N2 DKO, N1 and N3 are significantly increased, indicating that deletion is beginning around E16. Statistical analysis was performed using a one-way ANOVA with Tukey’s Multiple Comparison Test. Error bars are standard error of the mean. *P<0.05. **P<0.01.
Paraffin sections from the left lobe of control (N1flox/flox;N2flox/flox, A,C) and N1/N2 DKO (Alb-Cre; N1flox/flox; N2flox/flox, B,D) mice were rehydrated, Hematoxylin and Eosin stained, and dehydrated. Bile ducts, identified by morphology, from hilum (A–B) and periphery (C–D) [regions defined in Supplementary Figure 5B] were dissected (Veritas Microdissection System, CapSure Macro LCM Cap). Representative tissue region before (A–D) and after (A’–D’) capture. Dotted lines indicate specific region of capture. DNA was isolated from captured tissue using the Picopure kit (Arcturus). Three slides of two mice per genotype were captured. An average of 84 hilar and 164 peripheral regions were captured per animal and pooled for PCR analysis. Average capture area was 33.3µm and 36.2µm for hilum and periphery respectively. (E–F) Quantitative genomic PCR results of N1 (E) and N2 (F) deletion at the hilum and periphery demonstrate significant deletion at both regions. Primers used are listed in Supplementary Table 1. Statistical analysis was performed using a one-way ANOVA with Tukey’s Multiple Comparison Test. Error bars are standard error of the mean. *P<0.05. **P<0.01.
(A) Schematic of the left lobe from the ventral surface. The major branches of the biliary system are represented in orange. Dotted line illustrates a section through the lobe. (B) The representative schematic section of the left lobe is further defined by region, hilum (blue) and periphery (red). These regions indicate where hilar (C–J) and peripheral (K–R) images were obtained. D, dorsal. V, ventral. (C–R) Paraffin sections from control [Alb-Cre] (left panels in hilum and periphery) and N1/N2 DKO (right panels in hilum and periphery) tissue, over a developmental time course, was immunostained with wsCK to mark cholangiocytes and counterstained with Hematoxylin and Eosin. Arrowheads, unresolved ductal plate remnants. Asterisk, necrosis. PV, portal vein. DP, ductal plate. BD, bile duct. Scale bar = 100 µm.
Paraffin sections from control [Alb-Cre] (A,D,G,J), RBP KO (B,E,H,K) and two copies of NICD (C,F,I,L) tissue, over a developmental time course, was immunostained with wsCK to mark cholangiocytes and counterstained with Hematoxylin and Eosin. Images were obtained from the hilum of the left liver lobe as illustrated in Supplementary Figure 5B. (A–F) At E16 and P3, each genotype appears grossly identical, though NICD mice (C,F) have an increase in portal vein associated wsCK+ cells at this time. (I) By P15 an excess of wsCK+ cells become apparent in the parenchyma of NICD animals, which persist at P30 (L). Conversely, in the hilum of RBP KO mice, at P15 (H) and P30 (K), there is mild to moderate inflammation and bile ducts appear tortuous and distorted. Arrowheads, unresolved ductal plate remnants. PV, portal vein. DP, ductal plate. BD, bile duct. Scale bar = 100 µm.
Acknowledgments
The authors thank Tom Gridley, Tasuko Honjo, Rafi Kopan, Mark Magnuson, Doug Melton, and Phil Sorriano for providing mice; Melissa Langworthy, Anna Means, Drew Misfeldt and Lance Prince for technical aspects; Kevin Song for genotyping mice; Chin Chiang, Robert Coffey, Rafi Kopan, Anna Means, Nathan Mundell and Chris Wright for helpful comments and Mark Magnuson for thorough editing of the manuscript.
Financial Support:
These studies were supported by grants from the NIH to S.S.H. (RO1-DK078640) and to the Vanderbilt Digestive Disease Research Center (P30-DK058404) providing Core Services.
Abbreviations
- IHBD
intrahepatic bile duct
- BHPC
bi-potential hepatoblast progenitor cell
- AGS
Alagille syndrome
- RBP-JK
recombination signal binding protein
- NICD
Notch intracellular domain
- ALT
alanine aminotransferase
- TB
total bilirubin
- X-Gal
5-Bromo-4-Chloro-3-Indolyl β-D-Galactosidase
- BrdU
5-bromo-2-deoxyuridine
- IU
international units
- E
embryonic day
- P
postnatal day
- wsCK
wide-spectrum cytokeratin
- CK19
cytokeratin 19
References
- 1.Chiba S. Notch signaling in stem cell systems. Stem Cells. 2006;24:2437–2447. doi: 10.1634/stemcells.2005-0661. [DOI] [PubMed] [Google Scholar]
- 2.Hansson EM, Lendahl U, Chapman G. Notch signaling in development and disease. Seminars in Cancer Biology. 2004;14:320–328. doi: 10.1016/j.semcancer.2004.04.011. [DOI] [PubMed] [Google Scholar]
- 3.Li L, Krantz ID, Deng Y, Genin A, Banta AB, Collins CC, Qi M, et al. Alagille syndrome is caused by mutations in human Jagged1, which encodes a ligand for Notch1. Nature genetics. 1997;16:243–251. doi: 10.1038/ng0797-243. [DOI] [PubMed] [Google Scholar]
- 4.Oda T, Elkahloun AG, Pike BL, Okajima K, Krantz ID, Genin A, Piccoli DA, et al. Mutations in the human Jagged1 gene are responsible for Alagille syndrome. Nature genetics. 1997;16:235–242. doi: 10.1038/ng0797-235. [DOI] [PubMed] [Google Scholar]
- 5.McDaniell R, Warthen DM, Sanchez-Lara PA, Pai A, Krantz ID, Piccoli DA, Spinner NB. NOTCH2 Mutations Cause Alagille Syndrome, a Heterogeneous Disorger of the Notch Signaling Pathway. The American Journal of Human Genetics. 2006;79:169–173. doi: 10.1086/505332. [DOI] [PMC free article] [PubMed] [Google Scholar]
- 6.Emerick KM, Rand EB, Goldmuntz E, Krantz ID, Spinner NB, Piccoli DA. Features of Alagille syndrome in 92 patients: frequency and relation to prognosis. Hepatology. 1999;29:822–829. doi: 10.1002/hep.510290331. [DOI] [PubMed] [Google Scholar]
- 7.Conlon RA, Reaume AG, Rossant J. Notch1 is required for the coordinate segmentation of somites. Development. 1995;121:1533–1545. doi: 10.1242/dev.121.5.1533. [DOI] [PubMed] [Google Scholar]
- 8.Swiatek PJ, Lindsell CE, Amo FFd, Weinmaster G, Gridley T. Notch1 is essential for postimplantation development in mice. Genes Dev. 1994;8:707–719. doi: 10.1101/gad.8.6.707. [DOI] [PubMed] [Google Scholar]
- 9.Hamada Y, Kadokawa Y, Okabe M, Ikawa M, Coleman JR, Tsujimoto Y. Mutation in ankyrin repeats of the mouse Notch2 gene induces early embryonic lethality. Development. 1999;126:3415–3424. doi: 10.1242/dev.126.15.3415. [DOI] [PubMed] [Google Scholar]
- 10.Krebs LT, Xue Y, Norton CR, Shutter JR, Maguire M, Sundberg JP, Gallahan D, et al. Notch signaling is essential for vascular morphogenesis in mice. Genes & Development. 2000;14:1343–1352. [PMC free article] [PubMed] [Google Scholar]
- 11.Krebs LT, Xue Y, Norton CR, Sundberg JP, Beatus P, Lendahl U, Joutel A, et al. Characterization of Notch3-Deficient Mice: Normal Embryonic Development and Absence of Genetic Interactions With a Notch1 Mutation. Genesis. 2003;37:139–143. doi: 10.1002/gene.10241. [DOI] [PubMed] [Google Scholar]
- 12.Pan Y, Lin M-H, Tian X, Cheng H-T, Gridley T, Shen J, Kopan R. γ-Secretase functions through Notch Signaling to Maintain Skin appendages but Is Not Required for Their Patterning or Initial Morphogenesis. Developmental Cell. 2004;7:731–743. doi: 10.1016/j.devcel.2004.09.014. [DOI] [PubMed] [Google Scholar]
- 13.McCright B, Lozier J, Gridley T. A mouse model of Alagille syndrome: Notch2 as a genetic modifier of Jag1 haploinsufficiency. Development. 2002;129:1075–1082. doi: 10.1242/dev.129.4.1075. [DOI] [PubMed] [Google Scholar]
- 14.Loomes KM, Russo P, Ryan M, Nelson A, Underkoffler L, Glover C, Fu H, et al. Bile Duct Proliferation in Liver-Specific Jag1 Conditional Knockout Mice: Effects of Gene Dosage. Hepatology. 2007;45:323–330. doi: 10.1002/hep.21460. [DOI] [PubMed] [Google Scholar]
- 15.Lozier J, McCright B, Gridley T. Notch Signaling Regulates bile duct morphogenesis in Mice. PLoS ONE. 2008;3:e1851. doi: 10.1371/journal.pone.0001851. [DOI] [PMC free article] [PubMed] [Google Scholar]
- 16.Geisler F, Nagl F, Mazur PK, Lee M, Zimber-Strobl U, Strobl LJ, Radtke F, et al. Liver-specific inactivation of Notch2, but not Notch1, compromises intrahepatic bile duct development in mice. Hepatology. 2008;48:607–616. doi: 10.1002/hep.22381. [DOI] [PubMed] [Google Scholar]
- 17.Zong Y, Panikkar A, Xu J, Antoniou A, Raynaud P, Lemaigre F, Stanger BZ. Notch signaling controls liver development by regulating biliary differentiation. Development. 2009;136:1727–1739. doi: 10.1242/dev.029140. [DOI] [PMC free article] [PubMed] [Google Scholar]
- 18.Tchorz JS, Kinter J, Muller M, Tornillo L, Heim MH, Bettler B. Notch2 signaling promotes biliary epithelial cell fate specification and tubulogenesis during bile duct development in mice. Hepatology. 2009 doi: 10.1002/hep.23048. [DOI] [PubMed] [Google Scholar]
- 19.Postic C, Magnuson MA. DNA Excision in Liver by an Albumin-cre Transgene Occurs Progressively With Age. Genesis. 2000;26:149–150. doi: 10.1002/(sici)1526-968x(200002)26:2<149::aid-gene16>3.0.co;2-v. [DOI] [PubMed] [Google Scholar]
- 20.McCright G, Lozier J, Gridley T. Generation of new Notch2 mutant alleles. Genesis. 2006;44:29–33. doi: 10.1002/gene.20181. [DOI] [PubMed] [Google Scholar]
- 21.Han H, Tanigaki K, Yamamoto N, Kuroda K, Yoshimoto M, Nakahata T, Ikuta K, et al. Inducible gene knockout of transcription factor recombination signal binding protein-J reveals its essential role in T versus B lineage decision. International Immunology. 2002;14:637–645. doi: 10.1093/intimm/dxf030. [DOI] [PubMed] [Google Scholar]
- 22.Murtaugh LC, Stanger BZ, Kwan KM, Melton DA. Notch signaling controls multiple steps of pancreatic differentiation. Proceedings of the National Academy of Sciences of the USA. 2003;100:14920–14925. doi: 10.1073/pnas.2436557100. [DOI] [PMC free article] [PubMed] [Google Scholar]
- 23.Soriano P. Generalized lacZ expression with the Rosa26 Cre reporter strain. Nature genetics. 1999;21:70–71. doi: 10.1038/5007. [DOI] [PubMed] [Google Scholar]
- 24.Shiojiri N. Analysis of Differentiation of Hepatocytes and Bile Duct Cells in Developing Mouse Liver by Albumin Immunofluorescence. Development Growth and Differentiation. 1984;26:555–561. doi: 10.1111/j.1440-169X.1984.00555.x. [DOI] [PubMed] [Google Scholar]
- 25.Crawford JM. Development of the Intrahepatic Biliary Tree. Seminars in Liver Disease. 2002;22:213–226. doi: 10.1055/s-2002-34508. [DOI] [PubMed] [Google Scholar]
- 26.Lemaigre FP. Mechanisms of liver development: concepts for understanding liver disorders and design of novel therapies. Gastroenterology. 2009;137:62–79. doi: 10.1053/j.gastro.2009.03.035. [DOI] [PubMed] [Google Scholar]
- 27.Tanimizu N, Miyajima A, Mostov KE. Liver progenitor cells fold up a cell monolayer into a double-layered structure during tubular morphogenesis. Mol Biol Cell. 2009;20:2486–2494. doi: 10.1091/mbc.E08-02-0177. [DOI] [PMC free article] [PubMed] [Google Scholar]
- 28.Libbrecht L, Spinner NB, Moore EC, Cassiman D, Damme-Lombaerts RV, Roskams T. Peripheral Bile Duct Paucity and Cholestasis in the Liver of a Patient with Alagille Syndrome. American Journal of Pathology. 2005;29:820–826. doi: 10.1097/01.pas.0000161325.36348.25. [DOI] [PubMed] [Google Scholar]
- 29.Piccoli D, Mokadam NA, Heyman S. Hepatobiliiary scintigraphy in Alagile syndrome: diagnostic utility and physiological significance. Journal of Pediatr Gastroenterol Nutr. 1997;25:475. [Google Scholar]
- 30.Tanimizu N, Miyajima A. Notch signaling controls hepatoblast differentiation by altering the expression of liver-enriched transcription factors. Journal of Cell Science. 2004;117:3165–3174. doi: 10.1242/jcs.01169. [DOI] [PubMed] [Google Scholar]
Associated Data
This section collects any data citations, data availability statements, or supplementary materials included in this article.
Supplementary Materials
Paraffin sections from the left lobe of P30 control [Alb-Cre] (A), N1/N2 DKO (B) and RBP KO (C) mice were immunostained with wsCK and counterstained with Hematoxylin and Eosin. Images were obtained from the periphery as indicated in Supplementary Figure 5B. Arrows, wsCK+ cells. Asterisks, regions of necrotic tissue. Scale bar = 100 µm.
Panels show X-gal detection of Cre-induced recombination of the ROSA26-LacZ reporter allele in frozen sections with a nuclear fast red counterstain. (A) At embryonic day 16, hepatoblasts (arrow) stain blue indicating recombination of the reporter. Cells that are not X-gal positive are hematopoietic cells, as the liver is the major site of hematopoiesis at this age. (B) At postnatal day 30, the two derivatives of the BHPC-lineage, hepatocytes (arrow) and cholangiocytes (indicated BD), are X-gal positive. Cells that are not X-gal positive are non-BHPC-derived, forming the hepatic arteries, portal veins, central veins, mesenchymal cells surrounding the portal triad or the endothelial and stellate cells in the parenchyma. PV, portal vein. BD, bile duct.
The relative expression ratio of Hes1 was calculated using real-time PCR efficiency and the deviation in cycle threshold (Ct) of experimental versus control (without Alb-Cre) samples, expressed in comparison to HPRT mRNA levels. (A) At E16, N1/N2 DKO, RBP KO and NICD show increases in Hes1 mRNA expression, further supporting that Alb-Cre is beginning to express around this stage, and cells begin to compensate for the lack of Notch signaling. (B) By P15, the level of Hes1 has decreased in loss-of-function mutants, and increased in the gain-of-function mutant. Statistical analysis was performed using a one-way ANOVA with Tukey’s Multiple Comparison Test. Error bars are standard error of the mean. *P<0.05.
The relative expression ratio of Notch receptors was calculated using real-time PCR efficiency and the deviation in cycle threshold (Ct) of experimental versus control (without Alb-Cre) samples, expressed in comparison to HPRT mRNA levels. (A,C) At E16, N2 KO and RBP KO demonstrate no affect on Notch receptor mRNA expression. (B) In N1/N2 DKO, N1 and N3 are significantly increased, indicating that deletion is beginning around E16. Statistical analysis was performed using a one-way ANOVA with Tukey’s Multiple Comparison Test. Error bars are standard error of the mean. *P<0.05. **P<0.01.
Paraffin sections from the left lobe of control (N1flox/flox;N2flox/flox, A,C) and N1/N2 DKO (Alb-Cre; N1flox/flox; N2flox/flox, B,D) mice were rehydrated, Hematoxylin and Eosin stained, and dehydrated. Bile ducts, identified by morphology, from hilum (A–B) and periphery (C–D) [regions defined in Supplementary Figure 5B] were dissected (Veritas Microdissection System, CapSure Macro LCM Cap). Representative tissue region before (A–D) and after (A’–D’) capture. Dotted lines indicate specific region of capture. DNA was isolated from captured tissue using the Picopure kit (Arcturus). Three slides of two mice per genotype were captured. An average of 84 hilar and 164 peripheral regions were captured per animal and pooled for PCR analysis. Average capture area was 33.3µm and 36.2µm for hilum and periphery respectively. (E–F) Quantitative genomic PCR results of N1 (E) and N2 (F) deletion at the hilum and periphery demonstrate significant deletion at both regions. Primers used are listed in Supplementary Table 1. Statistical analysis was performed using a one-way ANOVA with Tukey’s Multiple Comparison Test. Error bars are standard error of the mean. *P<0.05. **P<0.01.
(A) Schematic of the left lobe from the ventral surface. The major branches of the biliary system are represented in orange. Dotted line illustrates a section through the lobe. (B) The representative schematic section of the left lobe is further defined by region, hilum (blue) and periphery (red). These regions indicate where hilar (C–J) and peripheral (K–R) images were obtained. D, dorsal. V, ventral. (C–R) Paraffin sections from control [Alb-Cre] (left panels in hilum and periphery) and N1/N2 DKO (right panels in hilum and periphery) tissue, over a developmental time course, was immunostained with wsCK to mark cholangiocytes and counterstained with Hematoxylin and Eosin. Arrowheads, unresolved ductal plate remnants. Asterisk, necrosis. PV, portal vein. DP, ductal plate. BD, bile duct. Scale bar = 100 µm.
Paraffin sections from control [Alb-Cre] (A,D,G,J), RBP KO (B,E,H,K) and two copies of NICD (C,F,I,L) tissue, over a developmental time course, was immunostained with wsCK to mark cholangiocytes and counterstained with Hematoxylin and Eosin. Images were obtained from the hilum of the left liver lobe as illustrated in Supplementary Figure 5B. (A–F) At E16 and P3, each genotype appears grossly identical, though NICD mice (C,F) have an increase in portal vein associated wsCK+ cells at this time. (I) By P15 an excess of wsCK+ cells become apparent in the parenchyma of NICD animals, which persist at P30 (L). Conversely, in the hilum of RBP KO mice, at P15 (H) and P30 (K), there is mild to moderate inflammation and bile ducts appear tortuous and distorted. Arrowheads, unresolved ductal plate remnants. PV, portal vein. DP, ductal plate. BD, bile duct. Scale bar = 100 µm.