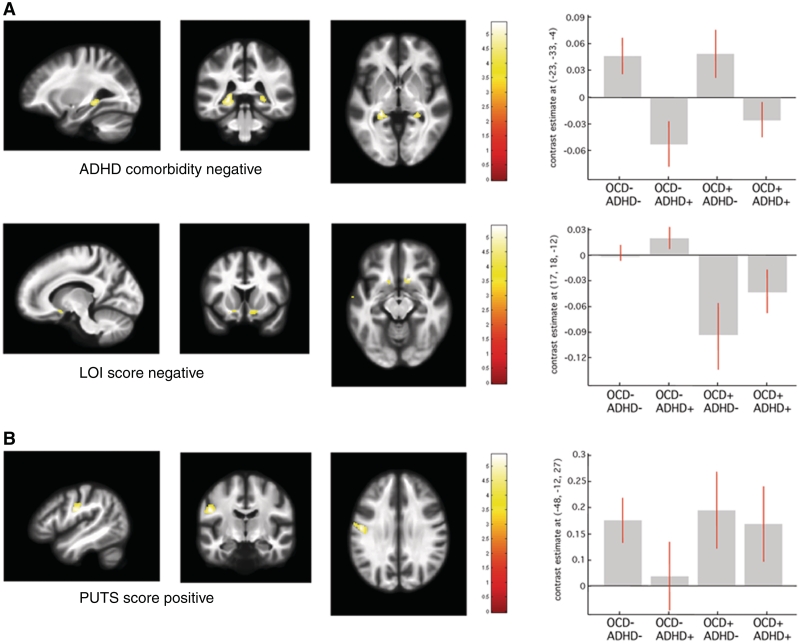
Figure 3.
Statistical parametric maps of significant grey matter volume change in the Tourette syndrome cohort superimposed for presentation purposes at P < 0.001, uncorrected on T1-weighted image. Right panel: regression coefficients (betas) extracted from the voxel of maximum intensity over Tourette syndrome sub-groups depending on the presence (+) or absence (−) of co-morbidity OCD/ADHD. (A) Grey matter volume reductions in patients with Tourette syndrome with ADHD and with obsessive-compulsive symptom severity increase [Leyton Obsessional Inventory (LOI) score]. (B) Grey matter volume expansions in patients with Tourette syndrome with symptom severity increase [premonitory urge for tics score (PUTS)]. [x, y, z] coordinates refer to the Montreal Neurological Institute standardized space. Colour scales on the right indicate t-values.

