Abstract
The liver performs a number of essential functions for life. The development of such a complex organ relies on finely regulated gene expression profiles which change over time in the development and determine the phenotype and function of the liver. We used high-density oligonucleotide microarrays to study the gene expression and transcription regulation at 14 time points across the C57/B6 mouse liver development, which include E11.5 (embryonic day 11.5), E12.5, E13.5, E14.5, E15.5, E16.5, E17.5, E18.5, Day0 (the day of birth), Day3, Day7, Day14, Day21, and normal adult liver. With these data, we made a comprehensive analysis on gene expression patterns, functional preferences and transcriptional regulations during the liver development. A group of uncharacterized genes which might be involved in the fetal hematopoiesis were detected.
Keywords: liver development, microarray, gene expression, function, transcriptional regulation
Background
The liver is one of the largest organs in the body and performs a number of complex functions essential to life. Functions of the liver range from converting glucose to glycogen, producing bile acids, to forming plasma proteins and filtering harmful substances from the blood.
In mouse, liver ontogeny begins around E9 (embryonic day 9). At E10.5 to E12.5, liver becomes a major site of fetal hematopoiesis [1]. Around E14.5, both hepatocytes and bile-duct epithelial cells develop from the bipotential hepatoblast [1]. As these hepatoblasts gradually become mature hepatocytes the main function of liver switches from hematopoiesis to metabolism [1; 2]. During liver development, gene expression profiles change over time and determine the phenotypes and functions of liver [3]. Elucidating molecular regulations in this developmental process is important for understanding liver functions and also useful for exploring liver diseases. High-throughput gene expression profiling techniques are well suited to reveal the expression changes in the developmental process.
We used high-density oligonucleotide microarrays to investigate gene expression profiles and studied the transcriptional regulation in mouse liver development. The gene expression data in this study were sampled from fetal mouse liver tissue at E11.5, E12.5, E13.5, E14.5, E15.5, E16.5, E17.5, E18.5, Day0 (the day of birth), Day3, Day7, Day14, Day21, and from a normal adult liver tissue. Hierarchical clustering on genes whose expressions changed by more than 1.5-fold during liver development uncovered two groups of genes with distinct temporal expression patterns. Genes in the first group have high expression mainly in the late stage of liver development and genes in the other group are mostly activated in the early stage. GO biological function analyses on the elevated and inhibited genes at each time point reveal that in early embryo development, cell-cycle-related genes are highly expressed; around the birth, defence-related genes are activated; and liver-function-related TFs and genes are highly activated in the later stage of development. Transcriptional regulation which controls the gene expression in a tissue-specific and quantitative manner is a major regulatory mechanism in embryonic developmental processes. In order to identify transcriptional mechanisms involved in these development stages, a computational approach was used to identify the regulatory motifs that associated with the elevated and inhibited gene expression at each time point. With these identified TFs, regulatory networks during mouse liver development were constructed.
Results and Discussion
Differential expression pattern in mouse liver development
Embryonic liver development goes through progressive series of steps starting from the gastrula stage of embryogenesis [2]. Transcriptional activities of genes are expected to be enhanced or inhibited to regulate the abundance of gene products responsible for their concerted functions during development. Transcription profiles at different time points provide us novel insights into groups of genes important to mouse liver development. To filter genes which do not show significant change in expression during liver development, we select genes with expression values at any time point at least higher than 1.5-fold or lower than 1/1.5-fold compared to the average (the mean expression value of all 14 time points) for further analyses. This gives 8640 genes in total, the list of which can be found in Supplementary Table S1. To verify the microarray profiling, semi-quantitative Reverse Transcription PCR (RT-PCR) is performed to analyze the expression of four genes, alpha-fetoprotein (Afp), glucose-6-phosphatase (G6pc), tyrosine aminotransferase (Tat), and albumin (Alb) in different stages of mouse liver development. Semi-quantitative RT-PCR results show that the expression of Afp starts in early fetal liver (at least from E11.5) and nearly can’t be detected in adult liver. The expression of G6pc and Tat start in late fetal liver (E17.5). The expression of Alb ranges from E11.5 to adult liver, which covers all developmental stages of mouse liver. Expression profiles got by microarray and Semi-quantitative RT-PCR are shown in Supplementary Fig. S1. From the figure we can find that these two expression profiles accord with each other very well. They are also very consistent with current knowledge on these genes, suggesting that our microarray data are appropriate for further transcriptomic analysis. With these expression data, we can look into how some genes known to be involved in liver development such as Hnf4a, Nfkb1, Cebpa, Xbp1 and Foxa1 are regulated temporally and involved in the function switch from fetal to postnatal liver development (Supplementary Fig. S2). The scientific community who is interested in liver development and function can also find the developmental expression patterns of their interested genes from this work (Supplementary Table S1).
To overview gene expression profiles across mouse liver development, two-dimensional hierarchical clustering analysis is performed on 8640 selected genes (Fig. 1a) by Cluster 3.0 [4] and visualized by TreeView 1.60 (Michael Eisen, Stanford University. http://rana.lbl.gov/EisenSoftware.htm). Expression values are adjusted by log transform and mean center genes before clustering. The clustering result (Fig. 1a) on the time dimension shows that all time points remain in their original order. It is reasonable, since the development is a gradually changed process and neighbouring time points have similar expression snapshots. The first bifurcating hierarchy of the cluster divides 14 time points into two developmental stages, the embryonic and the postnatal stage, delineated by the dividing point between E17.5 and E18.5. It would be natural to expect that time points before and after birth (around E18.5 and Day0) should be separated into two clades. But the clustering result indicates that the expression profile of E18.5 is more similar to those of time points after birth. It was reported that premature mice by caesarean section could not live if their gestational ages were less than 19 days [5]. While caesarean birth mice can survive and their weight handicaps in organs can be overcome in postnatal days [6]. Results here may provide transcription-level explanation to this anatomic observation.
Fig. 1. Differential expression pattern in mouse liver development.
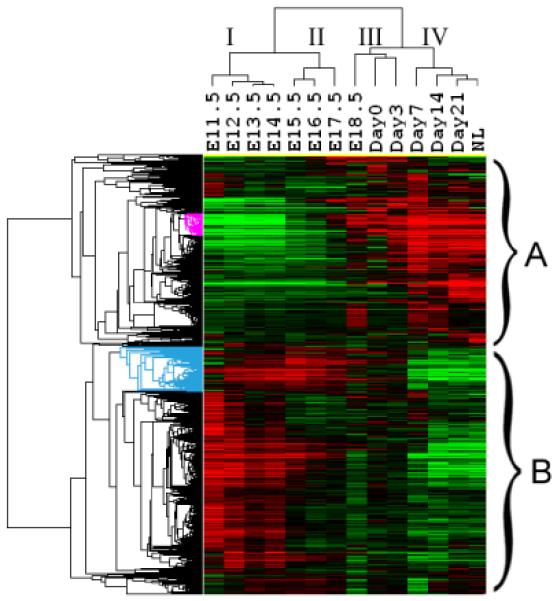
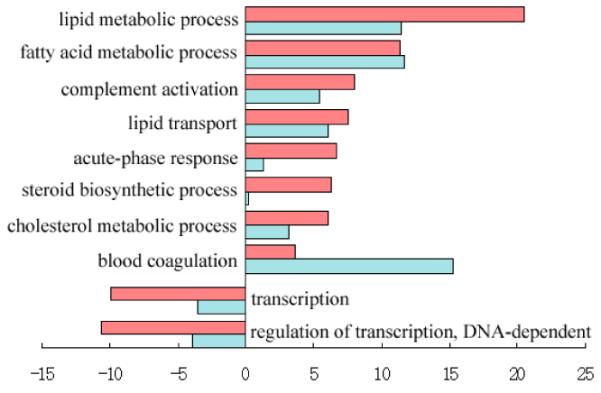
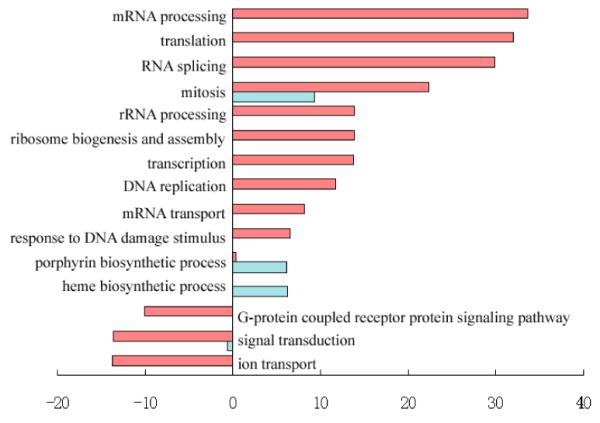
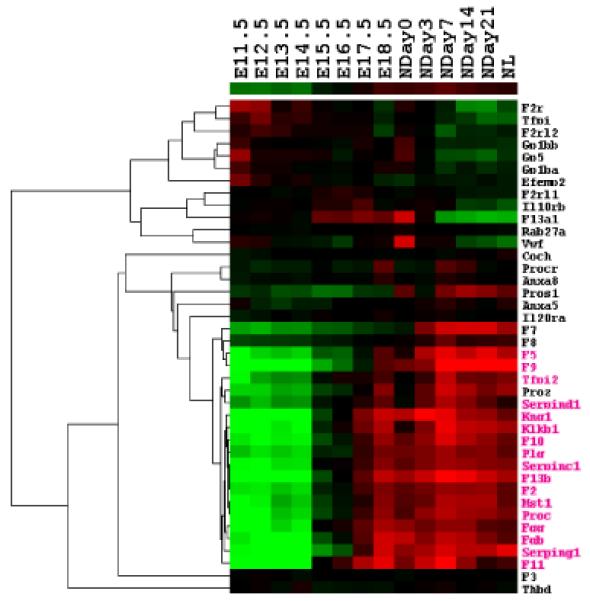
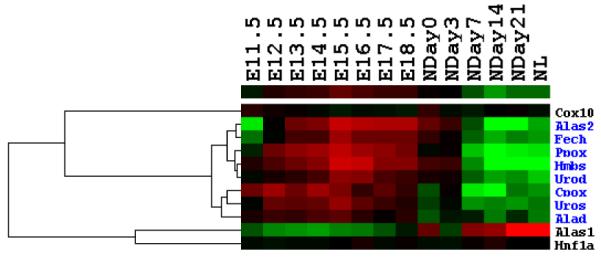
(A) Heatmap for the 8640 genes whose expression levels are changed by more than 1.5-fold to average. Each row represents the expression level for one gene during development; and each column is a developmental time point. Total 8640 genes are aggregated into two groups with opposite trends. Two small clades of genes (highlighted as pink and blue part in the gene dendrogram) are picked out for further analysis. (B) Over-represented and under-represented biological functions of Group A relative to the whole gene set on microarray. Pink bars list enriched or repressed functions of all genes in group A; and blue bars are for genes in the pink clade of group A (414 genes). The bar length corresponds to the negative log p-value (after Bonferroni correction). (C) Over-represented and under-represented biological functions of Group B relative to the whole gene set on microarray. Pink bars list the enriched or repressed functions for all genes in group B, and blue bars are for genes in the blue clade of group B (861 genes). (D) The expression heatmap for all forty genes annotated with the term “blood coagulation”. Seventeen genes of them included in the pink clade of group A (ref. A) with similar expression profile are highlighted in pink. (E) Eleven genes annotated with the term “heme biosynthetic process”. Eight of them included in the blue clade of group B (ref. A) are highlighted in blue.
The sample dendrogram is further divided into two sub-stages (Stages I and II) corresponding to transiting from E14.5 to E15.5. We observed that expression levels of each gene at the first sub-stage are more homogenous compared with the second sub-stage. Previous experiments indicated that E14.5 is a transition point of mouse liver development around which hepatocytes and bile-duct epithelial cells occurs [1]. Consistent with this result, hierarchical clustering reveal two sub-stages of time points during embryonic liver development. Data points of the postnatal stage are also divided into two clusters (Stages III and IV). Expression profiles of the stage IV (ranging from Day7 to NL) exhibited less time-invariant property suggesting the liver has become near to the maturation.
Genes in Fig. 1a are also clearly split into two distinctive groups. The first group (Group A) includes 3703 genes, majority of which have high expression levels in the postnatal stage of liver development. While the other group (Group B) includes 4937 genes, most of which are activated in the embryonic stage. Opposite trends of these two groups suggest their different functions. We searched over-represented and under-represented GO terms for these two groups of genes separately. Bonferroni corrected hypergeometric p-values are calculated to determine significant enriched/depleted terms in each group compared to the whole set of genes on the microarray (enriched/depleted categories are listed in Fig. 1b for group A and Fig. 1c for group B, with lengths of pink bars equal to minus log of corrected p-values). We find that liver-related functional terms (e.g. lipid, cholesterol, fatty acid metabolism, and steroid biosynthesis) are enriched in group A; while cell cycle related terms (e.g. replication, transcription, mRNA processing and translation) are enriched in group B.
Visual inspection of group A identified a small clade of genes with consistently high expression level at the postnatal stage (the pink part of gene dendrogram in Fig. 1a with 414 genes). GO analysis indicates the enrichment of “blood coagulation” biological process term in these 414 genes (Bonferroni corrected p-value 5.66e-16, blue bars in Fig. 1b). Among those forty genes which are annotated with the term “blood coagulation” within the whole set (Fig. 1d), twenty two of them are included in the group A and seventeen are included in these 414 genes, which indicates the specific expression pattern of these blood coagulation related genes during mouse liver development.
In group B, majority of genes start high expression values from E11.5 and become inactivated from E15.5. But a small subgroup of genes (blue part in the gene dendrogram of Fig. 1a) distinguishes themselves with augmented expression from E12.5 to E17.5. This small group is comprised of 861 genes. GO analysis shows that the “heme biosynthetic process” and “porphyrin biosynthetic process” terms are significantly enriched in this group (Bonferroni corrected p-values equal to 6.48e-07 and 8.29e-07 respectively, blue bars in Fig. 1c), consistent with the hematopoiesis function in the early stage of liver development. After a closer examination of enriched genes, we found that eight of total eleven genes annotated with “heme biosynthetic process” in GO are included in the 861-gene clade of group B (Fig. 1e). Genes labelled both with “porphyrin biosynthetic process” and “heme biosynthetic process” terms in annotation file are all encompassed in the 861-gene clade, which forms the major contribution to the enrichment of the related GO terms. It has been learned that around E10.5 to E12.5, liver becomes a major site of fetal hematopoiesis [1]. Accordingly, the expression activities of these genes come to a climax from E12.5 to E17.5 and then become to wane from E18.5 on. The turning point in gene expression thus reveals a functional switch from hematopoiesis to metabolism [1; 2]. This finding also suggests that the uncharacterized genes included in the 861-gene clade might be associated with the fetal hematopoiesis.
The liver is an essential organ for mammals and hepatocellular carcinoma is among the top most common, deadly cancer world-wide. It is interesting to find the relation between hepatocellular carcinoma (HCC) and liver development. We compared microarray data in this study to a published array profiling dataset with 49 pairs of HCCs and adjacent liver tissues [7] (GSE4024 in the GEO database). According to the hierarchical clustering result of samples, we have divided mouse liver development into four stages. Here we compare enhanced genes in each of four stages with genes which have enhanced expression in HCC tissues. At each stage, genes with expression level 1.5-fold above the control (average expression value of all 14 time points) are selected as enhanced genes. To determinate upregulated genes in HCC, we selected genes with expression value 2-fold above in at least 2 HCC samples than those in corresponding adjacent liver tissues. Mouse orthologys of genes in HCC arrays are got by the Biomart tool in Ensembl. Then we tried to find relations between the HCC and each of four liver development stages respectively by Fisher’s Exact Test (Table S2). We found that the upregulated genes in HCC are enriched in genes which are enhanced in liver developmental stage I (p-value 1.53e-4) and stage II (p-value 0.008), and depleted in liver developmental stage IV (p-value 7.19e-9). These findings suggest that genes related to embryonic, proliferating stage could play important roles in hepatocarcinogenesis. The microarray profiling in this study would also provide a usable resource for the scientific community who are interested in liver cancer research.
Function analysis of elevated and inhibited genes at each time point
In different stages of liver development, genes with stage-specific functions are often enhanced or inhibited at corresponding phases. Based on the hypothesis that developmental-stage-specific genes should play more important roles at the corresponding stage, we look for over-represented and under-represented functions of elevated genes and inhibited genes at each time point to get the “function profile” of mouse liver development.
At each time point, genes with expression level 1.5-fold above the mean expression level are selected as enhanced genes and genes with expression level 1/1.5-fold below the mean are selected as inhibited genes. Numbers of selected genes for each time point are displayed in the Supplementary Fig. S3. We used the hypergeometric distribution to detect over-represented or under-represented functions of elevated and inhibited genes at each time point. Enriched or repressed functions for elevated genes at each time point are displayed in Fig. 2a and that for inhibited genes are displayed in Fig. 2b.
Fig. 2. Function analysis of elevated and inhibited genes at each time point.
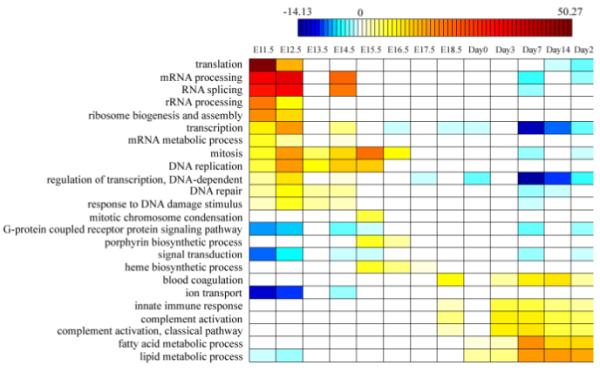
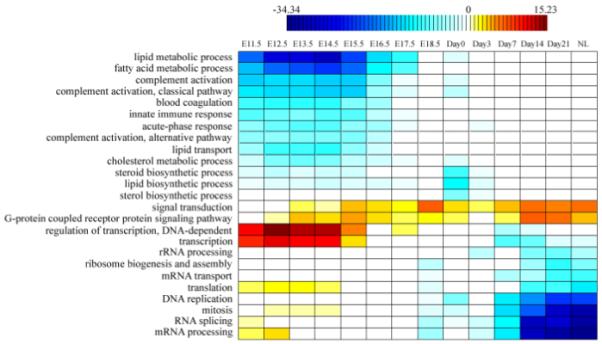
(A) The functional profile for up-regulated genes. Enriched (red) and depleted (blue) functions of activated genes at each time point are listed in the table, with shade representing the significance level (scaled by the negative log of corrected p-value). (B) The functional profile for down-regulated genes. Enriched (blue) and depleted (red) functions of inhibited genes at each time point are listed in the table, with shade representing the significance level (scaled by the negative log of corrected p-value).
In Fig. 2a, enriched functions of elevated genes are represented in red color and repressed functions of elevated genes are represented in blue color. While in Fig. 2b, enriched functions of inhibited genes are represented in blue color and repressed functions of inhibited are represented in red color. The depth of the color represents the over-represented or under-represented significance of that function. A “function profile” along the mouse liver development is constructed: in early embryotic development, cell-cycle-related TFs and genes are highly expressed; around the birth, the defence-related genes start to be activated; and liver-function-related TFs and genes are mostly found in the later stage of the development.
We further use hypergeometric distribution to detect KEGG pathways whose genes are enriched in elevated genes at each time point. Enriched pathways for elevated genes at each time point are displayed in Supplementary Table S3. Analysis results for KEGG pathways are very similar to those of GO functions: at the early embryotic stage, genes involved in pathways like cell cycle and DNA replication are enriched in elevated genes; at the late stage near to maturation, genes in pathways like bile acid biosynthesis and fatty acid metabolism are enriched in elevated genes.
Over-represented cis-regulatory elements for each time point
The organ formation requires precise coordination of tissue-specific gene expressions which change over time. Transcriptional regulation controlling the gene expression in a tissue-specific and quantitative manner is a major regulatory mechanism in embryonic developmental process. To sieve cis-regulatory elements responsible for the transcriptional regulation at each time point in liver development, we use a computational approach to identify over-represented motifs in promoter regions of up-regulated or down-regulated genes relative to those of genes in the background set. For each time point, among genes selected by the 1.5-fold change, the 500 most activated or inhibited (respectively) genes are taken as the representation of up-regulated or down-regulated genes. If numbers of selected gene are less than 500, only genes passed the 1.5-fold criterion are used. The background set is constructed by 1000 genes randomly chosen from the genome. Promoter sequences are got from UCSC mm8 (−1000 and +200 nt from the TSS). The Motifclass in CREAD package [8] is used to find enriched motifs in promoter regions of selected genes. Motifclass finds the most over-represented motifs in a set of foreground promoters according to the enrichment of motifs in the foreground set relative to a background promoter set. For each time point, the most relatively enriched motifs are those with the lowest reported relative error rates. The 10 most qualified motifs for enhanced and inhibited genes at each time point are displayed in Supplementary Table S4 and Table S5, respectively.
In the hierarchical clustering result, 14 time points are divided into 4 stages, assuming time points in the same stage with similar expression snapshots may have similar underlying regulations. Motifs found to be over-represented in every time point of a stage should be more likely to be related with a common function (Table 1). E2f1, Mef2 and Evi1are found to be enriched in all time points of stage I and E2f1 is a key cell cycle regulator. In stage IV, a well known important liver-specific TF Hnf4a is found to be highly enriched.
Table 1.
Motifs which are over-represented in all time points of a stage
| Stage | Over-represented motifs of enhanced genes | Over-represented motifs of inhibited genes |
|---|---|---|
| I | E2f1, Mef2, Evi1 | Hnf4a, Repin1, Nf1, Smad3, Tal1 |
| II | Sp1 | Nf1 |
| III | Myog, Smad3 | E2f1 |
| IV | Hnf4a, Smad3 | E2f1, Nfy, Sp1 |
Transcription regulation networks across mouse liver development
The gene expression is controlled through the combinatorial action of multiple transcription factors that activate or repress transcription via binding to cis-regulatory elements of their target genes, reconstruction of regulatory networks during mouse liver development can help us to understand mechanisms that control the liver ontogeny. For four stages across mouse liver development, we have got a group of TFs (Table 1) whose binding sites are consistently over-represented in promoter regions of enhanced or repressed genes across all time points of a stage. We use the Staden’s method [9] to predict targets of these over-represented TFs from the most activated or inhibited genes. With selected TFs and their predicted targets as nodes, and regulatory relations as arrow edges from TFs to targets, we can get snapshots of dynamic regulatory networks during mouse liver development (Supplementary Table S6). To facilitate the visualization, the sub-network with top 50 inhibited and enhanced genes is displayed with the program Cytoscape 2.4. Regulatory relations in the network are not always activated. They consistently change over time to achieve activated or inhibited expression of relevant genes. Here four regulatory networks are displayed according to the expression of target genes in each stage (Fig. 3). For each gene, we first take the average of expression values across a stage as the mean expression value of that stage. Then each gene has four mean expression values corresponding to four stages. With the mean of all 14 time points as control, genes with expression values higher than 1.5-fold are taken as enhanced at the corresponding stage (red nodes in Fig. 3); genes with expression values less than 1.5-fold and greater then 2/3-fold are taken as expressed (pink nodes in Fig. 3); and genes with expression values less than 2/3-fold are taken as inhibited (blue nodes in Fig. 3).
Fig. 3. Regulatory networks across mouse liver development.
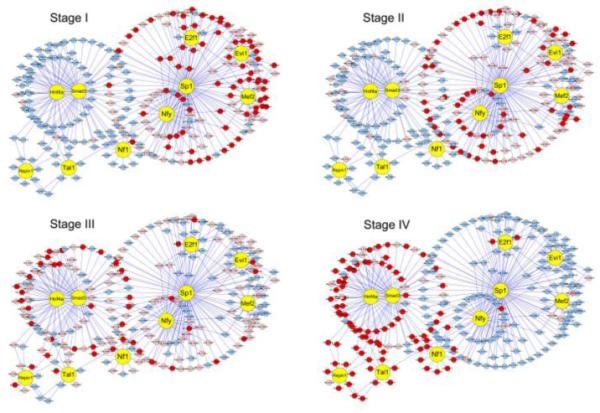
Regulatory relations in the network are not always activated. Here four regulatory networks are displayed according to the expression of target genes in the corresponding stage. With the mean of all 14 time points as contrast, genes with expression values higher than 1.5-fold of contrast are taken as being enhanced at the corresponding stage (red nodes); genes with expression values less than 1.5-fold and greater then 2/3-fold are taken as expressed (pink nodes); and genes with expression values less than 2/3-fold are taken as inhibited (blue nodes). These networks reflect a switch of cell-cycle related TFs/targets to liver function related TFs/targets.
In Fig. 3, we can get that TFs in networks can be classified into two groups. The first group (including Sp1, E2f1, Mef2, Evi1 and Nfy) is activated from stage I and then decreases along the development. In this group, most target genes have inhibited expression from stage III. E2f1 is a well known TF in cell cycle. The expression profile of E2f1decreases during mouse liver development (Fig. 4), which may result in the decreased expression of E2f1 targets. The second group includes Hnf4a, Smad3, Tal1, Repin1 and Nf1. Most of their targets express from stage III and are highly enhanced at stage IV. Hnf4a is a well known liver enriched TF which is known to play important roles in liver development. The expression of Hnf4a is displayed in Fig. 4, which is consistent with its functional needs.
Fig. 4. Expression profiles of E2f1 and Hnf4a across mouse liver development.

For consistence with the four stages of regulatory network, the average expression value of time points in each stage is taken as the expression value of the TF at the corresponding stage.
Materials and Methods
Staging and preparation of embryos
Mouse embryos at various stages of gestation were obtained by mating random-bred C57/B6 animals. Noon of the following day of vaginal plug appearance was considered to be embryonic day 0.5. Fetal liver tissue from C57/B6 mice of E11.5 (n = 12), E12.5 (n = 9), E13.5 (n = 9), E14.5 (n = 6), E15.5 (n = 6), E16.5 (n = 3), E17.5 (n = 3), E18.5 (n = 3), the birth day (n = 3), 3 days (n = 3), 7 days (n = 3), 14 days (n = 3) and 21 days (n = 3) after birth, as well as liver from mature mice, 18 weeks after birth (n = 3), were prepared under the binocular microscope and pooled. The C57/B6 mouse strains were bred and maintained to obtain embryos at National Institute of Biological Sciences (NIBS) at Beijing. All animal experiments in this study were approved by the Institutional Animal Care and Use Committee (IACUC) of NIBS.
RNA extraction
Total RNA was extracted using TRIZol reagent according to the manufacturer’s instruction from Invitrogen. The poly+(A) RNA from total RNA was performed by using oligo (dT) following the protocol (Qiagen). The nucleotide acid concentration and quantity was assessed by agarose gel electrophoresis or Agilent 2100 Bioanalyzer.
Semi-quantitative Reverse Transcription PCR
Reverse Transcription (RT) was performed in a 20 μl reaction system which contained 2 μg total RNA, 20 pmol oligo-dT, mixed up to 11μl with DEPC-H2O and then incubated at 70°C for 5 min. After 5min at 0°C, 4μl 5× buffer, 2μl 0.1M DTT, 2μl dNTP (10 mM) and 1μl (200U) SurperScript II reverse transcriptase (Life Technologies), incubated at 42°C for 2 h. In PCR, β-actin was used as a control to estimate the quality of cDNA (forward primer: 5′-TCACCCACACTGTGC CCATCTACGA-3′ and reverse primer: 5′-CAGCGGAACCGCTCATTGCC AATGG-3′). To further avoid DNA contamination, all primers in this study were designed to span at least one exon. Each PCR was performed as follows: pre-denature at 94°C, 5min; denature at 94°C, annealing at 55°C, extend at 72°C, 40 s, respectively, and finally at 72°C for 7min. The PCR products were observed by electrophoresis on 2% agarose gel.
Microarray Hybridization
The pooled RNA sample were labelled and hybridized to Mouse430 high-density oligonucleotide arrays (Affymetrix), which contains 45,037 probe sets on a single array. Totally 25 microarrays have been used in this experiment, and 11 of the 14 time points have two technique repeat experiments. The average of two technique repeats was taken as the expression value for the corresponding time point. One ug of poly(A)+ RNA was annealed to oligo(dT) and transcribed using SurperScript II reverse transcriptase (Invitrogen, Carlsbad, CA), Labelling, hybridization, washing and signal scan on the microarrays were performed according to the manufacturer’s instructions. Primary image analysis of the arrays was performed using GENECHIP 3.2 (Affymetrix, Santa Clara, CA), and normalization was performed using RMA software with CDF file annotated by Dai et al. [10].
The obtained microarray data were deposited to the GEO database with the accession number GSE13149.
Annotated the GeneChip with updated definitions
The Affymetrix GeneChip is a commonly used microarray platform for genome-wide expression study. We first annotated our data with the CDF file of Affymetrix, which got 45037 probe sets corresponding to 25978 Refseq transcripts. It has been found that with the updated genome assembly, definitions of many genes/transcripts on the arrays are out-of-date when mapping the probes to the new version of genome assembly [11]. To solve this problem, Dai et al. [10] aligned the probes to different sources of genome data to filter out problematic probes. For the Genechip Mouse430 which used in this study, they found that 20.8% of all probe sets have mapped to unreliable public IDs, 10.2% have probes with multiple genome hits and 7.8% include probes with no known target. We reannotated original .CEL files with annotations generated by Dai et al. (NCBIM36.46). A commonly used software RMA [12] was used for probe annotations. After processing, we got 21561 probe sets corresponding to 21561 Refseq transcripts, 20822 (96.6%) of which overlap with Affymetrixs’ definition (Fig. S4). Only the definition of Dai et al. is used in the current study.
GO function analysis
GO (http://www.geneontology.org) is a widely used gene functional categorization system. Three ontologies have been proposed, which include biological process, molecular function, and cellular component. The Gene Ontology file (version: 1.555, Date: 2007/11/22) and the mouse annotation file (gene_association.mgi. Version 1.692. Date: 11/16/2007) were downloaded from http://www.geneontology.org. Hypergeometric distributions were used to detect over-represented or under-represented biological process terms in the studied set comparing to the population set. Probabilities got by hypergeometric distributions were corrected by Bonferroni correction for the test on multiple GO functions. In order to decrease the number of GO terms, we only considered biological process ontology terms at 4, 5 and 6 levels. Terms with Bonferroni corrected p-values less than 1e-6 were taken as significant ones.
Promoter sequences
Promoter DNA sequences were got from UCSC database. Transcripts with no transcription start site (TSS) annotation in UCSC were not included in the cis-regulatory elements analysis. Each promoter sequence is taken 1,000 bp upstream to 200bp downstream from the TSS.
Identifying enriched motifs
All the motifs were represented by the position weight matrix. Known motifs were got from the vertebrate subset of TRANSFAC (Version 9.3). Motifclass in CREAD package [8] was used to find overrepresented TFs of selected genes. Motifclass finds the most over-represented motifs in a set of promoters (foreground) according to the enrichment of motifs in the foreground relative to a background promoter set. To evaluate the enrichment of a motif M with length w, the motif was first scored at every w- length subsequence in each promoter sequence S. The maximum score (max-score) in S was used as the promoter score for M. Giving a threshold λ, the method classifies the promoter sequences S as belonging to the foreground if max-score ≥λ , or to the background otherwise. For all the promoter sequences in the foreground (FG) and background (BG), the sensitivity of motif M is:
and the specificity is:
The enrichment of motif M in FG is defined as:
For each motif M, the minimal value of the above equation was taken as the error rate of motif M in FG relative to BG. Then all the motifs were ranked based on the error rates and the 10 motifs with the least error rates were selected. The relative error rates for these selected motifs were significantly lower (p < 0.01) on these promoter sets relative to random promoters. Motifs do not pass the p < 0.01 criterion were removed.
Predicting target genes for the over-represented TFs
Target genes for the over-represented TFs were predicted by the Staden’s method [9]. Given a motif M, base composition f and a match score S, the Staden’s method can calculate the p-value of observing the match score S, that is, the probability that a randomly selected site has a score at least as high as S. The base composition f was calculated from the candidate set of the corresponding stage. The math score S was obtained by scanning the promoter sequences of each candidate gene with the Position Weight Matrix of M. Genes with p-values lower than 1e-5 were selected as target genes.
Supplementary Material
Acknowledgements
We thank Dr. Zhenyu Xuan, Dr. Andrew Smith and Xueya Zhou for helpful discussions. We thank Qin Zhang for her contribution in the microarray and RT-PCR experiments. This work is partially supported by NSFC (60575014, 30625012, 60721003), the National Basic Research Program (2004CB518605, 2006CB910402) and Hi-tech Research and Development Program (2006AA02Z325) of China, the Chinese Human Liver project (CNHLPP, 2004BA711A19), and the Shanghai Commission for Science and Technology (06ZR14069). MQZ is also partly supported by the Chang Jiang Scholarship programme and by NIH HG06916.
References
- [1].Hata S, Namae M, Nishina H. Liver development and regeneration: from laboratory study to clinical therapy. Dev Growth Differ. 2007;49:163–70. doi: 10.1111/j.1440-169X.2007.00910.x. [DOI] [PubMed] [Google Scholar]
- [2].McLin VA, Zorn AM. Molecular control of liver development. Clin Liver Dis. 2006;10:1–25. v. doi: 10.1016/j.cld.2005.10.002. [DOI] [PubMed] [Google Scholar]
- [3].Gualdi R, Bossard P, Zheng M, Hamada Y, Coleman JR, Zaret KS. Hepatic specification of the gut endoderm in vitro: cell signaling and transcriptional control. Genes Dev. 1996;10:1670–82. doi: 10.1101/gad.10.13.1670. [DOI] [PubMed] [Google Scholar]
- [4].Eisen MB, Spellman PT, Brown PO, Botstein D. Cluster analysis and display of genome-wide expression patterns. Proc Natl Acad Sci U S A. 1998;95:14863–8. doi: 10.1073/pnas.95.25.14863. [DOI] [PMC free article] [PubMed] [Google Scholar]
- [5].Loctin J, Delost P. Mortality in premature mice at birth and during neonatal development. Reprod Nutr Dev. 1983;23:293–301. doi: 10.1051/rnd:19830213. [DOI] [PubMed] [Google Scholar]
- [6].Loctin J, Delost P. Somatic development in premature mice from birth to weaning. Reprod Nutr Dev. 1983;23:915–26. doi: 10.1051/rnd:19830612. [DOI] [PubMed] [Google Scholar]
- [7].Lee JS, Heo J, Libbrecht L, Chu IS, Kaposi-Novak P, Calvisi DF, Mikaelyan A, Roberts LR, Demetris AJ, Sun Z, Nevens F, Roskams T, Thorgeirsson SS. A novel prognostic subtype of human hepatocellular carcinoma derived from hepatic progenitor cells. Nat Med. 2006;12:410–6. doi: 10.1038/nm1377. [DOI] [PubMed] [Google Scholar]
- [8].Smith AD, Sumazin P, Xuan Z, Zhang MQ. DNA motifs in human and mouse proximal promoters predict tissue-specific expression. Proc Natl Acad Sci U S A. 2006;103:6275–80. doi: 10.1073/pnas.0508169103. [DOI] [PMC free article] [PubMed] [Google Scholar]
- [9].Staden R. Methods for calculating the probabilities of finding patterns in sequences. Comput Appl Biosci. 1989;5:89–96. doi: 10.1093/bioinformatics/5.2.89. [DOI] [PubMed] [Google Scholar]
- [10].Dai M, Wang P, Boyd AD, Kostov G, Athey B, Jones EG, Bunney WE, Myers RM, Speed TP, Akil H, Watson SJ, Meng F. Evolving gene/transcript definitions significantly alter the interpretation of GeneChip data. Nucleic Acids Res. 2005;33:e175. doi: 10.1093/nar/gni179. [DOI] [PMC free article] [PubMed] [Google Scholar]
- [11].Lu X, Zhang X. The effect of GeneChip gene definitions on the microarray study of cancers. Bioessays. 2006;28:739–46. doi: 10.1002/bies.20433. [DOI] [PubMed] [Google Scholar]
- [12].Irizarry RA, Hobbs B, Collin F, Beazer-Barclay YD, Antonellis KJ, Scherf U, Speed TP. Exploration, normalization, and summaries of high density oligonucleotide array probe level data. Biostatistics. 2003;4:249–64. doi: 10.1093/biostatistics/4.2.249. [DOI] [PubMed] [Google Scholar]
Associated Data
This section collects any data citations, data availability statements, or supplementary materials included in this article.


