

Abstract
Actin is a major component of the cytoskeleton that transmits mechanical stress in both muscle and nonmuscle cells. As the first step toward developing a “bio-nano strain gauge” that would be able to report the mechanical stress imposed on an actin filament, we quantitatively examined the fluorescence intensity of dyes attached to single actin filaments under various tensile forces (5–20 pN). Tensile force was applied via two optically trapped plastic beads covalently coated with chemically modified heavy meromyosin molecules that were attached to both end regions of an actin filament. As a result, we found that the fluorescence intensity of an actin filament, where 20% of monomers were labeled with tetramethylrhodamine (TMR)-5-maleimide at Cys374 and the filamentous structure was stabilized with nonfluorescent phalloidin, decreased by ∼6% per 10 pN of the applied force, whereas the fluorescence intensity of an actin filament labeled with either BODIPY TMR cadaverin-iodoacetamide at Cys374 or rhodamine-phalloidin showed only an ∼2% decrease per 10 pN of the applied force. On the other hand, spectroscopic measurements of actin solutions showed that the fluorescence intensity of TMR-actin increased 1.65-fold upon polymerization (G-F transformation), whereas that of BODIPY-actin increased only 1.06-fold. These results indicate that the external force distorts the filament structure, such that the microenvironment around Cys374 approaches that in G-actin. We thus conclude that the fluorescent dye incorporated into an appropriate site of actin can report the mechanical distortion of the binding site, which is a necessary condition for the bio-nano strain gauge.
Introduction
The main apparatus for organizing both static and dynamic intracellular structures must be the cytoskeleton, which is composed of actin filaments and microtubules with a variety of accessory proteins. It is well known that both actin filament, a helical polymer composed of actin molecules, and microtubule, a tubular polymer composed of tubulin heterodimers, play important roles in cell motility through polymerization-depolymerization dynamics, acting in collaboration with accessory proteins specific to each polymer. It should also be noted that both types of cytoskeleton filaments play a key role as a mechanical framework to maintain and transmit the mechanical stress in cells. The ability to sense and respond to mechanical stress is critical for normal cellular behavior, such as motility and growth (1–3). Therefore, it would be desirable to develop a “bio-nano strain gauge” that could monitor the amount of stress imposed on the cytoskeleton.
In the past, the mechanical properties of actin filaments have been examined with the use of several physical techniques. For example, bending flexibility has been measured by dynamic light scattering (4), and direct observations of bending Brownian movement have been obtained with fluorescence microscopy (5,6). Torsional rigidity has been measured by analyzing the twisting motion of single actin filaments trapped with optical tweezers (7,8). Tensile strength has been examined by micromanipulation of single actin filaments with a pair of glass microneedles (7,9), silicon-nitride microfabricated levers (10), and optical tweezers (11). However, to date, no studies have focused on the relation between the imposed external force and the resulting stress/strain in the filaments, except for x-ray diffraction studies on skeletal muscle (12,13). If we could image microscopically how much force is imposed on each filament, such a technique (or bio-nano strain gauge) would become a new and powerful tool in cell biology to visualize the stress distribution within individual cells.
As the first step in approaching this goal, we studied the force-dependent distortion of single actin filaments through quantitative measurements of the fluorescence intensity of fluorophores attached to a specific site in actin molecule, under various applied forces. Recent advances in optical microscopic techniques have made it possible to image single protein molecules in solution and apply to them the external force of several tens of piconewtons. Our microscopic system is composed of an observation system that can capture both fluorescence and phase-contrast images at the same time, and optical tweezers that have two independent trapping centers, so that the applied force can be determined from the displacement of beads relative to the trapping centers.
Materials and Methods
Preparation of proteins
All experimental procedures conformed with the “Guidelines for Proper Conduct of Animal Experiments” approved by the Science Council of Japan, and were performed according to the regulations for animal experimentation at Waseda University. Male white rabbits (2.0–2.5 kg) were anesthetized with pentobarbital (25 mg kg−1). Actin and myosin were prepared from the white skeletal muscle. First, G-actin was prepared according to Spudich and Watt (14), except that the tropomyosin-troponin complex was removed before preparation of the acetone powder, as previously described (15). G-actin was solubilized with a solution containing 2 mM Tris-HCl (pH 8.0), 50 μM CaCl2, 0.1 mM ATP, and 2 mM NaN3. Heavy meromyosin (HMM) was prepared by chymotryptic digestion of myosin (16) without ammonium sulfate fractionation. N-ethylmaleimide (NEM) (PIERCE, Rockford, IL) modified-HMM (NEM-HMM) was prepared by mixing HMM and NEM at a 1:4 molar ratio for 30 min at 4°C and adding 5 mM dithiothreitol (DTT) to terminate the reaction.
The concentration of unlabeled actin was determined from ultraviolet absorption (V-550; JASCO, Tokyo, Japan), assuming a molar extinction coefficient of 26,600 M−1cm−1 at 290 nm (17). The concentration of HMM was determined by assuming a molar extinction coefficient of 226,450 M−1cm−1 at 280 nm (18).
Fluorescent dye labeling of actin
Labeling of actin with fluorescent dyes was performed by incubating 48 μM F-actin polymerized in a solution containing 0.1 M KCl, 2 mM MgCl2, 1 mM ATP, 2 mM Tris-HCl (pH 8.0), and 140 μM tetramethylrhodamine-5-maleimide (TMR-5MA; Invitrogen, Carlsbad, CA) or N-(5-((4,4-difluoro-1,3-dimethyl-5-(4-methoxyphenyl)-4-bora-3a,4a-diaza-s-indacene-2-propionyl)amino)pentyl)iodoacetamide (BODIPY TMR cadaverine IA; Invitrogen) for 2 h at room temperature to obtain TMR-actin and BODIPY-actin, respectively.
Dyes dissolved in dimethylformamide (DMF; Sigma, St. Louis, MO) were slowly added to the F-actin solution with continuous stirring. The reaction was terminated by adding 5 mM DTT, and the labeled actin was centrifuged at 411,000 × g for 45 min at 8°C. The pellet was then dissolved in the solution containing 10 mM Tris-HCl (pH 8.0), 50 μM CaCl2, and 0.1 mM ATP, and dialyzed against it overnight at 2°C, with the dialysis buffer replaced at least twice. After centrifugation at 411,000 × g for 20 min at 2°C to remove aggregates, the free fluorescent dye was removed from the G-actin solution by Sephadex G-25 column chromatography. The concentrations of TMR and BODIPY were estimated from their molar extinction coefficients: 96,900 M−1cm−1 at 550 nm, and 60,000 M−1cm−1 at 544 nm, respectively (Invitrogen). The concentrations of TMR- and BODIPY-labeled G-actin were determined by subtracting 0.208 × A550 and 0.146 × A544, respectively, from the A290 value. The molar ratio of the bound dye to actin thus determined was 96% and 57%, respectively. The 20%-labeled actin filaments were prepared by mixing nonfluorescent G-actin and dye-labeled G-actin (total concentration of actin was 2.5 μM) in the solution containing 10 mM Tris-HCl (pH 8.0), 50 μM CaCl2, 1 mM ATP, and 1 mM DTT, and then adding 1/20 volume of 1 M KCl and 40 mM MgCl2, and finally adding 6 μM nonfluorescent phalloidin to stabilize the actin filaments. Rhodamine-phalloidin-labeled actin (RP-actin) filaments were prepared by adding 6 μM RP instead of nonfluorescent phalloidin to 2.5 μM nonfluorescent actin solution under the same conditions as described above. Actin filaments labeled with quantum dots (Qdot; Qdot 655 streptavidin conjugates, Q10121MP; Invitrogen) were prepared by mixing the avidin-coated quantum dots with 20%-biotinylated actin filaments and were further labeled with RP for the convenience of manipulation under the fluorescence microscope (QD-actin).
Preparation of beads used for optical trapping
Carboxylated beads (1.0 μm F8815, FluoSphere; Invitrogen) were covalently coated with NEM-HMM as follows: Beads were activated with 1% 1-ethyl-3-[3-dimethylaminopropyl]carbodiimide hydrochloride (EDC) and 1% N-hydroxysulfosuccinimide (Sulfo-NHS) in 20 mM sodium phosphate (pH 4.5) for 30 min at room temperature and then washed four times with 200 mM Na-borate (pH 8.5). Next, equal volumes of a bead suspension (2% (w/v)) and 2 mg mL−1 NEM-HMM solution were mixed and incubated for 1 h on ice. After the reaction had been terminated by the addition of 5 mg mL−1 BSA, the bead suspension was washed four times with 200 mM Na-borate (pH 8.5) containing 10 mg mL−1 BSA. The NEM-HMM coated beads thus prepared were stored at 4°C in the final solution containing 20 mM sodium phosphate (pH 7.4), 10 mg mL−1 BSA, 0.4% (w/v) NaN3, and 5% (w/v) glycerol.
Microscopy system
Fig. 1 shows a schematic diagram of a dual-view (phase-contrast and fluorescence) video microscope imaging system (19) equipped with optical tweezers. The inverted microscope (IX71; Olympus, Tokyo, Japan; 100× objective lens with a phase plate, NA 1.3, UplanFL 100 Ph3; Olympus, custom-made; single coating for infrared laser) was installed on an optical bench (RS-4000; NewPort, Irvine, CA).
Figure 1.
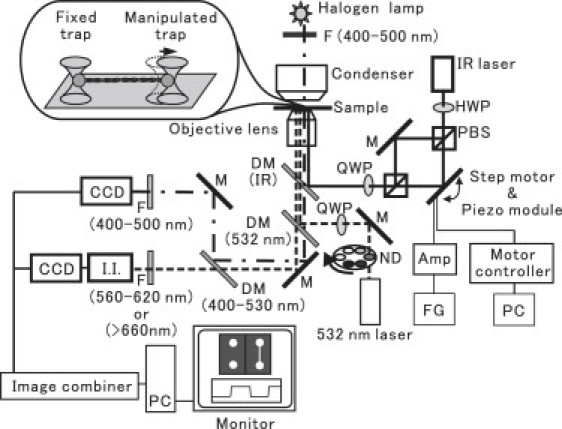
Schematic diagram of the experimental setup. The microscope is equipped with a dual-view system and dual-trap optical tweezers. The dash-dotted lines and the dashed lines represent the optical paths for the phase-contrast and fluorescence imaging, respectively, and the solid lines represent the optical path for the optical tweezers. The microscope system includes dichroic mirrors (DM; the wavelength in parentheses shows the wavelength of the light being reflected), filters (F; the wavelength in parentheses shows the wavelength of light passing through), neutral density (ND) filters, and mirrors (M). To apply tension to an actin filament stretched between the two beads, one of the trap centers was fixed and the other was controlled by tilting the mirror with a step motor and a piezo actuator module. QWP: quarter-wavelength plate; HWP: half-wavelength plate; PBS: polarization beam splitter; FG: function generator; Amp: amplifier for piezo module; PC: personal computer; I.I.: image intensifier.
The sample stage of the microscope was replaced with the custom-made stage. For manipulation within the XY plane, high-resolution actuators (SGSP-20-20; Sigma Koki, Saitama, Japan) and their controllers (SHOT-204MS; Sigma Koki) were used. Displacement in the Z-direction was controlled by the piezoelectric substage (P-611.3S; Physik Instrumente GmbH, Karlsruhe, Germany) with the power supply (P-720.00; Physik Instrumente). To stabilize the temperature of the microscopic system, the surrounding temperature was adjusted to the experimental temperature 1–2 h before the measurements were obtained.
The light leaving the sample consisted of two components: one for the phase-contrast image and one for the fluorescence image. The phase-contrast image of the beads was obtained by illuminating the sample with a halogen lamp (wavelength 400–500 nm; indicated by the dash-dotted line in Fig. 1), and the fluorescence image of actin filaments was obtained by excitation with a 532 nm laser (COMPASS 315M-100; Coherent, Santa Clara, CA) that was circularly polarized with a quarter-wavelength plate (QWP). Emissions were detected at 560–620 nm for rhodamine and BODIPY, and at >660 nm for quantum dots (the dashed line in Fig. 1). The two beams were separated by a dichroic mirror (DM; 400–530 nm).
The phase-contrast image was acquired with a CCD camera (CCD-300; Dage-MTI, Michigan City, IN), and the fluorescence image was acquired with a CCD camera (MC681SPD-R0B0; Texas Instruments, Dallas, TX) equipped with an image intensifier (VS-1845; VideoScope, Dulles, VA). The two images were then combined in one frame by an image combiner (MV-40F; FOR-A, Tokyo, Japan) and captured by a personal computer (Macintosh G4; Apple, Tokyo, Japan). The position of the bead was determined by calculating the centroid of its intensity profile with a nanometer-order spatial resolution (Fig. 2).
Figure 2.
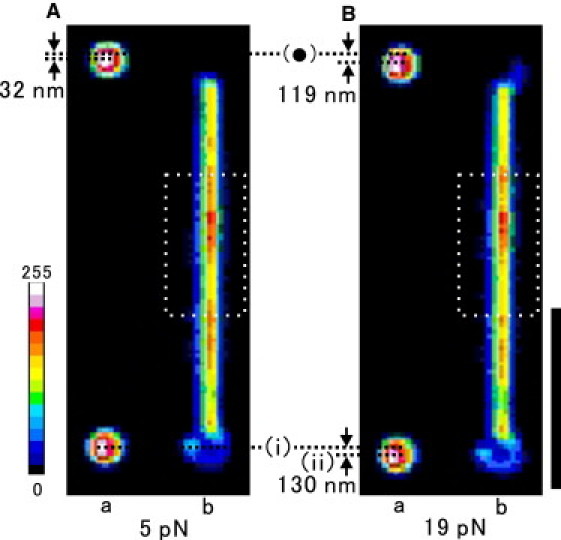
(a) Phase-contrast image of beads and (b) fluorescence image of a TMR-labeled actin filament after the application of force: 5 pN (A) or 19 pN (B). Both images are averaged over ∼2.5 s. The fixed trap center is indicated by (•), and the positions of the manipulated bead under the applied force of ∼5 pN and 19 pN are indicated by i and ii, respectively. The force applied to a single actin filament can be estimated by the displacement from the trap center of the upper (fixed) bead. The pixel size was 65.8 nm for the phase-contrast image and 92.6 nm for the fluorescence image. The position of the upper and lower beads in the phase-contrast image (left) was adjusted to be right next to the same bead in the fluorescence image (right). Scale bar: 5 μm (for the fluorescence image). The fluorescence intensity of the labeled actin filament was measured within the rectangular region indicated by a white dashed line (3.3 μm long × 1.8 μm wide), and linearly scaled in pseudocolor (color palette on the left).
Optical tweezers
As shown in Fig. 1, the YAG laser beam (1064 nm, Millennia IR; Spectra Physics, Mountain View, CA) was led into the microscope. The polarization of the laser light was changed from vertical to diagonal with a half-wavelength plate (HWP), and the beam was split into two equal beams with a polarization beam splitter (PBS). Next, both beams were combined again in the same optical path by another PBS and circularly polarized with a QWP. One of the beams (the upper path in Fig. 1) was fixed and used to measure force (fixed trap), and the other (the lower path in Fig. 1) was controlled and used to manipulate and apply force to an actin filament through the bead attached to one of its end regions, by tilting the mirror (manipulated trap). The large (up to 1 μm) two-dimensional displacement of the manipulated bead within the sample plane was achieved with the use of step motors (SGSP-13ACT-B0; Sigma Koki) and their controller (SHOT-602; Sigma Koki). Periodic displacement of the bead was induced by using a piezoelectric instrument (ASM003; THORLAB, Newton, NJ) with a function generator (DF1906; NF Electronic Instruments, Yokohama, Japan) through an amplifier (ENP-151U; Echo Electric, Tokyo, Japan). The trap stiffness of the dual-trap optical tweezers was calibrated as described previously (20) and was 0.16 pN nm−1 at the laser power of 60 mW (measured before entering the objective lens) for both the fixed trap and the manipulated trap.
Measurement of the fluorescence intensity of single actin filaments under external force
The measurement chamber was constructed with two coverslips (24 mm × 60 mm and 18 mm × 18 mm; Matsunami, Osaka, Japan) separated by two spacers made from double-sided adhesive tape, each 0.1 mm thick and 2 mm wide. A sample was prepared as follows: 1 μL of labeled actin filaments solution (20 nM) was mixed with 23 μL of the assay buffer (10 mM Tris-HCl (pH 8.0), 4.2 mM EGTA, 2 mM MgCl2, 0.2% (w/v) methylcellulose, 20 mM DTT, 0.20 mg mL−1 glucose oxidase, 0.05 mg mL−1 catalase, 6.0 mg mL−1 glucose, 100 nM nonfluorescent phalloidin) containing NEM-HMM-coated beads (0.001% (v/v)), and immediately introduced into the measurement chamber, which was then sealed with nail polish to avoid evaporation of the solution. In the case of RP-actin, the final concentration of free RP was estimated to be ∼1 nM. The addition of methylcellulose made it easier to attach the two ends of a floating single actin filament to the two NEM-HMM-coated beads, trapped with optical tweezers. In addition, it suppressed the Brownian motion, decreasing the possibility that free fluorescent actin filaments would enter the field of view and disturb the fluorescence imaging of the trapped actin filament.
For the measurement, the optical trap was first turned on, and two NEM-HMM-coated beads freely moving in solution were trapped 5–10 μm apart with dual-trap optical tweezers. Next, an actin filament (7–15 μm long) free floating in solution was attached at both end regions to the trapped beads as shown in Fig. 2, and, using a closed-loop piezo stage, the axis of the filament was adjusted to be parallel to the glass surface ∼5 μm above it. Then, by tilting the mirror with a step motor, the bead in the manipulated trap (the lower bead in Fig. 2) was pulled until a force of ∼5 pN was applied to the filament by monitoring in real time the position of the upper bead (with CREST Image, the real-time, multifunction image processor), resulting in a reduction of the bending Brownian movement of the filament. We confirmed that large fluctuations of the fluorescence intensity due to the bending Brownian movement were suppressed when the applied force was larger than 5 pN (see Fig. S1 in the Supporting Material). The addition of 0.2% (w/v) methylcellulose was also useful for minimizing the bending Brownian movement of the trapped actin filament. Before this step, the intensity of the incident laser beam (532 nm) for fluorescence imaging was reduced as much as possible to minimize photobleaching. Then a force of ∼5 to ∼20 pN was repeatedly applied to the actin filament in a rectangular or triangular waveform by tilting the mirror with a piezo module. At the same time, both the fluorescence intensity of the labeled actin filament within a rectangular region (3.3 μm long and 1.8 μm wide; Fig. 2) and the bead displacement were measured on the PC with the use of ImageJ software. For measuring the fluorescence intensity of the labeled filament, the power of the incident laser beam was optimized by using neutral density (ND) filters. Each set of experiments, starting from the preparation of assay buffer to the final measurement, was performed within 30 min because of the limited lifetime of the oxygen scavenging system.
Fluorescence spectroscopy of labeled actin
To evaluate the effect of TMR and BODIPY labeling on the polymerization of actin, the fluorescence spectrum of 20%-labeled actin during polymerization was measured as follows: First we prepared 2.5 μM G-actin, 0.5 μM of which was dye-labeled, in buffer G (10 mM Tris-HCl (pH 8.0), 50 μM CaCl2, 1 mM ATP, and 20 mM DTT) containing 0.1 mg mL−1 BSA to inhibit the nonspecific adsorption of actin molecules to the quartz cell surface. The polymerization of actin was initiated by adding a 1/20 volume of salt solution containing 1 M KCl and 40 mM MgCl2, and the fluorescence spectra were measured at 27°C using the fluorescence spectrometer (F-4500, Hitachi, Tokyo, Japan) with the excitation wavelength of 532 nm. The scan time of each spectrum was ∼4 s.
Results
Selection of suitable dyes
We first needed to find the most suitable fluorescent dyes for our experiments. The minimum requirements for the dyes were to 1), enable the acquisition of high-contrast images of single actin filaments free floating in solution; and 2), ensure slow photobleaching (a photobleaching lifetime of at least 1 min). After we examined about 10 different dyes, we found that TMR and BODIPY satisfied these two requirements, whereas, for example, Cy5 and Alexa647 were not appropriate because fast photobleaching occurred after both the laser for optical tweezers and the laser for single-filament imaging were turned on at the same time. On the other hand, fluoresceine, NBD, and BODIPY-FL did not satisfy the first requirement.
Concerning the binding site of the dyes on actin molecules, we chose Cys374 because it is has been well characterized by previous studies, and it is easy to incorporate the dyes into this residue. Additionally, we examined RP attached to the boundary region of the three adjacent actin molecules within the filament (21), because RP also met both requirements. As a control, we examined QD-actin filaments, the fluorescence intensity of which is expected to be independent of the filament distortion.
Fluorescence imaging of single actin filaments under various external forces
To measure the fluorescence intensity of single actin filaments under an external force, it is desirable to suppress the bending Brownian movement of the filament. Note that the fluorescence intensity becomes smaller when the fluorescence image is defocused due to the bending Brownian movement. We found that the fluctuation of the fluorescence intensity due to the Brownian movement was sufficiently reduced when the filament was straightened by applying a force larger than ∼5 pN in the presence of 0.2% (w/v) methylcellulose (Fig. S1). A typical fluorescence image under external forces of ∼5 and ∼20 pN is shown in Fig. 2. The phase-contrast and fluorescence images were captured at a video rate (one frame every 1/30 s), but for quantitative analysis both images were averaged over 4/30 s (four frames).
To apply the force to individual actin filaments, we attached NEM-HMM-coated beads to both end regions of a filament and manipulated the beads with the dual-trap optical tweezers (Fig. 1) (22). First, we examined the maximum force, which can be repeatedly applied to the filament. We found that in many cases the beads detached from the filament irrespective of the value of the applied force, but even when the bead-filament attachment was strong enough, there was an upper limit for the applied force because the filament tended to be severed at the bead-filament interface. This probably was because the filament had been significantly bent and twisted in that region. The average force at which the filaments broke up was 23.3 ± 3.9 pN (n = 16; in addition to this, in two cases the filament was not severed even under 30 pN force, which is the maximal force that can be quantified in our setup) at the loading rate of ∼10 pN s−1. Such a low severing force is understandable because the force required to sever a single actin filament is dramatically lowered by only slightly twisting the filament (7). Therefore, we decided to examine the effect of an external force of ∼5 to ∼20 pN on the fluorescence intensity of the actin filaments.
Upon application of the external force, the distance between the two beads constantly increased, for example, to as large as 43 (= 130 − (119 − 32)) nm for the application of the external force of 14 (= 19 − 5) pN, in the case shown in Fig. 2. This is attributable to the inward rotation of the trapped beads because initially the filament does not coincide with the line connecting the centers of the two beads (11). However, sometimes an increase in the distance between the two beads exceeded 100 nm, and occasionally the applied force dropped stepwise. These events were considered to correspond to the partial detachment of actin filament from the bead surface. We did not analyze these cases because they resulted in a significant displacement of the filament from the rectangular region, in which the fluorescence intensity was measured.
Effect of force applied in a rectangular waveform on the fluorescence intensity of single actin filaments
To examine the relation between the fluorescence intensity of single actin filaments and the imposed force, we applied force in a rectangular waveform, repeatedly switching in a stepwise manner between ∼5 and ∼20 pN at 5-s intervals, as shown in Fig. 3, Aa (Movie S1), Ba (Movie S2), and Ca (Movie S3) for TMR-, BODIPY-, and RP-actin, respectively. Three cycles were performed for a single measurement. In Fig. 3, Ab, Bb, and Cb, the average fluorescence intensity at each applied force was obtained by averaging the fluorescence intensity of 17 points (4/30 s × 17 = 2.27 s; the data points obtained just before and after the tension change were excluded) without compensating for the photobleaching. The average fluorescence intensity thus obtained was plotted against the applied force after correcting for the photobleaching (Fig. 3, Ac, Bc, and Cc). The compensation factor (the photobleaching lifetime, τ) was determined from the values of the fluorescence intensity averaged over eight points (= ∼1 s) before and after the measurements during each of the three cycles, assuming that the time course of photobleaching is proportional to exp(−t/τ). The value of τ thus obtained was 110 ± 10 s (mean ± SE, n = 23).
Figure 3.
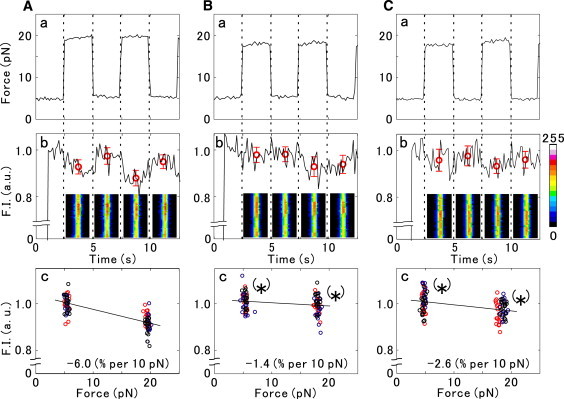
Effect of the external force, imposed in a rectangular waveform, on the fluorescence intensity of single actin filaments. Actin filaments were labeled with (A) TMR (see also Movie S1), (B) BODIPY (Movie S2), or (C) RP (Movie S3). (a) The applied force was switched between ∼5 and ∼20 pN, and the cycle was repeated three times during each measurement. The force was kept constant for 2.5 s before switching back, as shown by vertical dotted lines. (b) During the same time intervals, the total fluorescence intensity of each filament within the rectangular fluorescence micrograph shown in each time interval (corresponding to the rectangular region indicated by the white dashed line in Fig. 2) was measured in arbitrary units averaged over 4/30 s, or four frames. The fluorescence intensity digitally recorded with 8-bit resolution is shown here by pseudocolor representation. The red circles represent the average ± SD of fluorescence intensity obtained during each time interval. The data are shown without compensating for photobleaching. (c) The average values of fluorescence intensity obtained over three cycles at ∼5 pN and ∼20 pN for the same actin filament as in a and b. Data points obtained at each cycle are shown by red (first cycle), blue (second cycle), and black (the third cycle is not shown in a and b) circles. After correcting for the effect of photobleaching (for details, see text), the fluorescence intensity versus force relationship was obtained by linear regression analysis, and its slope is indicated in the bottom-right corner. Asterisks indicate the statistically significant difference between the two data sets in each figure (p < 0.05; Student's t-test).
Fig. 3, Ab, Bb, and Cb show that the fluorescence intensity of TMR-actin substantially decreased with an application of force up to ∼20 pN, whereas the changes in the fluorescence intensity of BODIPY-actin and RP-actin were relatively small. In this example the decrease in the fluorescence intensity after applying the external force (determined by linear regression analysis) per 10 pN of the applied force was found to be 6.0% for TMR-actin, 1.4% for BODIPY-actin, and 2.6% for RP-actin.
Effect of force applied in a triangular waveform on the fluorescence intensity of single actin filaments
Next, we applied force in a triangular waveform with the peak-to-peak amplitude of ∼15 pN at 0.2 Hz, performing three cycles (Fig. 4, Aa for TMR-actin, Ba for BODIPY-actin, and Ca for RP-actin). The corresponding change in the fluorescence intensity is shown in Fig. 4, Ab, Bb, and Cb, compensating for the effect of photobleaching in the same way as described above. The obtained relationship between the fluorescence intensity and the imposed force is shown in Fig. 4, Ac, Bc, and Cc. The linear regression analysis of the data shown in Fig. 4 revealed that the extent of quenching per 10 pN of the applied force was 5.6% for TMR-actin (Fig. 4 Ac) and 1.3% for both BODIPY-actin (Fig. 4 Bc) and RP-actin (Fig. 4 Cc).
Figure 4.
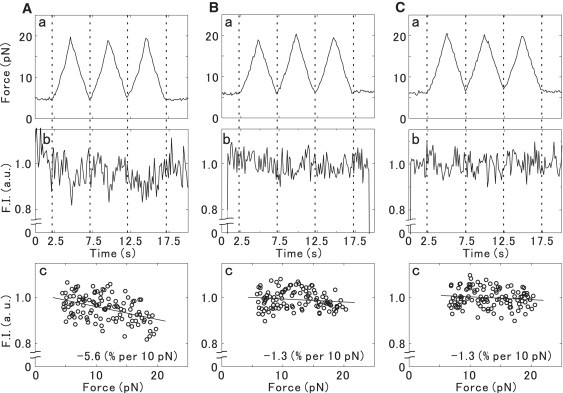
Effect of the external force, imposed in a triangular waveform, on the fluorescence intensity of single actin filaments. Actin filaments were labeled with (A) TMR, (B) BODIPY, or (C) RP. (a) The applied force was changed between ∼5 pN and ∼20 pN, and the cycle was repeated three times during each measurement. (b) During the same time intervals, the total fluorescence intensity of each filament within the rectangular region (see Fig. 2) was measured in arbitrary units averaged over 4/30 s, or four frames. (c) The values of fluorescence intensity obtained for the same actin filament as in a and b are plotted. Straight lines indicate the fluorescence intensity versus the force relationship obtained by linear regression analysis, and its slope is shown in the bottom-right corner. In both b and c, the effect of photobleaching on the fluorescence intensity is taken into account (for details, see text).
Finally, we investigated the effect of force applied in a triangular waveform on the QD-actin filaments. The fluorescence intensity showed significant fluctuation compared with Fig. 4. This is mainly attributable to the fluorescence blinking of quantum dots. From the linear regression analysis of the data, we determined the extent of quenching, which was 0.1% per 10 pN of the applied force (Fig. S2).
These measurements were performed on several different actin filaments. The results obtained by applying the external force in the rectangular and/or triangular waveforms are summarized in Table 1. The extent of quenching due to the applied force was significantly larger in TMR-actin than in BODIPY- and RP-actins. In all three cases the extent of quenching was significantly larger than in the control QD-actin.
Table 1.
Effect of the applied force on the fluorescence quenching of labeled actin
| Rectangular waveform | ||||
|---|---|---|---|---|
| TMR-actin | BODIPY-actin∗ | RP-actin∗ | QD-actin | |
| Extent of quenching (% per 10 pN) | 5.5 ± 0.6 | 1.9 ± 0.3 | 1.9 ± 0.4 | |
| n (N) | 8 (5) | 8 (4) | 8 (4) | |
| Triangular waveform | ||||
| Extent of quenching (% per 10 pN) | 6.2 ± 0.5 | 2.0 ± 0.4 | 1.9 ± 0.4 | 0.18 ± 0.44 |
| n (N) | 10 (6) | 9 (6) | 10 (7) | 17 (5) |
The extent of quenching is expressed as mean ± SE, n is the number of experiments, and N is the number of actin filaments examined. Asterisks indicate the statistically significant difference relative to TMR-actin (p < 0.005; Student's t-test) and QD-actin (p < 0.05; Student's t-test).
Characterization of fluorescence spectra during the G-F transformation of actin
We examined the changes in the fluorescence spectra of the labeled actins accompanying the G-F transformation to obtain information on the changes in the microenvironment around Cys374, where the fluorescent dye was incorporated. Fig. 5 shows the time course of the changes in the fluorescence spectra of TMR-actin (Fig. 5 A) and BODIPY-actin (Fig. 5 B), measured in solution after the addition of salts. The emission spectra showed a peak at ∼575 nm (TMR-actin) or ∼570 nm (BODIPY-actin). Upon polymerization, the emission spectra of TMR-actin showed a substantial increase in intensity with a slight red shift. This result suggests that the microenvironment of TMR attached to Cys374 changes from aqueous to hydrophobic upon polymerization. On the other hand, the emission spectra of BODIPY-actin showed a slight blue shift without a large change in the intensity (23). Thus, the sensitivity for monitoring changes in the fluorescence spectrum largely depends on the fluorescent dye.
Figure 5.
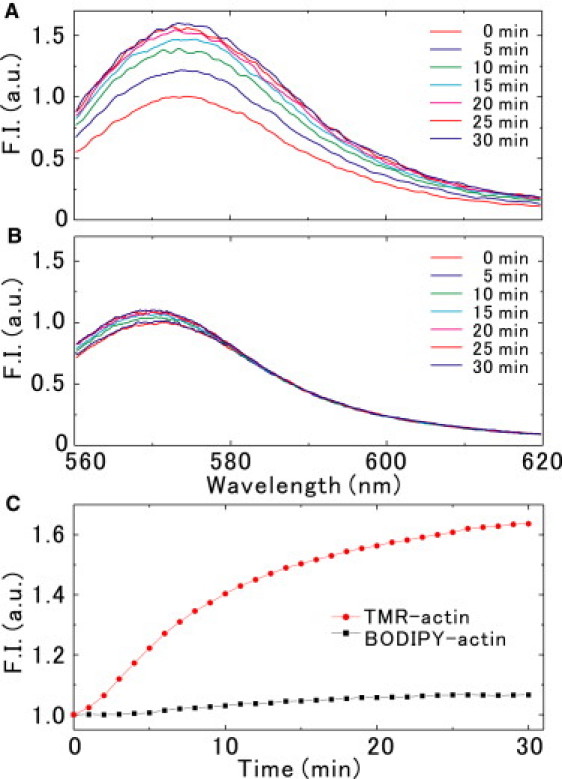
Change in the fluorescence spectra of (A) TMR-actin and (B) BODIPY-actin after the addition of salts. (C) The time course of the fluorescence intensity integrated in the range between 560 nm and 620 nm for TMR-actin (red circles) and BODIPY-actin (black squares).
In the microscopic measurements described in the previous paragraphs, we obtained the fluorescence intensity of single actin filaments by integrating the spectra over 560–620 nm using a band-path filter (Fig. 1). Therefore, we next measured the time course of the total fluorescence intensity within the same wavelength range (Fig. 5 C). We found that in solution the fluorescence intensity of TMR-actin increased 1.65-fold upon G-F transformation, whereas that of BODIPY-actin increased only 1.06-fold. We also confirmed that the degree of increase in the fluorescence intensity upon polymerization was independent of the labeling ratio, at least up to 20% (24,25).
Discussion
Fluorescence imaging of single actin filaments under optical microscopy
RP-actin has been extensively used to visualize the sliding movement in an in vitro motility assay (5,26). RP-actin filaments have also been used to measure the force developed by interacting myosin molecules, for example, individual HMM and S1 molecules randomly adhered to a glass surface (27) or myosin cross-bridges within an isolated A-band, i.e., an assembly of thick filaments (28). However, until now, no reports have been published (to our knowledge) regarding the detection of changes in the fluorescence spectra of single actin filaments when force—either external or developed by the interacting molecular motors—is applied.
In this study we sought to detect the distortion of single actin filaments upon application of an external force through changes in the fluorescence intensity of a dye bound to a specific site (i.e., Cys374 or the phalloidin-binding site) on an actin molecule. The critical problems for the quantitative analysis were 1), to find appropriate dyes that have high fluorescence intensity and are stable against photobleaching, as described in Results; and 2), to maintain the actin filament within a sample plane, that is, to reduce the movement along the Z-axis by straightening the filament with the application of the external force.
Concerning the first problem, rhodamine-maleimide was chosen because of its high resistance to photobleaching and very efficient labeling of Cys374. Although the staining does affect the polymerizability of actin (24,29,30), this difficulty can be overcome by using a labeling ratio lower than ∼20% (22,23) and stabilizing the filamentous structure with nonfluorescent phalloidin.
To solve the second problem, we initially tried to fix one end of an actin filament to the surface of a glass plateau or a large plastic bead, through the NEM-treated HMM adhered to the glass or bead surface. We then manipulated the other end of the filament with optical tweezers using the attached bead. However, this experimental system turned out to be inappropriate for our purposes because it was difficult to suppress the tilting of the filament along the Z-axis and to remove the extra actin filaments randomly attached to the glass surface that contributed to the background fluorescence. On the other hand, with the use of dual-trap optical tweezers, actin filaments can be held in the same plane every time. The use of the gelsolin beads that had been used to manipulate the B-end of actin filaments (20) was also not appropriate because it was difficult to find a sufficiently long filament (longer than ∼10 μm) for the measurements.
After such trial and error, we finally found that the second condition is satisfied when the dual-trap technique is applied. That is, the two beads attached to the end regions of an individual actin filament were separately trapped with two laser beams, and one of the beads was independently manipulated (Figs. 1 and 2). We were careful to avoid breaking the filament, especially at the bead-filament interface, when the external force was applied. The acute bending of actin filaments near the bead-filament binding interface was unavoidable because of the inward rotation of the trapped beads. Therefore, the maximal force that could be applied to the filament was limited in our setup to ∼20 pN. The force was applied in a rectangular or triangular waveform so that the larger force could be applied in a shorter period of time.
Force-dependent distortion of a single actin filament
In this study we found that the fluorescence intensity of dyes attached to actin filaments decreased upon application of an external load irrespective of the dye and its binding site on actin. However, the extent of quenching per 10 pN of the applied force depended on the dye used (Table 1), i.e., the extent of quenching of TMR-actin was larger than that of BODIPY-actin and RP-actin.
It should be noted that the extent of quenching correlates with the degree of changes in the fluorescence intensity accompanying the G-F transformation (Table 1 and Fig. 5 C); that is, the larger the fluorescence intensity change, the larger is the extent of quenching. This suggests that the distortion of actin molecules induced by the external force shifts the microenvironment around the attached dye toward that of G-actin. To confirm this, it would be interesting to determine whether the applied force induces the spectral shift observed in solution (Fig. 5, A and B) in single actin filaments.
The above considerations suggest that the larger the increase in the fluorescence intensity upon polymerization, the larger is the extent of the tension-induced quenching. In this respect, the most sensitive dye among those found up to now is pyrene, which shows an ∼20-fold increase in fluorescence intensity upon polymerization (31). However, pyrene was not appropriate for our measurements, mainly because its λex is in the UV region, which complicates the fluorescence imaging.
In addition, it would be interesting to examine whether the fluorescence intensity of labeled actin filaments increases with the application of tension when the filament is labeled with a dye whose fluorescence intensity decreases upon polymerization of actin. An example of such a dye is Cy5-maleimide (T. Shimozawa, unpublished observation). Unfortunately, as mentioned in the Results, the rate of photobleaching of Cy5 was too fast to image the filaments under our experimental conditions.
On the other hand, there may be another reason for the larger extent of the force-induced quenching of TMR-actin. It was previously suggested that the low polymerizability of TMR-actin is attributable to loosening of the longitudinal actin-actin bond (30,32). In fact, Cys374 is located just near the interface of the actin-actin longitudinal bond (21,33). Thus, it may be possible that the microenvironment around the labeling site becomes more exposed to the aqueous environment when the filament is stretched by the application of force.
The small force-dependent changes observed in RP-actin may also be attributable to the same mechanism as described above for TMR- and BODIPY-actins; that is, the local environment around rhodamine at the phalloidin-binding site (21) on actin may also be shifting to the aqueous one upon the application of force. However, the similarity of the extent of change in the fluorescence intensity between RP-actin and BODIPY-actin must be accidental. It should be noted that the fluorescence intensity of RP becomes 10-fold higher upon binding to actin filaments (34), which implies that RP may be very sensitive to changes in local environment. On the other hand, there is a possibility that the decrease in fluorescence intensity is attributable to a gradual dissociation of RP under the applied force, although the binding lifetime of RP is reported to be longer than 103 s (35). However, this notion can be dismissed because the fluorescence intensity changed reversibly against the application of both the rectangular and triangular forces, and the apparent photobleaching lifetime was indistinguishable from that of TMR- and BODIPY-actins. If RP had dissociated from the actin filaments in a force-dependent manner, the fluorescence intensity would have more rapidly decreased, because >100-fold higher concentrations of nonfluorescent phalloidin were always included in the measurement solution.
Toward the development of a bio-nano strain gauge
In summary, this study demonstrates that it is possible to monitor in real time and quantitatively characterize the force imposed on an individual actin filament, in the range of ∼5 pN to several tens of piconewtons, by measuring the fluorescence intensity through the image processing. The force that can be monitored with this technique fits within the range experienced by each thin filament in striated muscle. To improve the technique presented here, it would be desirable to identify dyes that are more sensitive to changes in microenvironment. Our results suggest that the most suitable dye for this technique should emit within a visible light range and, like pyrene, exhibit large changes in the fluorescence spectra upon polymerization. When this technique is actually applied to image stress distribution within a cell, the high sensitivity of the fluorescence intensity of the employed dye to the imposed tension becomes a crucial factor, which would allow one to detect small variations in fluorescence intensity even at low labeling ratio. In any case, the essential properties of a labeled actin filament that enable it to function as a bio-nano strain gauge are the sensitivity and reproducibility of its fluorescence properties under an external load, regardless of the molecular mechanism involved.
Acknowledgments
We thank Dr. S. V. Mikhailenko of Waseda University for his critical reading of the manuscript. We also thank Mr. Y. Oguchi of Waseda University for his technical assistance on the control experiments. This work was partly supported by Grants-in-Aid for Specially Promoted Research, Scientific Research (A), the 21st Century COE Program (Physics of Self-Organization Systems) at Waseda University, “Academic Frontier” Project and “Establishment of Consolidated Research Institute for Advanced Science and Medical Care” to S.I., and for Young Scientists (B) and Scientific Research on Priority Areas to T.S. from the Ministry of Education, Culture, Sports, Science and Technology (MEXT) of Japan.
Footnotes
Togo Shimozawa's present address is Department of Physics, Faculty of Science, University of Tokyo, Tokyo, Japan.
Supporting Material
References
- 1.Ingber D.E. Tensegrity: the architectural basis of cellular mechanotransduction. Annu. Rev. Physiol. 1997;59:575–599. doi: 10.1146/annurev.physiol.59.1.575. [DOI] [PubMed] [Google Scholar]
- 2.Chicurel M.E., Chen C.S., Ingber D.E. Cellular control lies in the balance of forces. Curr. Opin. Cell Biol. 1998;10:232–239. doi: 10.1016/s0955-0674(98)80145-2. [DOI] [PubMed] [Google Scholar]
- 3.Orr A.W., Helmke B.P., Blackman B.R., Schwartz M.A. Mechanisms of mechanotransduction. Dev. Cell. 2006;10:11–20. doi: 10.1016/j.devcel.2005.12.006. [DOI] [PubMed] [Google Scholar]
- 4.Fujime S., Ishiwata S. Dynamic study of f-actin by quasielastic scattering of laser light. J. Mol. Biol. 1971;62:251–265. doi: 10.1016/0022-2836(71)90144-6. [DOI] [PubMed] [Google Scholar]
- 5.Yanagida T., Nakase M., Nishiyama K., Oosawa F. Direct observation of motion of single f-actin filaments in the presence of myosin. Nature. 1984;307:58–60. doi: 10.1038/307058a0. [DOI] [PubMed] [Google Scholar]
- 6.Isambert H., Venier P., Maggs A.C., Fattoum A., Kassab R. Flexibility of actin filaments derived from thermal fluctuations. Effect of bound nucleotide, phalloidin, and muscle regulatory proteins. J. Biol. Chem. 1995;270:11437–11444. doi: 10.1074/jbc.270.19.11437. [DOI] [PubMed] [Google Scholar]
- 7.Tsuda Y., Yasutake H., Ishijima A., Yanagida T. Torsional rigidity of single actin filaments and actin-actin bond breaking force under torsion measured directly by in vitro micromanipulation. Proc. Natl. Acad. Sci. USA. 1996;93:12937–12942. doi: 10.1073/pnas.93.23.12937. [DOI] [PMC free article] [PubMed] [Google Scholar]
- 8.Yasuda R., Miyata H., Kinosita K., Jr. Direct measurement of the torsional rigidity of single actin filaments. J. Mol. Biol. 1996;263:227–236. doi: 10.1006/jmbi.1996.0571. [DOI] [PubMed] [Google Scholar]
- 9.Kojima H., Ishijima A., Yanagida T. Direct measurement of stiffness of single actin filaments with and without tropomyosin by in vitro nanomanipulation. Proc. Natl. Acad. Sci. USA. 1994;91:12962–12966. doi: 10.1073/pnas.91.26.12962. [DOI] [PMC free article] [PubMed] [Google Scholar]
- 10.Liu X., Pollack G.H. Mechanics of f-actin characterized with microfabricated cantilevers. Biophys. J. 2002;83:2705–2715. doi: 10.1016/S0006-3495(02)75280-6. [DOI] [PMC free article] [PubMed] [Google Scholar]
- 11.Dupuis D.E., Guilford W.H., Wu J., Warshaw D.M. Actin filament mechanics in the laser trap. J. Muscle Res. Cell Motil. 1997;18:17–30. doi: 10.1023/a:1018672631256. [DOI] [PubMed] [Google Scholar]
- 12.Huxley H.E., Stewart A., Sosa H., Irving T. X-ray diffraction measurements of the extensibility of actin and myosin filaments in contracting muscle. Biophys. J. 1994;67:2411–2421. doi: 10.1016/S0006-3495(94)80728-3. [DOI] [PMC free article] [PubMed] [Google Scholar]
- 13.Wakabayashi K., Sugimoto Y., Tanaka H., Ueno Y., Takezawa Y. X-ray diffraction evidence for the extensibility of actin and myosin filaments during muscle contraction. Biophys. J. 1994;67:2422–2435. doi: 10.1016/S0006-3495(94)80729-5. [DOI] [PMC free article] [PubMed] [Google Scholar]
- 14.Spudich J.A., Watt S. The regulation of rabbit skeletal muscle contraction. I. Biochemical studies of the interaction of the tropomyosin-troponin complex with actin and the proteolytic fragments of myosin. J. Biol. Chem. 1971;246:4866–4871. [PubMed] [Google Scholar]
- 15.Kondo H., Ishiwata S. Uni-directional growth of f-actin. J. Biochem. (Tokyo) 1976;79:159–171. doi: 10.1093/oxfordjournals.jbchem.a131043. [DOI] [PubMed] [Google Scholar]
- 16.Weeds A.G., Pope B. Studies on the chymotryptic digestion of myosin. Effects of divalent cations on proteolytic susceptibility. J. Mol. Biol. 1977;111:129–157. doi: 10.1016/s0022-2836(77)80119-8. [DOI] [PubMed] [Google Scholar]
- 17.Houk T.W., Jr., Ue K. The measurement of actin concentration in solution: a comparison of methods. Anal. Biochem. 1974;62:66–74. doi: 10.1016/0003-2697(74)90367-4. [DOI] [PubMed] [Google Scholar]
- 18.Young D.M., Himmelfarb S., Harrington W.F. On the structural assembly of the polypeptide chains of heavy meromyosin. J. Biol. Chem. 1965;240:2428–2436. [PubMed] [Google Scholar]
- 19.Kinosita K., Jr., Itoh H., Ishiwata S., Hirano K., Nishizaka T. Dual-view microscopy with a single camera: real-time imaging of molecular orientations and calcium. J. Cell Biol. 1991;115:67–73. doi: 10.1083/jcb.115.1.67. [DOI] [PMC free article] [PubMed] [Google Scholar]
- 20.Nishizaka T., Miyata H., Yoshikawa H., Ishiwata S., Kinosita K., Jr. Unbinding force of a single motor molecule of muscle measured using optical tweezers. Nature. 1995;377:251–254. doi: 10.1038/377251a0. [DOI] [PubMed] [Google Scholar]
- 21.Lorenz M., Popp D., Holmes K.C. Refinement of the f-actin model against x-ray fiber diffraction data by the use of a directed mutation algorithm. J. Mol. Biol. 1993;234:826–836. doi: 10.1006/jmbi.1993.1628. [DOI] [PubMed] [Google Scholar]
- 22.Finer J.T., Simmons R.M., Spudich J.A. Single myosin molecule mechanics: piconewton forces and nanometre steps. Nature. 1994;368:113–119. doi: 10.1038/368113a0. [DOI] [PubMed] [Google Scholar]
- 23.Terada N., Shimozawa T., Ishiwata S., Funatsu T. Size distribution of linear and helical polymers in actin solution analyzed by photon counting histogram. Biophys. J. 2007;92:2162–2171. doi: 10.1529/biophysj.106.098871. [DOI] [PMC free article] [PubMed] [Google Scholar]
- 24.Amann K.J., Pollard T.D. Direct real-time observation of actin filament branching mediated by arp2/3 complex using total internal reflection fluorescence microscopy. Proc. Natl. Acad. Sci. USA. 2001;98:15009–15013. doi: 10.1073/pnas.211556398. [DOI] [PMC free article] [PubMed] [Google Scholar]
- 25.Fujiwara I., Takahashi S., Tadakuma H., Funatsu T., Ishiwata S. Microscopic analysis of polymerization dynamics with individual actin filaments. Nat. Cell Biol. 2002;4:666–673. doi: 10.1038/ncb841. [DOI] [PubMed] [Google Scholar]
- 26.Kron S.J., Spudich J.A. Fluorescent actin filaments move on myosin fixed to a glass surface. Proc. Natl. Acad. Sci. USA. 1986;83:6272–6276. doi: 10.1073/pnas.83.17.6272. [DOI] [PMC free article] [PubMed] [Google Scholar]
- 27.Kishino A., Yanagida T. Force measurements by micromanipulation of a single actin filament by glass needles. Nature. 1988;334:74–76. doi: 10.1038/334074a0. [DOI] [PubMed] [Google Scholar]
- 28.Suzuki M., Fujita H., Ishiwata S. A new muscle contractile system composed of a thick filament lattice and a single actin filament. Biophys. J. 2005;89:321–328. doi: 10.1529/biophysj.104.054957. [DOI] [PMC free article] [PubMed] [Google Scholar]
- 29.Otterbein L.R., Graceffa P., Dominguez R. The crystal structure of uncomplexed actin in the ADP state. Science. 2001;293:708–711. doi: 10.1126/science.1059700. [DOI] [PubMed] [Google Scholar]
- 30.Kudryashov D.S., Phillips M., Reisler E. Formation and destabilization of actin filaments with tetramethylrhodamine-modified actin. Biophys. J. 2004;87:1136–1145. doi: 10.1529/biophysj.104.042242. [DOI] [PMC free article] [PubMed] [Google Scholar]
- 31.Kouyama T., Mihashi K. Fluorimetry study of N-(1-pyrenyl)iodoacetamide-labelled f-actin. Local structural change of actin protomer both on polymerization and on binding of heavy meromyosin. Eur. J. Biochem. 1981;114:33–38. [PubMed] [Google Scholar]
- 32.Kudryashov D.S., Sawaya M.R., Adisetiyo H., Norcross T., Hegyi G. The crystal structure of a cross-linked actin dimer suggests a detailed molecular interface in F-actin. Proc. Natl. Acad. Sci. USA. 2005;102:13105–13110. doi: 10.1073/pnas.0506429102. [DOI] [PMC free article] [PubMed] [Google Scholar]
- 33.Holmes K.C., Popp D., Gebhard W., Kabsch W. Atomic model of the actin filament. Nature. 1990;347:44–49. doi: 10.1038/347044a0. [DOI] [PubMed] [Google Scholar]
- 34.Harada Y., Sakurada K., Aoki T., Thomas D.D., Yanagida T. Mechanochemical coupling in actomyosin energy transduction studied by in vitro movement assay. J. Mol. Biol. 1990;216:49–68. doi: 10.1016/S0022-2836(05)80060-9. [DOI] [PubMed] [Google Scholar]
- 35.De La Cruz E.M., Pollard T.D. Transient kinetic analysis of rhodamine phalloidin binding to actin filaments. Biochemistry. 1994;33:14387–14392. doi: 10.1021/bi00252a003. [DOI] [PubMed] [Google Scholar]
Associated Data
This section collects any data citations, data availability statements, or supplementary materials included in this article.