

Abstract
In this study, we demonstrate the applicability of functionalized alginate to serve as a platform for the covalent cross-linking or immobilization of complimentary phosphine functionalized groups via the chemoselective Staudinger ligation scheme. Azide groups were covalently linked to alginate through a heterobifunctional polyethylene glycol (PEG) linker and carbodiimide. Degree of azide functionalization was varied as a function of carbodiimide concentration and determined by proton nuclear magnetic resonance (1H NMR) and infrared spectroscopy. Spontaneous and covalently cross-linked alginate-PEG gels were generated via the Staudinger ligation scheme upon incubation of the azide functionalized alginate with PEG chains having 1-methyl-2-diphenylphosphino-terephthalate (MDT) as end groups. Modulation of the MDT to N3 ratio resulted in variability of gel characteristics. In addition, azide functionalized alginate retained its capacity to instantaneously form hydrogels via electrostatic interaction with multivalent cations such as Ca2+ and Ba2+. Subsequently, covalent linkage of phosphine functionalized agents post-gelation of the alginate was feasible, as illustrated via linkage of MDT-PEG-carboxyfluorescein. Capitalization of the chemoselective and cell compatible Staudinger ligation scheme for covalent cross-linking of alginate hydrogels may enhance the utility of this polymer for the stable encapsulation of various cell types, in addition to their use in the immobilization of labeling agents, proteins, and other bioactive molecules.
Keywords: Alginate, PEG, Staudinger ligation, hydrogels
Introduction
Hydrogel matrices have been used extensively in pharmaceutical, medical, and food industries. Alginate is one of the more common materials used, given its desirable physiochemical properties and high biocompatibility.1,2 Alginate, commonly isolated from brown algae, is a linear unbranched polysaccharide composed of (1–4)-linked β-D-mannuronate (M) and α-L-guluronate (G) monomers (Scheme 1).3 Along its polymeric chain, the monomers are organized in blocks of M, G, and M-G/G-M sequences. A particular advantageous characteristic of alginate solutions is the capacity to cross-link into hydrogels when exposed to multivalent cations.3, 4 Ionically cross-linked alginate hydrogels have been fabricated into various size and shapes for numerous applications, from cellular encapsulation to biosensor coating.5–8 Several parameters can influence the resulting gel strength, stability, and swelling, such as polymer concentration, molecular weight distribution, and M/G ratio, as well as cation type and concentration.3, 4
Scheme 1.

Structure of a sodium alginate fragment.
Chemical modification of alginate for a variety of applications has been the focus of numerous publications.9–12 The carboxylic groups and cis-diols in alginate monomers provide routes for chemical modification. The most common motivations for alginate modification has been: (1) to improve the mechanical stability of alginate hydrogel via covalent cross-linking of alginate chains, either independent or in addition to cation cross-linking; and (2) to serve to couple moieties for drug delivery, enhanced cellular adhesion, biosensing, etc.
The motivation behind enhancing the mechanical integrity of ionically cross-linked hydrogels is due to their notable instability over time, primarily due to the slow exchange of cations with sodium ions under physiological conditions, which typically leads to increased osmotic pressure within the hydrogel, gel swelling, and subsequent rupture.13 Researchers have attempted to modulate this instability through coating with polycations, such as poly-L-lysine; however, the addition of this polymer layer commonly leads to decreased biocompatibility.14–16 Covalent cross-linking of alginate chains, either to other alginate chains or interspersing polymers, has resulted in the increased stability and reduced swelling of alginate-based hydrogels.17–23 The use of photoactivatable groups is the most common method and has been well established in alginate, PEG, and alginate-PEG hydrogels;17–25 however, photoinitiator solutions, as well as the free radical generation following initiation of bond formation, can lead to cell toxicity, thereby reducing applicability to cell based systems.25–27
An additional subset of interest is on the functionalization of alginate with agents capable of converting these hydrogels to drug delivery systems or biosensors.9–11, 28 If the capacity of the alginate to form ionic hydrogels following chemical modification is retained, agents can be subsequently immobilized within the cross-linked matrix. For example, functionalization of alginate with biotin can provide for the affinity entrapment of agents such as enzymes, proteins, and peptides within the resulting hydrogel.10, 11, 28
With a focus on the use of highly cell-compatible ligation schemes, the goal of this study was to evaluate azide functionalized alginate as a novel platform for the chemoselective cross-linking of complimenting agents via Staudinger ligation (Scheme 2). Biocompatible, efficient, chemoselective, and catalyst-free, the recently introduced Staudinger ligation has been used for numerous biological applications, from cell surface modification to protein detection.29–34 To evaluate the capacity of azide functionalized alginate to covalently cross-link agents via Staudinger ligation, monofunctional or difunctional PEG polymers with complimentary phosphine groups were fabricated. Through co-incubation of azide-functionalized alginate and phosphine-terminated difunctional PEG, we illustrated the capacity of the polymers to form covalent bonds at a density capable of forming highly stable hydrogels. The kinetics of reactivity and the stability of the resulting gels were characterized. In addition, alginate-PEG-azide hydrogels were fabricated using ionic interactions to explore its capacity to serve as platforms for the covalent linkage of phosphine conjugated agents. A combination of both ionic and covalent bonding was also used for gel formation. Overall, this study establishes the utility of Staudinger ligation to covalently cross-link alginate and PEG polymers to form hydrogels, with the ability to modulate gel formation via degree of functionalization, as well as serving as platforms for the covalent conjugation of agents and/or markers, as summarized in Figure 1.
Scheme 2.

The Staudinger ligation reaction.
Figure 1.

Reagents used to fabricate gels. Alginate-PEG-N3 (1) can form gels via divalent ion cross-linking (e.g. Ba2+), as shown in A, or via incubation with MDT-PEG-MDT (2), where spontaneous covalent cross-links between 1 and 2 are formed via Staudinger ligation, as shown in B. Following gel formation with Ba2+, gels may be further functionalized with MDT-labeled agents, such as MDT-PEG-carboxyfluorescein (3), as illustrated in C (fluorescence image, excited with blue light).
Experimental Section
Materials
Sodium alginate (PRONOVA UP MVG, weight average molecular weight, Mw ≈ 250 kDa, G/M ratio ≥ 1.5) was purchased from NovaMatrix. The 1-ethyl-(dimethylaminopropyl) carbodiimide hydrochloride (EDC) was from Advanced Chemtech. Triethylamine was from Across Organics. Thin layer chromatography (TLC) was performed on Baker-flex Silica Gel IB-F cut into 25×12 mm sheets. The 1× Dulbecco’s phosphate buffered saline (DPBS) without calcium or magnesium at pH 7.4 and 1× Hank’s balanced salt solution (HBSS) with calcium and magnesium at pH 7.3 were from Mediatech, Inc. The silica gel (200–400 mesh, 60 Å) used for filtration, other solvents, and chemical reagents were purchased from Sigma-Aldrich at the highest purity available.
Spectroscopic analysis
Attenuated total reflectance Fourier transform infrared (ATR-FT-IR) spectra were obtained utilizing the PerkinElmer Spectrum 100 FT-IR Spectrometer with the KBr beam splitter, the Universal ATR (1 bounce, Di/ZnSe) Sampling Accessory, and the electronically, temperature-stabilized fast recovery deuterated triglycine sulfate (FR-DTGS) detector. Spectra are the average of 4 scans at a resolution of 4 cm−1 or otherwise stated. UV-Vis spectra were obtained using the Molecular Devices SpectraMax M5 Microplate/Cuvette Reader. Samples for proton nuclear magnetic resonance (1H NMR, Bruker, δ 0.00 and 7.27 ppm for TMS(P) and CHCl3, respectively) spectroscopic analysis and matrix-assisted laser desorption/ionization time-of-flight mass spectrometry (MALDI-TOF-MS, Bruker Bi-Flex IV) were submitted to the University of Miami Chemistry Department. For MALDI-TOF-MS, α-cyano-4-hydroxy-cinnamic acid was used as the matrix and either a mixture of 50 % H2O / 30 % acetone / 20 % acetonitrile or 50 % acetone / 50 % acetonitrile (for the tosylated polymer) was used as the solvent. Samples for electrospray ionization time-of-flight mass spectrometry (ESI-TOF-MS) analysis were submitted to the North Carolina State University Mass Spectrometry Facility. Confocal fluorescent images were taken with a Zeiss LSM510/UV confocal microscope.
Synthesis of H2N-PEG-N3
A solution of Ph3P (1.06 g, 3.98 mmol) in diethyl ether (50 % v/v in ethyl acetate, 9 mL) was slowly (within 1 h) added to a mixture of N3-PEG-N3 (1.50 g, 4.155 mmol, calculated Mw of 619 g/mol, see Supporting Documents for synthesis), diethyl ether (50 % v/v in ethyl acetate, 4.5 mL), and HCl (9 mL, 0.5 M) under Ar-flow and rapid stirring. Stirring continued for 19 h at room temperature (RT, 21–22 °C). The aqueous phase was collected, made basic with addition of NaOH (1.0 mL, 6 M), cooled in ice-water bath for 2 h under Ar bubbling, passed through a 0.45 μm polypropylene filter, and extracted 7 times with 3 mL dichloromethane (DCM). All combined DCM was dried over anhydrous Na2SO4 and passed through a silica gel pad (≈ 70 mg). The DCM was removed under reduced pressure followed by Ar-flushing to yield 1.0 g (64 %) of a colorless, clear oil with weight average molecular weight, Mw of 372 g/mol by ESI-TOF-MS. TLC found a single spot with Rf of 0.59 (8/2/0.01 of DCM/CH3OH/30 % NH3, I2). ATR-FT-IR: 3375 (ν, N-H), 3308 (ν, N-H), 2865 (νs, C-H, PEG), 2101 (νas, N3, 49 % the area of the di-azide PEG), 1599 (δ, N-H), 1097 (νs, C-O, PEG), 722 (δ, N-H), and 698 cm−1. Kaiser test: positive. 1H NMR (300 MHz, CDCl3): δ 2.40 (s, 2H, PEG-NH2), 2.77–2.98 (m, 2H, PEG-CH2-NH2), 3.39 (t, 2H, J=4.7Hz, PEG-CH2-N3), 3.48–3.81 (m, 27H, PEG) ppm. Degree of functionalization by 1H NMR: 46 % for N3 and 53 % for NH2 end groups using area changes of the respective peaks. Purity by 1H NMR: 99 %.
Synthesis of 1, alginate-PEG-N3
The amount of sodium alginate (50 mg), N-hydroxysuccinimide (NHS) (14 mg, 0.12 mmol), and 2-(N-morpholino)ethanesulfonic acid (62 mg, 0.29 mmol) were dissolved in de-ionized water (5 mL). A solution of H2N-PEG-N3 (28 mg, 0.08 mmol in 200 μL H2O) was added. After stirring for 10 min at RT, 1-ethyl-(dimethylaminopropyl)carbodiimide hydrochloride (EDC) (either 56, 116, or 167 mg) was added and stirring continued for an additional 25 min at RT, followed by the addition of NaOH (55 μL of 6 M) and a 10 min incubation. Purification was achieved by 4 days dialysis (10,000 MWCO regenerated cellulose membrane) against 600 mL water, which was changed three times a day. During the first 3 days, NaOH (10 μL of 6 M) and NaCl (400 μL of 4.26 M) were added twice daily to the alginate solution contained inside the dialysis membrane. The purified alginate solution was filtered through a 0.45 μm membrane and lyophilized to yield 1 as a white, foamy, solid material with a yield of 49–56 mg. For initial alginate modification characterization studies, three different EDC amounts (56, 116, and 167 mg of EDC) were tested. Degree of modification refers to the percent of modified carboxylate groups on alginate. For all remaining experiments, alginate-PEG-N3 with 9–12 % azide modification (116 mg of EDC added) was used. ATR-FT-IR (characteristic of all three alginate-PEG-N3): 3279 (ν, O-H), 2878 (νs, C-H, PEG), 2113 (νas, N3), 1658 (ν, C=O, amide 1), 1601 (νas, CO2−), and 1547 (δ, N-H, amide II) cm−1. Kaiser test: negative (characteristic of all three alginate-PEG-N3). 1H NMR (400 MHz, D2O): δ 3.45–3.93 (s-m, 1H, PEG) and 4.67–4.95 (m; 5H or 2H for alginate with 3–5 or 10–13 % modification, respectively). Purity by 1H NMR: > 97 % (characteristic of all three alginate-PEG-N3).
Synthesis of 2, MDT-PEG-MDT
N,N′-Diisopropylcarbodiimide (DIC) (22.52 μL, 0.145 mmol) was added to a solution of 1-methyl-2-diphenylphosphino-terephthalate (MDT) (52.8 mg, 0.145 mmol, see Supporting Documents for synthesis details) and N-hydroxysuccinimide (NHS, 17.2 mg, 0.147 mmol) in 1.2 mL of N,N-dimethylformamide (DMF, anhydrous, degassed with Ar). The solution was kept stirring under Ar flow and the following agents were added at the time intervals indicated: NH2-PEG- NH2 (200 mg, 0.057 mmol, Mw of 3513 g/mol by MALDI-TOF-MS, see Supporting Documents for synthesis details) at 30 min and 4-dimethylaminopyridine (14.8 mg, 0.121 mmol) at 1 h. After 3 h, the product was precipitated with 12 mL cold diethyl ether and collected by centrifugation at 0 °C. It was “crystallized” once in 10 mL 200 proof ethanol by warming to 37 °C until dissolved, cooling in ice-water bath to precipitate, and collecting the precipitate by centrifugation at 0 °C. The precipitate was washed once with 12 mL Et2O at 0 °C and dried under reduced pressure to yield 212 mg (91 %) of 2, a white to light yellow solid powder. Mw of 4057 g/mol by MALDI-TOF-MS. ATR-FT-IR: 2884 (νs, C- H, PEG), 1719, 1659 (ν, C=O, amide 1), 1537 (δ, N-H, amide II), 1102 (νs, C-O, PEG), 747 (MDT), and 698 (MDT) cm−1. Kaiser test: negative. 1H NMR (400 MHz, CDCl3): δ 3.45–3.84 (m, 393H, PEG and MDT), 6.80 (s, 2H), 7.28–7.38 (m, 22H, MDT), 7.80–7.82 (dt, 2H, J=2.0 and 8.2Hz, MDT), and 8.06– 8.09 (m, 2H, MDT) ppm. Degree of modification by 1H NMR: 97 % using the area change of the PEG- CH2-NH2 peak. Purity by 1H NMR: 99 %.
Synthesis of 1-methyl-2-diphenylphosphino-terephthalate N-hydroxysuccinimide ester (MDT-NHS)
A solution of 38 mg (0.104 mmol) 1-methyl-2-diphenylphosphino-terephthalate (MDT, see Supporting Documents for synthesis), NHS (12.9 mg, 0.110 mmol), EDC (21.5 mg, 0.111 mmol), and 0.4 mL DMF (anhydrous, degassed with Ar) was stirred for 3 h at RT (21–22 °C) under Ar flow and kept in the dark. The solution was cooled using an ice-water bath and 5 mL of cold water was added with vortex to precipitate the product, which was collected by centrifugation (3500 rpm, 0 °C, 3 min). The precipitate was washed once more with 5 mL cold water as above and freeze-dried to yield 41.5 mg (86 %) of a light yellow solid powder with Mw of 461.10 g/mol by ESI-TOF-MS. ATR-FT-IR: 3070, 3053, 2952 (MDT), 1804, 1768, 1739 (NHS ester), 1720 (MDT ester), 1434, 1276, 1209, 1075, 744, 734, and 695 (MDT) cm−1. 1H NMR (400 MHz, CDCl3 + 0.03 % v/v TMS): δ 2.86 (s, 4H), 3.76 (s, 3H), 7.25–7.38 (m, 11H), 7.66–7.67 (dt, 1H, J=1.0 and 3.3Hz), and 8.14 (t, 2H, J=1.0Hz). Purity by 1H NMR: 95 %.
Synthesis of 3, MDT-PEG-carboxyfluorescein
Synthesis consisted of two steps. First, NH2-PEG- NH2 (200 mg, 0.057 mmol, Mw of 3513 g/mol by MALDI-TOF-MS, see Supporting Documents for synthesis details) was dissolved in 0.5 mL DMF (anhydrous, degassed with Ar). To this solution, 5(6)-carboxyfluorescein N-hydroxysuccinimide ester (29 mg, 0.058 mmol) in 0.5 mL DMF (anhydrous, degassed with Ar) was added at a rate of about 17 μL /min. This was followed by the addition (11 μL /min) of triethylamine (16 μL, 0.115 mmol) in 0.2 mL DMF (anhydrous, degassed with Ar). The solution was shaken for 3 h at room temperature (21–22 °C) under Ar and kept in the dark. The product was precipitated with 10 mL cold Et2O and collected by centrifugation (3500 rpm, 0 °C, and 5 min). It was “crystallized” in 8 mL 200 proof ethanol by dissolving it at 37 °C, cooling in ice-water bath to precipitate, and collecting the precipitate by centrifugation (3500 rpm, 0 °C, and 5 min). The product was rinsed with 10 mL cold Et2O and dried under reduced pressure. It was then dissolved in 1.4 mL water, passed through an 8 mL column of SP Sephadex C-25 using water as solvent, and freeze-dried. This last procedure was repeated using an 8 mL column of QAE Sephadex A-25. After freeze-drying, it was dissolved in 3 mL anhydrous dichloromethane, passed through a 0.45 μm polypropylene syringe filter, precipitated with 20 mL cold Et2O, collected by centrifugation as above, and dried under reduced pressure to yield 90 mg (40 %) of an orange, solid powder. Calculated Mw: 3893 g/mol. ATR-FT-IR: 2884 (νs, C-H, PEG), 1656 (ν, C=O, amide I), 1611 (carboxyfluorescein), 1548 (δ, N-H, amide II) and 1099 (νs, C-O, PEG) cm−1. Kaiser test: positive.
Second, 70 mg (0.018 mmol) of the above product was mixed with MDT-NHS (9.0 mg, 0.020 mmol) and dissolved in 280 μL DMF (anhydrous, degassed with Ar). After shaking for about 1 min, triethylamine (10.4 μL, 0.075 mmol) was added. The solution was shaken 2 h at RT (21–22 °C) under Ar and kept in the dark. The product was precipitated with 5 mL of cold Et2O and collected by centrifugation (3500 rpm, 0 °C, and 5 min). It was “crystallized” once in 5 mL ethanol (200 proof) by dissolving at 37 °C, cooling in ice-water bath to precipitate, and collecting precipitate by centrifugation (3500 rpm, 0 °C, and 5 min). The precipitate was rinsed with 5 mL cold Et2O and dried under reduced pressure. Following dissolution in 1 mL water, it was passed through a 3 mL column of SP Sephadex C-25 using water as solvent and freeze-dried. Then, it was dissolved in 5 mL ethanol (200 proof) at 37 °C, passed through a 0.45 μm polypropylene syringe filter, precipitated by cooling in ice-water bath, and collected by centrifugation (3500 rpm, 0 °C, and 5 min). The precipitate was rinsed with 5 mL cold Et2O and dried under reduced pressure to yield 63 mg (82 %) of 3, an orange solid powder. Mw of 3982 g/mol by MALDI-TOF-MS. ATR-FT-IR: 2885 (νs, C-H, PEG), 1758, 1721, 1656 (ν, C=O, amide I), 1613 (carboxyfluorescein), 1548 (δ, N-H, amide II), 1099 (νs, C-O, PEG), 750 (MDT), and 699 (MDT) cm−1. Kaiser test: negative. 1H NMR (400 MHz, CDCl3): δ 3.47–3.83 (m, 331H, PEG and MDT), 6.53 (t, 2H, J=8.1Hz), 6.71 (s, 2H), and 7.27–8.62 (m, 20H, MDT and CF) ppm. Degree of functionalization by 1H NMR: 100 % (the PEG-CH2-NH2 peak disappeared). Purity by 1H NMR: 99 % (without the water peak).
Quantification of azide modification of alginate by 1H NMR
First, a calibration curve was plotted consisting of the relative 1H NMR peak area between 0.04 wt% sodium salt of 3- (trimethylsilyl)propionic-2,2,3,3-d4 acid (TMSP, δ at 0.00 ppm) and the N3 on H2N-PEG-N3 (varied from 0.4 to 6.0 mM range, δ at 3.48–3.83 ppm). All analyzed samples in the calibration curves contained 0.8 % wt/v of untreated alginate. The basic pH of the stock H2N-PEG-N3 solution was neutralized with HCl before being used to prepare the samples for the calibration curve. The degree of functionalization of fabricated alginate-PEG-N3 polymers were quantified by correlating the relative 1H NMR peak area between 0.04 wt% TMSP and the N3 on the alginate-PEG-N3 solutions (0.8 % wt/v) to the calibration curve described above. All samples were prepared in D2O solvent containing 0.04 wt % of TMSP in 5 mm NMR tubes and analyzed with a Bruker 400 MHz NMR. Spectral processing (Fourier Transform and integration of peaks) was performed using the MestRe-C 2.3 software. Data points are average of 2 independent samples. Degree of modification refers to the number of modified carboxylate groups on alginate, which has a calculated total of 1428 carboxylate groups.
Quantification of azide modification of alginate by FT-IR
First, a calibration curve was plotted consisting of the area of the N3 IR band as a function of H2N-PEG-N3 concentration (from 1 to 8 mM range). All the samples in the calibration curves had 1 % wt/v of untreated alginate. The basic pH of the stock H2N-PEG-N3 solution was neutralized with HCl before being used to prepare the samples for the calibration curve. The degree of functionalization of fabricated alginate-PEG-N3 polymers was determined by correlating the area of the N3 IR band obtained from the alginate-PEG-N3 solutions (1 % wt/v) with that on the calibration curve. All samples were prepared in DPBS buffer. Quantitative transmission FT-IR measurements were recorded using a sealed ZnSe flow cell with b of 0.1 mm. After each sample (≈ 80 μL) was read, the cell was cleaned using pure water and dried with ethanol and Ar flow. Scan range was from 2500 to 1800 cm−1 at a 4 cm−1 resolution. Centrifugation was used to remove air bubbles from the sample solutions. Spectral processing (including baseline correction, smoothing, and band area determination) was performed by Spectrum Software V.6.2.0. Data points are average of 4 samples.
Quantification of Staudinger ligation efficiency
A 1 % wt/v solution of alginate-PEG-N3 (9–12 % modification, 5.6 mM of N3) was reacted with equimolar amounts (with respect to N3) of compound 3 (5.6 mM of MDT) in DPBS. The reactivity between the azide and MDT groups on the respective materials was monitored by correlating the area of the N3 IR band as a function of reaction time at 37 °C. Transmission FT-IR measurements were collected and processed as described above. The number of scans varied from 50–200 or until reaching the same straight baseline for comparison with other spectra. Reaction solution was vortexed frequently during incubation, except for a fresh solution incubated overnight that was used to collect the 15 and 21 h samples.
Hydrogel formation
Three cross-linking approaches were investigated: 1) ionic, 2) covalent, and 3) ionic and covalent. 1) For ionic cross-linking, a 1.2–1.5 % wt/v solution of either alginate or 1 was dropped into gelation solutions of either Ca2+ (100mM) or Ba2+ (50 mM) in 10 mM 3-(N-morpholino) propanesulfonic acid (MOPS) buffer (pH 7.2, with 0.22 μL/mL of Tween 20, 2.7 mM KCl, 12–62 mM NaCl). A parallel air and solution flow droplet generator was used to prepare beads of uniform size (d ≈ 1.2 mm), which was determined by the flow rate of air and solution. For the larger (d ≈ 2.6 mm) beads, about 10–15 μL of the alginate-containing solution was simply dropped (at a reasonable distance from the air/water interface) into the gelation solution manually via a micropipette. Beads formed instantly and were incubated in the gelation solution for at least 20 min. 2) For covalent cross-linking, a 1.2–1.5 % wt/v solution of compound 1 containing 0.8–4.1 % wt/v of compound 2 in DPBS were incubated at 37 oC for 6 hrs and then overnight (17 h) at room temperature. The gel size and shape was determined by that of the container holding the solution. 3) For combination of ionic and covalent cross-linking, a 1.5 % wt/v solution of alginate-PEG-N3 in MOPS with or without 2.2 % wt/v of cross-linker 2 was pre-incubated 80 min at 37 °C to initiate the covalent cross-linking process. An increase in solution viscosity was observed. Ten to fifteen microliters of the viscous solution was then dropped into a 50 mM Ba2+ in 10 mM 3-(N-morpholino) propanesulfonic acid (MOPS) buffer (pH 7.2, with 0.22 μL/mL of Tween 20, 2.7 mM KCl, 12–62 mM NaCl) solution and incubated for 20 min. This was followed by rinsing three times in MOPS and overnight incubation (17 h, RT). To remove bound Ba2+, beads were rinsed three times for 30 min in 50 mM EDTA followed by rinsing three times and 2 h equilibration period in MOPS buffer.
Assessment of degree of swelling and gel yield
The degree of swelling (DS) of the above covalently cross-linked hydrogels (100 μL/gel, 1.2 % wt/v of 1, and 0.8–4.1 % wt/v of 2) was calculated from the weight difference between the dried and swollen samples using the following equation:
| (1) |
where WS and WD were the weight of the swollen and dried samples, respectively. WS was assessed by incubating the tested hydrogel in DPBS (4 × 30 min) and in distilled water (4 × 30 min) followed by gentle removal of surface excess water with Kimwipes and weighing. WD samples were collected by air drying for 5 days the gels (after being equilibrated in water) and weighing. Gel yield of the resulting hydrogels was calculated from the weight difference between WD and the total of 1 and 2 polymers in the solution before gelation and equilibration using the following equation:
| (2) |
Results and Discussion
Optimization and quantification of azide conjugation to alginate
Functionalization of alginate carboxylate groups was achieved via carbodiimide chemistry according to the scheme shown in Figure 2. Azide conjugation was achieved via amide bonding of amino PEG azide, with a residue molecular weight (Mr) of 285–315 (product specification) (Mw of 311 g/mol by ESI-TOF-MS), to the alginate backbone. For the selective monoreduction of the di-azide PEG into H2N-PEG-N3, a biphasic solvent mixture of acidic water and organic phase was utilized to extract the product as it form into the aqueous phase minimizing further reaction.35 The carboxylate groups of alginate and the H2N-PEG-N3 polymer were reacted in situ by 1-ethyl-(dimethylaminopropyl) carbodiimide hydrochloride (EDC) and N-hydroxysuccinimide (NHS) in aqueous solution. The resulting product was purified by dialysis. Enhanced efficiency, purity, and aqueous solubility/viscosity of the final product was aided by several additions of NaCl(aq.) and NaOH(aq.). For filter-sterilization, the viscosity of alginate-PEG-N3 concentrated (≈ 1–3 %, wt/v) solutions could be decreased by subsequently adding NaOH to pH ≥ 10 and re-adjusting it back to the original/buffer pH with HCl.
Figure 2.

Functionalization reaction between H2N-PEG-N3 and alginate via amide bonding, resulting in polymer 1.
The resulting alginate-PEG-N3 polymer, 1, was characterized by 1H NMR and FT-IR spectroscopy. NMR revealed the characteristic proton peaks for alginate and PEG as illustrated in Figure 3A. Similarly, the IR shoulder-like bands centered at 1653 and 1546 cm−1 confirm the amide bond formation, in addition to the characteristic IR bands of azide (2112 cm−1) and PEG (2877 cm−1), Figure 3B.
Figure 3.

(A) 1H NMR in D2O with 0.04 wt% TMSP and (B) ATR-FT-IR spectra of the 9–12 % modified alginate-PEG-N3. The top dashed line in the IR spectrum corresponds to untreated alginate.
Both 1H NMR and FT-IR spectroscopy were used to characterize the degree of azide functionalization on alginate. Results are summarized on Table 1 and are based on respective calibration curves with R2 ≥ 0.99 for linearity (see Experimental Methods and Supporting Information). Figure 4 shows the extrapolated values from the calibration curves, corresponding to the three different EDC amounts used to fabricate the alginate-PEG-N3 polymers. Collectively, the degree of functionalization varied (from 3 to 13 %) as a function of EDC reagent concentration (from 56 to 167 mg, respectively). No statistical difference in the calculated degree of azide functionalization on alginate was found between EDC amounts of 116 and 167 mg. Therefore, in order to minimize possible EDC-related side reactions and maintain the highest degree of polymer functionalization, all remaining experiments used the 9–12 % modified alginate-PEG-N3 (made using 116 mg of EDC).
Table 1.
Average calculated degree of modification and molecular weights of alginate-PEG-N3 prepared with different amounts of EDC.
| Alginate-PEG-N3 | ||||||
|---|---|---|---|---|---|---|
| EDC, mg | 56 | 116 | 167 | |||
| Characterization method | 1H NMR | FT-IR | 1H NMR | FT-IR | 1H NMR | FT-IR |
| N3/alginate mol ratio | 44 | 64 | 128 | 170 | 172 | 189 |
| Degree of modification | 3 % | 5 % | 9 % | 12 % | 12 % | 13 % |
| Mw, g/mol | 263,566 | 269,995 | 289,747 | 302,796 | 303,373 | 308,755 |
Figure 4.
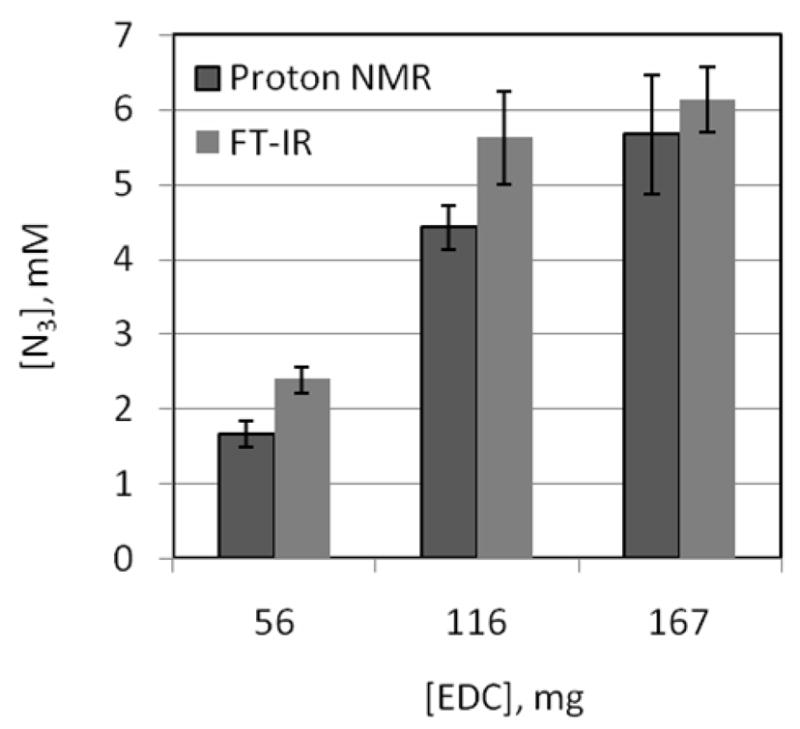
Extrapolated [N3] in 1 % wt/v solutions of the functionalized alginates as a function of [EDC] from the 1H NMR (n of 2, D2O as solvent) and FT-IR (n of 4, DPBS as solvent) calibration curves. The error bars are the respective ± standard deviations.
During the FT-IR measurements, it was noted that the buffer/cell blank blocked up to 99.5 % of the incident IR radiation; however, there was a strong linear correlation between the area of the N3 band (determined from 2187 to 2075 cm−1) and its concentration. Also, the IR spectral baseline of the samples drifted with the number of scans. Therefore, the number of scans varied from 10 to 110 in order to obtain and compare spectra having the same straight baselines. Acquiring background spectrum (cell with solvent only, no sample) also changed the number of scans required to collect sample spectra with straight baselines.
Efficiency of the Staudinger ligation
To evaluate the efficiency of the Staudinger ligation, the reaction between MDT and azide groups, immobilized to different polymers, was monitored using quantitative FT-IR spectroscopy. For this study, reactivity between compounds 1 and 3 was evaluated. Polymer 3 was selected because its single MDT group will not cross-link alginate azides solutions into hydrogels, thereby allowing for ease in FT-IR analysis. A 1.0 % wt/v solution of 1 (at 9–12 % azide modification) has a calculated maximum concentration of N3 groups of 5.6 mM. This solution was mixed with 5.6 mM of 3 and incubated at 37 °C between FT-IR readings. Figure 5 illustrates the reactivity of 1 and 3 over the course of 21 h. Up to 40 % of the azide groups on 1 reacted with MDT groups on 3 with respect to the control group (no 3 added). The reaction was complete after 6 h, with no statistical (two-tail paired T-test, P ≤ 0.05) change in N3 band area detected past this time point, indicating reaction completion. In the absence of polymer 3, N3 groups remained unchanged even after 21 h incubation. This illustrates the stability of the azide groups under the experimental conditions.
Figure 5.

Percent FT-IR area change of the azide groups over time at 37 °C in DPBS. The top dashed line represents 1 % wt/v alginate-PEG-N3 (control). The bottom solid line represents 1 % wt/v alginate-PEG-N3 (prepared with 116 mg of EDC) reacting with 5.6 mM carboxyfluorescein-PEG-MDT. The error bars are the ± standard deviation from the average with n of 3.
The efficiency and kinetics of the Staudinger ligation reaction can be influenced by the structure and electronic properties of the group bearing the azide functionality, as well as other factors (e.g. reaction temperature, concentration, solvent polarity, competing oxidation of the phosphine, and ionic detergents in solution).36 In addition, high molecular weight alginates increase the viscosity of its aqueous solutions, which may further slow the reaction rate of the Staudinger ligation. All this collectively may explain the incomplete reactivity observed between 1 and 3.
The Cu(I)-catalyzed and strain-promoted azide-alkyne cycloaddition (click chemistry) reactions are faster alternatives to the Staudinger ligation, in particular, the recently reported and non-toxic copper-free click chemistry.37 Hyaluronic acid sodium salt,38 PEG,39 and poly(vinyl alcohols)40 are some examples of polymeric materials that have been cross-linked into hydrogels via the copper-catalyzed click chemistry. Because of the copper-related toxicity, this gel formation approach may not be compatible with living cells or organisms. In the other hand, the copper-free click chemistry have been recently used to efficiently cross-link cells for cellular encapsulation in addition to orthogonal 3D functionalization via thiol-ene photocoupling chemistry.41 Although the Staudinger ligation may exhibit decreased stability and reactivity when compared to click chemistry schemes, it has proven to be highly biocompatible and efficient for surface labeling of live cells (e.g. pancreatic islets, which is of particular interest in this work).32,37
Evaluation of hydrogel formation via Staudinger ligation
For this study, compound 2 (MDT- PEG-MDT), consisting of PEG (Mw 3400 g/mol by MALDI-MS) having MDT as end groups linked via amide bonding as shown in Figure 6, was prepared. Co-incubation (up to 24 h, 37 °C) of the alginate- PEG-N3 (1) and 2 resulted initially into a cloudy mixture followed by hydrogel formation. The final cross-linked and buffer-equilibrated hydrogels were clear. Without mild agitation during formation, air bubbles would form within the gels. Hydrogels of 1 and 2 could be fabricated in buffered saline or in the presence of other proteins with no observable effect on gel formation, due to the specificity of the ligation scheme. The physical characteristics of the resulting gels were dependent on the degree of functionalization of 1 and on the concentration of polymer 2. Observationally, azide functionalized alginates with the lowest degree of modification (3–5 %) resulted in hydrogels of limited mechanical integrity, regardless of the concentration of polymer 2. At azide functionalization levels of 9–13 % on the alginate polymer, resulting gels varied in integrity from mechanically weak to strong gels, depending on the MDT/N3 group ratio. At MDT/N3 ratios exceeding 1.0, resulting gels retained their mold shape and were mechanically stable, permitting movement without imparting structural defects.
Figure 6.

Synthetic approaches for the fabrication of 2 and 3.
To quantify the effect of MDT/N3 ratio on the resulting hydrogel characteristics, gel yield and swelling measurements were made following a 17 h incubation of 1.2 % (wt/v) 1 and varying concentrations of 2, which resulted in variations in the mol ratios between the MDT and azide groups. As shown in Figure 7A, increases in the MDT/N3 ratio resulted in significant decreases in the degree of swelling (DS), (two-tail paired T-test, P ≤ 0.05). The greatest change in DS occurred from 1.5 to 2.0, where a 29 % decrease in DS was observed. At molar ratios exceeding 2.0, DS values stabilized to a range between 150 and 135. Figure 7B illustrates the relationship between gel yield and MDT/N3 ratio following co-incubation of 1 (9–12 % azide modified) and varying concentrations of 2. No statistical difference in gel yield was observed between MDT/N3 ratios of 0.5 and 2.0, although a general downward trend is observed. At MDT/N3 ratios exceeding 2.0, hydrogels still formed, but with gel yield significantly decreased. It is suspected that this loss is due to two factors: saturation of the azide groups with polymer 2, resulting in loss of 2 following hydrogel formation; and phase separation between the polymers, observed at MDT/N3 ratios exceeding 1.5, where two layers formed after mild centrifugation.
Figure 7.

(A) Degree of swelling and (B) gel yield of MDT-PEG-MDT cross-linked alginate-PEG-N3 (prepared with 116 mg of EDC) as a function of MDT/N3 mol ratio. Error bars ± standard deviation from the average with n of 3.
Hydrogel formation via ionic interactions
Gel beads with diameter of about 2.6 mm were prepared using polymer 1 and unmodified alginate via divalent ion cross-linking. Two hydrogel groups were fabricated 1) ionically (Ca2+ or Ba2+) cross-linked alginate and 2) ionically (Ca2+ or Ba2+) cross-linked alginate-PEG-N3. In comparison of the two groups, the azide-functionalization reaction did not affect the capacity of the polymer to gel in the presence of either Ca2+ or Ba2+ cations. Ca2+ cross-linked azide-functionalized alginate beads, however, dissolved within 2 h at room temperature upon incubation with Ca2+-free DPBS, while standard Ca2+ cross-linked alginate beads did not dissolve until after > 20 h of incubation in Ca2+-free DPBS. These results indicate that azide-functionalization of alginate resulted in decreased interactions of alginate with the calcium ions. On the other hand, Ba2+ cross-linked alginate and azide-functionalized alginate beads remained stable for weeks or more when incubated in DPBS without Ba2+ or Ca2+ ions.
Hydrogel formation via both ionic and covalent interactions
Ionically and covalently cross-linked gel beads with diameter of about 2.6 mm were prepared using polymer mixtures of 1 and 2, as outlined above in the Experimental section. Beads containing both ionic (Ba2+) and covalent cross-linking bonding remained stable even after removing the Ba2+ with EDTA chelating solution. This illustrates the capacity of these gels to undergo additional covalent cross-linking following ionic gel formation. The diameter of the beads, however, increased by 15.8 ±1.4 %.
Functionalization of azide alginate hydrogels
Knowing that alginate azide has the capacity for ionic cross-linking, the pendant azide groups on these gels could serve functionalization purposes in addition to covalent stabilization via Staudinger ligation or other N3 bioorthogonal reaction. For example, polymer 3 (shown in Figure 6) was used to label Ba2+ cross-linked azide-functionalized alginate beads (d ≈ 1.2 mm) with 5(6)-carboxyfluorescein (CF). Following a 45 min incubation step in 0.5 mM of compound 3 at 37 °C, only alginate gels presenting the azide groups (polymer 1) reacted with MDT-PEG-CF and became highly fluorescent, as shown in Figure 8. Since the Mw of 3 is 3982 g/mol, the polymer should easily diffuse throughout the alginate bead. As illustrated in Figure 8B, cross-sectional confocal imaging revealed that the fluorescently labeled phosphine bound to azide groups throughout the whole bead. By demonstrating the capacity of ionically-linked azide-functionalized alginate to serve as platforms for the binding of phosphine-conjugated agents, these experiments illustrate the capacity to functionalize alginate for numerous potential applications.
Figure 8.
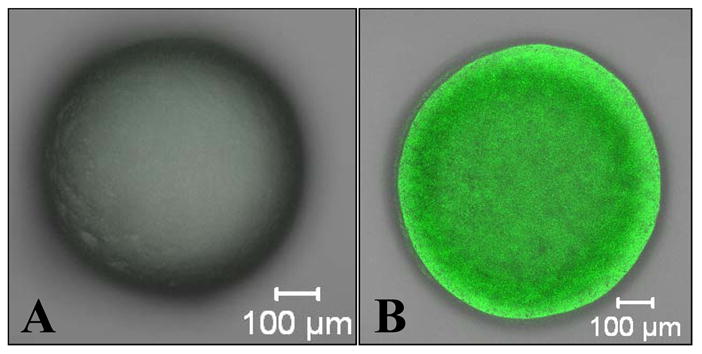
Confocal fluorescent images (multi-slice projection) of (A) alginate and (B) alginate-PEG-N3 (1) Ba2+ cross-linked beads after being exposed to CF-PEG-MDT (3) for 45 min and rinsed 3 times with buffered saline for 30 min each.
Conclusions
By functionalizing alginate with multiple azide groups via stable amide bonding and PEG linkers, bio-orthogonal Staudinger ligation was successfully used to form covalently linked hydrogels of variable characteristics, such as swelling and mechanical stability. Furthermore, the capacity of the azide-functionalized alginate to serve as a platform for the covalent conjugation of various phosphine-conjugated agents illustrates the potential of this polymer to be used for the conjugation of numerous agents, such as extra-cellular matrix proteins for enhanced cellular encapsulation, labeling agents for in vivo monitoring, and agents for biosensing. Given the chemo-selectivity and non-toxic nature of the Staudinger ligation scheme, the use of these polymers for the encapsulation of cells has tremendous potential. Future studies will evaluate the encapsulation of cells within these polymers and assess their promising in developing a stable, hydrogel for in vivo applications.
Supplementary Material
Acknowledgments
This work was supported by the – Diabetes Research Institute Foundation (www.diabetesresearch.org), Department of Defense Somatic Cell Processing Facility at the DRI (N00244-07-C-1529), the National Institutes of Health through the Type 1 Diabetes Pathfinder Award Program (1DP2 DK08309601), and the Juvenile Diabetes Research Center for Islet Transplantation at the University of Miami Diabetes Research Institute (4-2004-361).
Footnotes
Supporting Information Available. Detailed methods for polymer synthesis (where specified), characterization data, 1H NMR spectra, and calibration curves are outlined. This material is available free of charge via the Internet at http://pub.acs.org.
References
- 1.Orive G, Carcaboso AM, Hernández RM, Gascón AR, Pedraz JL. Biomacromolecules. 2005;6:927–931. doi: 10.1021/bm049380x. [DOI] [PubMed] [Google Scholar]
- 2.Smidsrød O, Skjåk-Bræk G. Trends Biotechnol. 1990;8:71–78. doi: 10.1016/0167-7799(90)90139-o. [DOI] [PubMed] [Google Scholar]
- 3.Skjåk-Bræk G, Grasdalen H, Smidsrød O. Carbohyd Polym. 1989;10:31–54. [Google Scholar]
- 4.Braccini I, Pérez S. Biomacromolecules. 2001;2:1089–1096. doi: 10.1021/bm010008g. [DOI] [PubMed] [Google Scholar]
- 5.Lum ZP, Tai IT, Krestow M, Norton J, Vacek I, Sun AM. Diabetes. 1991;40:1511–1516. doi: 10.2337/diab.40.11.1511. [DOI] [PubMed] [Google Scholar]
- 6.Sun AM. Method Enzymol. 1988;137:575–580. doi: 10.1016/0076-6879(88)37053-9. [DOI] [PubMed] [Google Scholar]
- 7.Shapiro L, Cohen S. Biomaterials. 1997;18:583–590. doi: 10.1016/s0142-9612(96)00181-0. [DOI] [PubMed] [Google Scholar]
- 8.Liu M, Yue X, Dai Z, Xing L, Ma F, Ren N. Langmuir. 2007;23:9378–9385. doi: 10.1021/la7002996. [DOI] [PubMed] [Google Scholar]
- 9.Abu-Rabeah K, Polyak B, Ionescu RE, Cosnier S, Marks RS. Biomacromolecules. 2005;6:3313–3318. doi: 10.1021/bm050339j. [DOI] [PubMed] [Google Scholar]
- 10.Sultzbaugh KJ, Speaker TJ. J Microencapsul. 1996;13:363–376. doi: 10.3109/02652049609026023. [DOI] [PubMed] [Google Scholar]
- 11.Polyak B, Geresh S, Marks RS. Biomacromolecules. 2004;5:389–396. doi: 10.1021/bm034454a. [DOI] [PubMed] [Google Scholar]
- 12.Rowley JA, Madlambayan G, Mooney DJ. Biomaterials. 1999;20:45–53. doi: 10.1016/s0142-9612(98)00107-0. [DOI] [PubMed] [Google Scholar]
- 13.Thu B, Bruheim P, Espevik T, Smidsrød O, Soon-Shiong P, Skjåk-Bræk G. Biomaterials. 1996;17:1069–1079. doi: 10.1016/0142-9612(96)85907-2. [DOI] [PubMed] [Google Scholar]
- 14.Benson JP, Papas KK, Constantinidis I, Sambanis A. Cell Transplant. 1997;6:395–402. doi: 10.1177/096368979700600406. [DOI] [PubMed] [Google Scholar]
- 15.Weber C, Ayres-Price J, Costanzo M, Becker A, Stall A. Transplant P. 1994;26:1116–1119. [PubMed] [Google Scholar]
- 16.Strand BL, Ryan TL, In’t Veld P, Kulseng B, Rokstad AM, Skjak-Brek G, Espevik T. Cell Transplant. 2001;10:263–275. [PubMed] [Google Scholar]
- 17.Dusseault J, Leblond FA, Robitaille R, Jourdan G, Tessier J, Ménard M, Henley N, Hallé JP. Biomaterials. 2005;26:1515–1522. doi: 10.1016/j.biomaterials.2004.05.013. [DOI] [PubMed] [Google Scholar]
- 18.Lu MZ, Lan HL, Wang FF, Chang SJ, Wang YJ. Biotechnol Bioeng. 2000;70:479–483. doi: 10.1002/1097-0290(20001205)70:5<479::aid-bit1>3.0.co;2-e. [DOI] [PubMed] [Google Scholar]
- 19.Desai NP, Sojomihardjo A, Yao Z, Ron N, Soon-Shiong P. J Microencapsul. 2000;17:677–690. doi: 10.1080/02652040050161675. [DOI] [PubMed] [Google Scholar]
- 20.Rokstad AM, Donati I, Borgogna M, Oberholzer J, Strand BL, Espevik T, Skjåk-Bræk G. Biomaterials. 2006;27:4726–4737. doi: 10.1016/j.biomaterials.2006.05.011. [DOI] [PubMed] [Google Scholar]
- 21.Chen H, Ouyang W, Jones M, Metz T, Martoni C, Haque T, Cohen R, Lawuyi B, Prakash S. Cell Biochem Biophys. 2007;47:159–168. doi: 10.1385/cbb:47:1:159. [DOI] [PubMed] [Google Scholar]
- 22.Breguet V, Gugerli R, Pernetti M, von Stockar U, Marison IW. Langmuir. 2005;21:9764–9772. doi: 10.1021/la0512796. [DOI] [PubMed] [Google Scholar]
- 23.Wang MS, Childs RF, Chang PL. J Biomater Sci Polym Ed. 2005;16:91–113. doi: 10.1163/1568562052843302. [DOI] [PubMed] [Google Scholar]
- 24.Cruise GM, Hegre OD, Lamberti FV, Hager SR, Hill R, Scharp DS, Hubbell JA. Cell Transplant. 1999;8:293–306. doi: 10.1177/096368979900800310. [DOI] [PubMed] [Google Scholar]
- 25.Cruise GM, Hegre OD, Scharp DS, Hubbell JA. Biotechnol Bioeng. 1998;57:655–665. doi: 10.1002/(sici)1097-0290(19980320)57:6<655::aid-bit3>3.0.co;2-k. [DOI] [PubMed] [Google Scholar]
- 26.Williams CG, Malik AN, Kim TK, Manson PN, Elisseeff JH. Biomaterials. 2005;26:1211–1218. doi: 10.1016/j.biomaterials.2004.04.024. [DOI] [PubMed] [Google Scholar]
- 27.Hu X, Gao C. J Appl Polym Sci. 2008;110:1059–1067. [Google Scholar]
- 28.Cosnier S, Novoa A, Mousty C, Marks RS. Anal Chim Acta. 2002;453:71–79. [Google Scholar]
- 29.Kiick KL, Saxon E, Tirrell DA, Bertozzi CR. Proc Natl Acad Sci USA. 2002;99:19–24. doi: 10.1073/pnas.012583299. [DOI] [PMC free article] [PubMed] [Google Scholar]
- 30.Prescher JA, Dube DH, Bertozzi CR. Nature. 2004;430:873–877. doi: 10.1038/nature02791. [DOI] [PubMed] [Google Scholar]
- 31.Lemieux GA, de Graffenried CL, Bertozzi CR. J Am Chem Soc. 2003;125:4708–4709. doi: 10.1021/ja029013y. [DOI] [PubMed] [Google Scholar]
- 32.Stabler CL, Sun X-L, Cui W, Wilson JT, Haller CA, Chaikof EL. Bioconjugate Chem. 2007;18:1713–1715. doi: 10.1021/bc7002814. [DOI] [PubMed] [Google Scholar]
- 33.Saxon E, Bertozzi CR. Science. 2000;287:2007–2010. doi: 10.1126/science.287.5460.2007. [DOI] [PubMed] [Google Scholar]
- 34.Hangauer MJ, Bertozzi CR. Angew Chem Int Ed. 2008;47:2394–2397. doi: 10.1002/anie.200704847. [DOI] [PMC free article] [PubMed] [Google Scholar]
- 35.Schwabacher AW, Lane JW, Schiesher MW, Leigh KM, Johnson CW. J Org Chem. 1998;63:1727–1729. [Google Scholar]
- 36.Agard NJ, Baskin JM, Prescher JA, Lo A, Bertozzi CR. ACS Chem Biol. 2006;1:644–648. doi: 10.1021/cb6003228. [DOI] [PubMed] [Google Scholar]
- 37.Baskin JM, Prescher JA, Laughlin ST, Agard NJ, Chang PV, Miller IA, Lo A, Codelli JA, Bertozzi CR. Proc Natl Acad Sci USA. 2007;104:16793–16797. doi: 10.1073/pnas.0707090104. [DOI] [PMC free article] [PubMed] [Google Scholar]
- 38.Crescenzi V, Cornelio L, Di Meo C, Nardecchia S, Lamanna R. Biomacromolecules. 2007;8:1844–1850. doi: 10.1021/bm0700800. [DOI] [PubMed] [Google Scholar]
- 39.Malkoch M, Vestberg R, Gupta N, Mespouille L, Dubois P, Mason AF, Hedrick JL, Liao Q, Frank CW, Kingsbury K, Hawker CJ. Chem Commun. 2006;26:2774–2776. doi: 10.1039/b603438a. [DOI] [PubMed] [Google Scholar]
- 40.Ossipov DA, Hilborn J. Macromolecules. 2006;39:1709–1718. [Google Scholar]
- 41.DeForest CA, Polizzotti BD, Anseth KS. Nat Mater. 2009;8:659–664. doi: 10.1038/nmat2473. [DOI] [PMC free article] [PubMed] [Google Scholar]
Associated Data
This section collects any data citations, data availability statements, or supplementary materials included in this article.