

Abstract
Two-dimensional thin films consisting of homopolymer and discrete compositional blends of tyrosine-derived polycarbonates were prepared and characterized in an effort to elucidate the nature of different cell responses that were measured in vitro. The structurally similar blends were found to phase separate after annealing with domain sizes dependent on the overall composition. The thin polymer films were characterized with the use of atomic force microscopy (AFM), water contact angles, and time-of-flight secondary ion mass spectrometry (TOF-SIMS) and significant changes in roughness were measured following the annealing process. Genetic expression profiles of interleukin-1β and fibronectin in MC3T3-E1 osteoblasts and RAW 264.7 murine macrophages were measured at several time points, demonstrating the time and composition-dependent nature of the cell responses. Real-time reverse transcriptase polymerase chain reaction (RT-PCR) depicted upregulation of the fibronectin gene copy numbers in each of the blends relative to the homopolymers. Moreover, the interleukin-1β expression profile was found to be compositionally dependent. The data suggest strongly that optimal composition and processing conditions can significantly affect the acute inflammatory and extracellular matrix production responses.
Keywords: biomaterials, fibronectin, tyrosine-derived polycarbonate, phase separation, real-time reverse transcriptase polymerase chain reaction (RT-PCR), interleukin-1β
Introduction
New combinatorial approaches to material synthesis and characterization are affording opportunities to address complex biological hypotheses. These methods include cell–biomaterial interactions and cover large variants in the physicochemical parameter space simultaneously.1–9 Surface characteristics such as hydrophobicity, morphology, surface charge, and chemical functionality each play key roles in governing cell adhesion and proliferation.10 In addition, when mixing two or more individual materials, there are often instances where the new material shows a synergistic “improvement” in one or more of the properties of the material relative to the respective homopolymers. However, the optimization of polymer mixtures is a complicated process. Screening all combinations of materials and processing conditions by traditional methods for the purposes of optimization is impractical. Additional variables, not withstanding new chemical and processing methodologies, continually increase the physical parameter space, making gradient sample fabrication methods very attractive. Orthogonal gradient methods1,4,5,11,12 developed in the NIST Combinatorial Materials Center (NCMC) produce well-defined materials that afford simultaneous coverage of multidimensional chemical, composition, and physical-property parameter space, and are finding application in the rapid evaluation of biological hypotheses, including biocompatibility.
The in vivo model for determining the biocompatibility of a material is quite complex and involves the recruitment and interaction of several different cell types, making specific interactions difficult to identify. Therefore in vitro analysis methods that provide early indications of biocompatibility potential would be extremely advantageous. Thus, two of several cell types that are likely to co-exist at the site of implantation, namely, macrophages (RAW 264.7) and osteoblasts (MC3T3-E1, subclone 4) were chosen for study. Both of these cell lines have been found to retain many of the inherent characteristics of native cells found in mice and humans, and thus provide useful information without the complications of in vivo models.13,14 A detrimental inflammatory reaction is the most prominent host response toward tissue-engineered devices and is often the primary reason for implant failure.15 In addition to its involvement in many other cellular processes, interleukin-1 beta (IL-1β) is one of the most potent proinflammatory cytokines involved in physiological immune responses. Therefore, the monitoring of IL-1β expression profiles is useful in this study to monitor inflammatory processes and is crucial to the elucidation of the physicochemical properties of the material, which may be responsible for the induction of an inflammatory response.
After the propagation of the initial inflammatory response, the wound-healing process begins. Wound healing is mitigated by numerous mechanisms, including the remodeling of the extracellular matrix (ECM). The molecular and physical interactions that direct cell attachment to a substrate are crucial to understanding the fundamentals of cell adhesion, which influences cell growth, function, and survival.16 Fibronectin (FN) is a large (450 kDa), multidomain ECM protein that plays a critical role in mediating cell adhesion, and provides signals to direct cell functions of adjacent cells, including matrix remodeling and proliferation, two components of wound healing.17 Cell adhesion to ECM components, including FN, involves a collection of complicated dynamic processes that is primarily mediated by the integrin family of heterodimeric receptors.18 Integrin-mediated adhesion is a highly regulated process involving mechanical coupling to extracellular ligands,17 and subsequent clustering of bound receptors and rapid association with the actin cytoskeleton to form focal adhesions.16 FN also interacts with fibrin and activated platelets in clot formation and mediates the attachment and activation of neutrophils, macrophages, and other inflammatory cells in the inflammatory response.
In this instance the goal is to define how the surface topography and surface energy of structurally related but immiscible blends affect biological response. Thin films of polymer mixtures macroscopically phase separate with domain sizes typically on the micron-length scale and generally lead to changes in the film properties, including topology, roughness, and surface energy. A range of variables including temperature, film thickness, and the chemical nature of both the boundaries and individual polymers, respectively, dictate the extent of phase separation of binary polymer mixtures. Recent studies have shown that cells respond to topographic features on the nanometer- and micron-length scales.19–22 For example, variations in crystallinity lead to changes in surface roughness on nanometer-length scales, which strongly impacts cell proliferation.4 Model surfaces consisting of microscale patterns of grooves and ridges influence cell alignment along the pattern edges and anisotropies.21,23,24 What remains unclear is how the surface characteristics, including the extent of phase separation, within this series of tyrosine-derived polycarbonates and discrete blend materials will influence the acute inflammatory response and extracellular matrix production. Initial efforts described herein have been focused on the characterization of homopolymer and phase-separated blend films of tyrosine-derived polycarbonates, developing in vitro assays for the measurement of inflammation and ECM gene regulation and identifying key physicochemical parameters that influence the measurable responses. It is anticipated that these in vitro methods will provide preliminary assessments of in vivo material performance and provide the basis from which to explore further material optimization using combinatorial methods.
Experimental
Materials
Unless otherwise listed, all solvents and reagents were purchased from Sigma (St. Louis, MO) and used as received. ε-polycaprolactone was obtained from Sigma (St. Louis, MO, Mw = 80,000). QuantiTect SYBR Green RT-PCR Kit, and Rneasy Kit were obtained from Qiagen (Valencia, CA). Cells were cultured in sterile 150 × 25-mm nonpyrogenic tissue-culture polystyrene (TCPS) flasks (Daigger, Vernon Hills, IL). Tyrosine-derived polycarbonates were synthesized as described previously.25 In these studies, the alkyl ester pendent chain (R) of the poly(desaminotyrosyl tyrosine ester carbonate) is an ethyl (E), butyl (B), hexyl (H), or octyl (O) chain. The weight-average molecular mass and molecular mass distribution (PDI) for each of the polymers used in these studies are listed. DTE: Mw = 131,000, Mw/Mn = 3.0; DTB: Mw = 75,100, Mw/Mn = 2.5; DTH: Mw = 57,300, Mw/Mn = 2.4; DTO: Mw = 61,500, Mw/Mn = 2.7.
Thin-Film preparation
Round glass coverslips (22 mm, Fisher, Pittsburg, PA, No. 1½) were precleaned with the use of a 1-h ultrasonication bath in a 50:50 (vol %) methanol/water solution. Tyrosine-derived polycarbonate homopolymers and blends were spun coat onto the coverslips at speeds of 2000 rpm from dichloromethane solutions 10 mg/mL in concentration. Blends were mixed in various compositions with the use of DTE and DTO tyrosine-derived polycarbonates in 70/30, 50/50, 30/70 ratios (DTE/DTO, by mass). Following the spin-coating process, the polymer-coated glass disks were annealed at 105°C for 16 h under vacuum. Prior to cell seeding the disks were soaked in a 70% (volume fraction) ethanol solution for at least 30 min followed by several PBS and cell media rinses.
Contact-angle measurements
The static contact angle of water on the prepared surfaces was measured at 25°C with the use of water as the probe fluid by operating a drop-shape analysis system of DSA 10 Mr2 (Krüss, Germany). The standard uncertainty of contact angle measurements for each composition was determined by the standard deviation between six independent measurements on each of two sample discs prepared under identical conditions.
Atomic-Force Microscopy (AFM)
Oscillating mode atomic-force microscopy measurements were conducted in air with a Nanoscope IV system (Digital Instruments) operated under ambient conditions with standard silicon tips (Nanodevices; L, 125 μm; normal spring constant, 40N/m; resonance frequency, 300–360 kHz). RMS roughness measurements were determined with the use of standard Digital Instruments software, and averages and standard deviations were determined from three measurements from each of two different polymer thin-film samples.
Differential scanning calorimetry (DSC)
The thermal behavior was studied by differential scanning calorimetry with the use of a Perkin Elmer (Wellesley, MA) DSC 7 operated under nitrogen and calibrated with indium. The DSC scanning curves were collected at a heating rate of 10°C/min.
Time-of-flight secondary ion mass spectrometer (TOF-SIMS analysis)
TOF-SIMS experiments were performed on an Ion-TOF IV (Münster, Germany) time-of-flight secondary ion mass spectrometer equipped with a 10-keV Cs+ primary ion beam source, which bombarded the surface at an incident angle of 45° to the surface normal. The target current was maintained at ≈2-pA pulsed current with a pulse width of 1 ns and a 150-μs cycle time (≈6666-Hz frequency). Each spectrum was averaged over a 120-s time period with a raster size of ≈200 × 200 μm. These conditions resulted in Cs+ ion doses that were well below the static SIMS limit of 1013 ions/cm2. Resulting mass resolutions were typically >3000. Both positive and negative secondary ions were extracted from the sample into a reflection-type time of flight mass spectrometer. The secondary ions were then detected by a microchannel plate detector with a postacceleration energy of 10 kV. A low-energy electron flood gun was utilized for charge neutralization, where the approximate electron dose per analysis was around 1 × 10²⁰ electrons/m2. It is expected that any damage from the electron beam is minimal in comparison to primary ion beam damage.
Cell lines
RAW 264.7 cells were purchased from ATCC and maintained in RPMI supplemented with 10 % (volume fraction) heat-inactivated fetal bovine serum (FBS, Life Technologies, Rockville, MD), in 5 % CO2: 95% air (volume fractions) at 37°C. To harvest, RAW 264.7 cells were washed with calcium and magnesium-free phosphate-buffered saline, and subsequently incubated with HBSS to promote release from the flask. MC3T3-E1 cells (subclone 4) were obtained from ATCC cultured in flasks (75-cm2 surface area) at 37°C in a fully humidified atmosphere at 5% CO2 (volume fraction) in Eagle's minimum essential medium (α-modified, BioWhittaker, Inc., Walkersville, MD). The medium was supplemented with fetal bovine serum (10 %, volume fraction, Gibco, Rockville, MD). Established protocols for the culture and passage of MC3T3-E1 cells were followed,26 including passage with trypsin (2.5 g/L, 0.25% mass fraction) containing 1 mmol/L ethylenediamine tetraacetic acid (Gibco) once per week.
mRNA extraction
Cells were plated (2 mL, 500,000 cells/mL) in sterile 12-well nonpyrogenic polystyrene tissue-culture plates (Daigger, Vernon Hills, IL) containing polymer-coated 22-mm glass coverslips. Following a defined incubation period, the mRNA extraction was carried out with the use of the materials and protocol provided in the Rneasy Kit from Qiagen (Valencia, CA). The mRNA extraction protocol was followed according to the manufacturer's specification, except a 21-gauge needle was used to homogenize the sample. The RNA was treated with RNA Secure immediately following elution and stored at −20°C. Standard spectrophotometric measurements were taken and a 2% agarose gel stained with 10 μg/mL ethidium bromide (Sigma, St. Louis, MO) was used to image the RNA. Densitometry was performed with the use of the Versa Doc imaging system (Bio-Rad, Hercules, CA).
Standards
The plasmids containing the cDNA inserts for TNF-α, IL-1β, and the 18 S ribosomal subunit were purchased from ATCC. The plasmids were grown in luria-bertani (LB) medium (ATCC, medium 1065) with 100 μg/mL of ampicillin for selection purposes. Plasmid DNA was isolated with the use of the Plasmid Giga Kit (Qiagen, Valencia, CA) following the manufacturer's protocol. The standards for fibronectin, actin, and collagen I were created from amplicons. Spectrophotometric measurements were made at 260 nm, and a 1% agarose gel stained with 10 μg/mL ethidium bromide (Sigma, St. Louis, MO) was used to image the DNA. Densitometry was performed with the use of the Versa Doc imaging system (Bio-Rad, Hercules, CA).
Primer Design
Primers were designed using Primerfinder (Whitehead Institute for Biomedical Research) for the RT-PCR experiments. The primers generated were used in both PCR and RT-PCR experiments. They are as follows:
18S: 5′-agcgaccaaaggaaccataa-3′ and 3′-ctcctcctcctcctctctcg-5′
TNF-α: 5′-tttcctcccaataccccttc-3′ and 3′-agtgcaaaggctccaaagaa-5′
IL-1β: 5′-tgtgaaatgccaccttttga-3′ and 3′-gtagctgccacagcttctcc-5′
Actin: 5′-aggctgtgctgtccctgtat-3′ and 3′-atgtcgaagtggtggtgtcg-5′
Collagen I: 5′-aacgagatcgagctcagaggcgaag-3′ and 3′-gaagcacatttgagggaggtggggt-5′
Fibronectin: 5′-agagcaagaggcaggctcagcaaat-3′ and 3′-tcgttcggacttggacttctctgga-5′
RT-PCR
RT-PCR was carried out with the use of the QuantiTect SYBR Green RT-PCR Kit and protocol (Qiagen, Valencia, CA). All RT-PCR experiments were performed with the use of the iCycler (Bio-Rad, Hercules, CA). The protocol utilizes the following thermal parameters: Reverse Transcription: 30 min at 50°C. Activation step: 15 min at 95°C. 3 Step cycling: denaturation for 30 s at 95°C, annealing for 2 min at 57°C, and extension for 2 min at 72°C for 45 cycles. A melt curve was subsequently performed to analyze the products generated, which began at 50°C and increased to 95°C in 1°C increments. With the use of a reverse-transcriptase enzyme, mRNA was converted to the cDNA template of the specific marker. Then gene-specific primers, a DNA polymerase, and a fluorescent moiety were utilized to amplify and label the amplicon generated. The gene product accumulation was then measured during the exponential phase of the amplification reaction.27 The copy number from each of the samples was obtained by extrapolating to a standard gene curve of known concentration and copy number to yield quantitative data. The assay also includes the analysis of mRNA that does not change in relative abundance (18S) during the course of treatment to serve as an internal control.28 The positive control in this series of experiments is the addition of lipopolysaccharide (bacterial cell wall component)29 to see if the cells are responding to inflammatory stimuli. In these experiments the cells responded appropriately, but the data are not included because they are not relevant to the point emphasized here.
Immunofluorescence staining and fluorescence microscopy protocol
For visualization of cytoskeletal elements, cells plated at 200 cells/mm2 (2 mL, 100,000 cells/mL) for 16 h were extracted in 0.5% Triton X-100 in cytoskeleton buffer (50 mM NaCl, 150 mM sucrose, 3 mM MgCl2, 20 μg/mL aprotinin, 1 μg/mL leupeptin, 1 mM phenylmethylsulfonyl fluoride, 10 mM PIPES buffer, pH 6.8) at 0°C for 10 min to remove membrane and soluble cytoskeletal components, leaving behind focal adhesion structures. Extracted cells were then fixed in cold formaldehyde (3.7% in PBS) for 5 min, blocked in 5% fetal bovine serum for 1 h, and incubated with the primary antibody (monoclonal antivinculin, V-4505) against vinculin followed by a 1-h incubation in FITC-labeled secondary antibody (Molecular Probes, Eugene, OR), Texas Red-phalloidin (Molecular Probes, Eugene, OR) to stain actin microfilaments, and counterstained with Hoechst dye (Molecular Probes, Eugene, OR) to stain DNA. The images were collected with the use of a Nikon Eclipse TE 300 fluorescence microscope equipped with a 60×, 1.4-numerical aperture (NA) oil immersion objective. The images collected were approximately 240 μm × 180 μm in size.
Results and Discussion
The Rutgers group has developed a library of tyrosine-derived polycarbonates for use in orthopedic, tissue engineering, and drug-delivery applications.25,30–34 These materials share a structurally identical backbone with a rich chemical and structural diversity, which depend solely on the pendent ester substituent. The physical and chemical nature of the pendant group significantly affects the mechanical properties, degradation rates, and cellular responses. Tyrosine-derived polycarbonates possess three potentially degradable linkages: amide, carbonate, and ester. The carbonate linkage hydrolyzes at a faster rate than the ester group, and the amide bond is not labile under in vitro physiological conditions.32,34 The ethyl side chain hydrolyzes most quickly, followed in increasing order by the butyl, hexyl, and octyl derivatives, denoted herein as DTE, DTB, DTH, and DTO, which are shown, respectively, in Figure 1.
Figure 1.
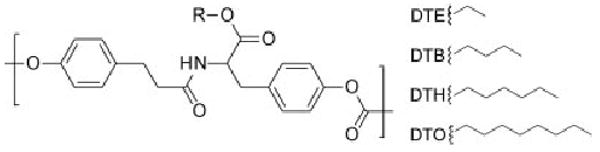
Synthetic scheme and chemical structure desaminotyrosyl-tyrosine alkyl esters and the resulting polycarbonates. The pendent R groups of the polycarbonates reported in this article consist of ethyl, butyl, hexyl, and octyl esters, respectively. The corresponding polymers are referred to as poly(DTE carbonate), poly(DTB carbonate), poly(DTH carbonate), and poly(DTO carbonate).
The rate of hydrolysis was demonstrated to have an effect on the nature of the resulting cell-substrate interface in vivo, and the investigators have proposed that the hydrolysis of the pendent alkyl groups creates biomineral chelation sites on the surface of the polymer implant materials. Differences observed at the bone–implant interface have included both fibrous encapsulation and direct bone apposition,31 with measured results indicating DTE having produced nearly 70% apposition and 30 % encapsulation, whereas DTO showed less than 20% apposition, showing clearly that this small change in side-chain derivation significantly affects the biological response both in vitro and in vivo. The observed differences with regard to capsule formation and resulting clinical outcome within this group of structurally similar materials led us to hypothesize that further optimization of the polymer composition by material blending would lead to surfaces that minimized this type of inflammatory response.
Characterization of the polymer thin films
For both the surface characterization and cell experiments, round glass coverslips were spin-coated with each of the respective compositions. The atomic force microscopy (AFM) images of the annealed polycarbonate homopolymers yielded very smooth amorphous thin films that were largely indistinguishable by optical or AFM methods (Figure 2). The annealing step did not alter significantly the root-mean-square (RMS) roughness in any of the homopolymers as measured by AFM. The experimentally measured water contact angle and glass transition temperatures for each of the homopolymers films were within 2° of the values reported previously in the literature.25,35
Figure 2.
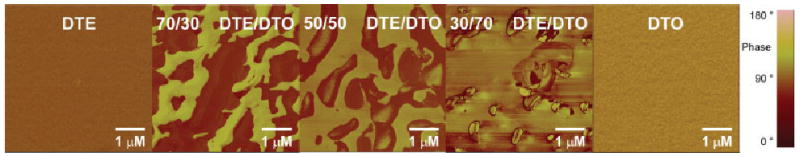
From left to right in the five 5 × 5-μm AFM images shown above, the amount of DTO is increasing. The discrete DTE/DTO blends form phase-separated domains under in vacuo, 105°C annealing conditions. The size and spacing of the domains are tunable by varying the composition of the blend. [Color figure can be viewed in the online issue, which is available at www.interscience.wiley.com.]
A series of discrete blends were made to outline small areas of physical parameter space to probe whether more significant differences in cell response existed and could be measured. The ethyl (DTE) and octyl (DTO), tyrosyl esters were chosen because they possessed the largest differences in water contact angle and glass-transition temperature, and significant biological data have already been acquired for these materials. The series consisted of 30/70, 50/50, and 70/30 (by mass) DTE/DTO ratios and the acquired physical characterization data for each are listed in Table I.
TABLE I. Homopolymer and Blend Characterization Data.
| Sample Composition | Glass-Transition Temperature (°C) | Contact Angle Water (°) | Surface Roughness RMS (nm) | |||
|---|---|---|---|---|---|---|
| DTE | DTO | Annealed | Unannealed | |||
| 100 | 0 | 99.2 ± 0.7 | 71.4 ± 0.8 | 2.69 ± 1.49 | 2.30 ± 2.48 | |
| 70 | 30 | 95.2 ± 0.4 | 53.3 ± 1.2 | 91.1 ± 0.9 | 50.77 ± 7.19 | 5.77 ± 3.04 |
| 50 | 50 | 95.9 ± 0.7 | 54.0 ± 0.8 | 89.1 ± 1.8 | 44.59 ± 4.32 | 4.71 ± 3.06 |
| 30 | 70 | 96.6 ± 0.5 | 51.5 ± 0.7 | 92.7 ± 2.2 | 45.94 ± 10.45 | 5.26 ± 2.48 |
| 0 | 100 | 52.6 ± 1.6 | 91.4 ± 1.0 | 2.40 ± 1.30 | 3.07 ± 1.38 | |
In each of the annealed blend compositions, two distinct phases, which correspond predominantly to DTE and DTO, are seen. In the 70/30 DTE/DTO blend, a two-phase bicontinuous network was observed, whereas the 50/50 and 30/70 blends exhibit more isolated domains of various size. The darker phase features in Figure 2 decrease qualitatively with increasing DTO content. In this instance, a change in temperature initiated phase separation where the two blend components spontaneously demixed from their initially homogeneous state. Prior to the annealing process, the blends were smooth homogeneous films slightly rougher than the homopolymer materials. However, during the annealing process and the accompanied phase separation, the blends become significantly rougher (Table I). AFM micrographs indicated partial phase separation at 8 h, but generally 16 h at 105°C was required to complete the process. Annealing for longer periods of time (72 h) did not change the domain sizes of the respective films significantly or lead to polymer degradation. Contact-angle and AFM images acquired after the soaking and rinsing processes followed by a brief drying period at ambient temperature indicated that the surface topology and roughness were not altered during the sterilization processes.
The heterogeneity of the films accompanying the phase separation process often leads to changes in the film properties. In particular, the demixing process of a blend is influenced by the formation of an interface, which may lead to surface-oriented phase separation, the formation of a wetting layer, or surface properties that differ significantly from those in the bulk. The possible presence of a hydrophobic wetting layer due to the water contact angle being very close to that of the DTO homopolymers led to the use of time-of-flight secondary-ion mass spectrometry (TOF-SIMS), which was able to measure the relative amounts of each polymer present at the surface. The SIMS technique used in these analyses is sensitive to the top 10 Å of the material surface, where both of the characteristic peaks of the DTE and DTO polymers identified previously by Belu et al.36 have been measured. The characteristic fragmentation peaks for DTE (191) and DTO (275) are noted in the respective spectra of Figure 3. In each of the blend samples both sets of characteristic peaks are present and identifiable. The presence of both materials on the surface is also evident in the phase micrographs of the blends imaged by AFM. The dominance of the contact-angle measurements by the DTO phase is most likely due to the fact that the water drops are larger than the respective domain sizes, and consequently only the contact angle of the most hydrophobic phase is observed. Furthermore, the contact angles were measured over extended periods of time with no measurable changes. This leads to confidence that the surface is not remodeling under the time constraints of these experiments.
Figure 3.
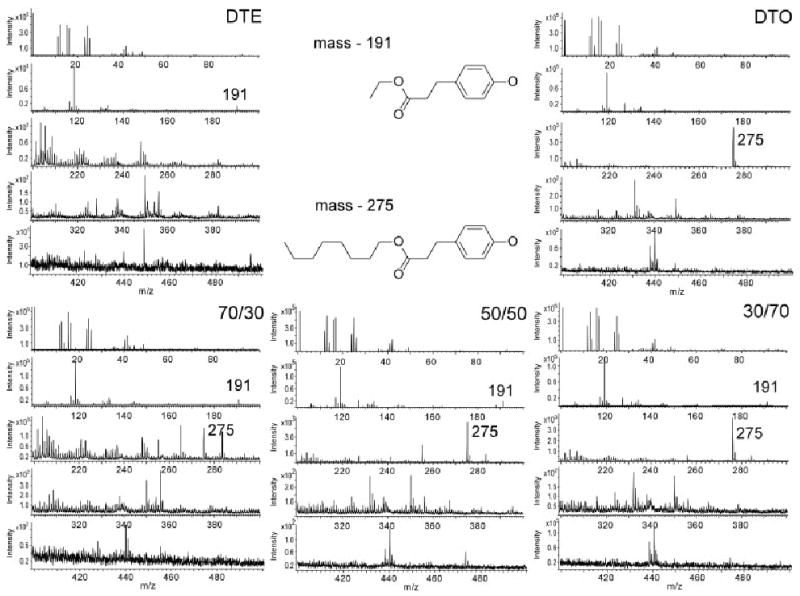
Negative-ion TOF-SIMS of the tyrosine-derived homopolymers and the respective blends showing the characteristic peaks for DTE (191) and DTO (275) and the chemical structures for the common ion fragments first identified by Belu et al.36 show that both materials are present at the surface in the phase-separated blends.
Homopolymer Responses
Real-time polymerase chain reaction (RT-PCR), which has been utilized previously to monitor cytokine proliferation37 and specifically, the genetic expression profiles of IL-1β and TNF-α,29,38,39 was utilized to quantitate the cellular responses to the tyrosine-derived polycarbonates. Following brief ethanol incubation and PBS/media washes, macrophages were seeded on the polymer-coated coverslips and the cells were allowed to adhere. At 8, 24, and 72 h of incubation, mRNA was extracted from each of the cell populations and analyzed by RT-PCR. The inflammatory cytokine expression profiles of the RAW 264.7 cells to the tyrosine-derived polycarbonates (DTE, DTB, DTH, and DTO, respectively), tissue-culture polystyrene, and poly(ε-caprolactone) at the 24-h time point are shown in Figure 4 (A). At the 8, 24, and 72 h time points, measured pairwise differences in TNF-α mRNA synthesis between the respective substrates were statistically insignificant. After 8 h of incubation, insignificant differences were seen in the IL-1β copy numbers. However, at 24 h, measurable differences were seen in IL-1β production, though between the tyrosine-derived polycarbonates, PCL, and TCPS. However, by 72 h, the measured copy numbers of both cytokines had returned to baseline levels (data not shown). PCL and all of the tyrosine polycarbonates except for DTO exhibited significant increases (50-to 172-fold) in IL-1β production compared to TCPS at the 24-h time point. DTB had the highest relative production of IL-1β gene copy numbers followed by DTH, DTE, PCL, and DTO, respectively.
Figure 4.
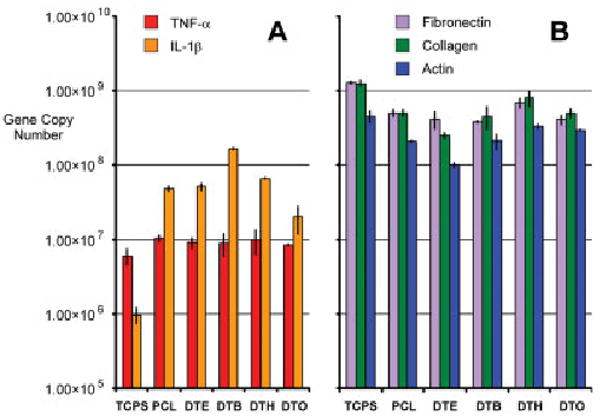
(A) Gene copy numbers of IL-1β and TNF-α in RAW 264.7 macrophages after 24 h of exposure. (B) Relative differences in actin, fibronectin, and collagen I gene copy numbers in MC3T3-E1 osteoblasts for each of the tyrosine-derived polycarbonates (DTE, DTB, DTH, and DTO, respectively), TCPS, and PCL after 3 h of incubation. Error bars are representative of one standard deviation from the mean of triplicate samples harvested from a single population of cells, and are the estimate of the standard uncertainties. [Color figure can be viewed in the online issue, which is available at www.interscience.wiley.com.]
Figure 4 (B) depicts the differences in gene copy number for each of the tyrosine-derived polycarbonates (DTE, DTB, DTH, and DTO, respectively), TCPS, and PCL after 3 h of incubation, at which time the vast majority of the bone osteoblasts were observed to be adhered to the substrates. It is unclear what this up-regulation in IL-1β ultimately means to the long-term viability of the cell. The more detrimental TNF-α cytokine was not upregulated to the same extent, and negligible differences were measured in flow cytometry experiments over similar time frames. The differences in TNF-α and IL-1β expression measured in this series reflect different pathways of signal transduction40 with regard to both the time frame and the severity of the response29,41–43 to the respective inflammatory stimuli. Additionally, it was hypothesized that the changes in the expression of the extracellular matrix proteins (fibronectin and collagen I) and the cytoskeleton protein actin may provide an early indication of cellular response to this series of tyrosine-derived polycarbonate homopolymers, PCL, and TCPS. The gene expression profiles for each of the ECM and cytoskeleton markers were downregulated for all of the desaminotyrosyl tyrosine polycarbonate homopolymers relative to TCPS. The slight, but in some instances statistically significant, differences in inflammatory cytokine expression, extracellular matrix (FN and collagen I) and cytoskeletal (actin) expression led to the belief that optimizations could be made with regard to composition.
Blend Responses
To evaluate the responses of macrophages and osteoblasts to DTE, DTO, and the respective blends, cells of each type were plated on polymer-coated disks, and mRNA was harvested from the samples after 24 h of incubation. The studies described herein measure how the genetic expression levels of IL-1β and FN vary for the series of blends of DTE and DTO in two different cell lines. The present focus was on FN expression at the shorter time points, because it is expected that the largest differences in collagen I expression would be measured at longer time points and is currently the focus of another ongoing study. The first expression marker investigated was IL-1β, to determine if and to what extent discrete DTE/DTO blends would affect the expression profiles of the cells. It has been shown that statistically significant differences in IL-1β expression exist between the respective homopolymers and blend compositions in the macrophage cell line. Each of the blends elicited an upregulated response relative to the individual hompolymers. However, the surfaces were not cytotoxic, as evidenced by the lack of TNF-α expression in the samples and by negligible cell death observed visually or measured in the apoptosis assays using flow cytometry (data not shown). The blends elicited a proinflammatory response that was elevated in comparison to TCPS and the respective homopolymer samples in the macrophage populations. The DTE and DTO homopolymers were measured as having a 2.2-fold and 6.7-fold increase in IL-1β copy numbers relative to TCPS. As shown in Figure 5, the increases were much more pronounced in each of the blend samples with the 70/30, 50/50, and 30/70 (DTE/DTO) registering 48.4-, 199.7-, and 67.6-fold greater gene copy numbers that TCPS, respectively. The measured difference between the 70/30 and the 30/70 was insignificant (p ≈ 0.25) but the 50/50 blend measured 4.1- and 2.9-fold higher copy numbers than the other blends, respectively.
Figure 5.
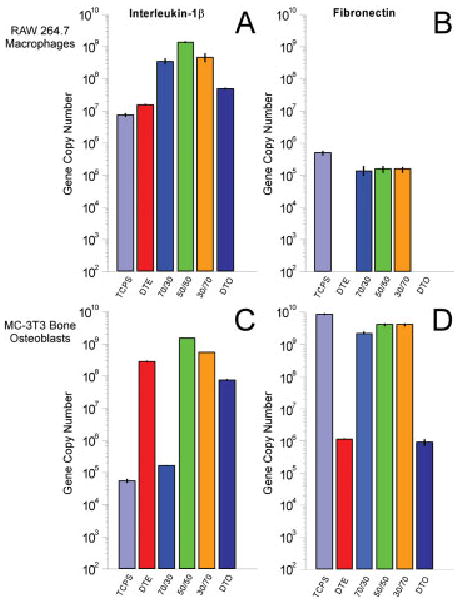
Depicts gene copy numbers of interleukin-1β (IL-1β) (A and C), and fibronectin (B and D) after 24 h of exposure on the respective surface for RAW 264.7 macrophages (A and B) and MC3T3 E1 bone osteoblasts (C and D). Error bars are representative of one standard deviation from the mean of triplicate samples harvested from a single population of cells, and are the estimate of the standard uncertainties. [Color figure can be viewed in the online issue, which is available at www.interscience.wiley.com.]
The osteoblasts also demonstrated significant differences in IL-1β mRNA levels, but the exhibited trends were compositionally dependent. For osteoblasts, the homopolymers DTE and DTO demonstrated ≈5.1 × 10³- and 1.4 × 10³-fold increases in cytokine induction in relationship to TCPS control levels. The gene copy numbers produced by each of the homopolymers in the MC3T3-E1 populations were similar, and the blend samples were expected to exhibit similar expression levels. The 50/50 and 30/70 (DTE/DTO) blends measured ≈2.7 × 10⁴- and 1.0 × 10⁴-fold increases over control levels. However, the 70/30 DTE/DTO blend only registered at 2.9-fold increase over TCPS at the 2- h time point. The underlying physicochemical parameter causing the significant and reproducible decrease in IL-1β gene expression is unknown at this point and is currently being investigated further. The fold increases and the p values (p < 0.05 significant at 95% confidence) indicating statistical significance are listed in Table II.
TABLE II. Measures of Relative Gene Expression Differences and Levels of Statistical Significance for each of the DTE and DTO Homopolymers and Discrete Blends.
| Interleukin-1β | Fibronectin | |||||||||||
|---|---|---|---|---|---|---|---|---|---|---|---|---|
| Sample | TCPS | DTE | 70/30 | 50/50 | 30/70 | DTO | TCPS | DTE | 70/30 | 50/50 | 30/70 | DTO |
| RAW 264.7 Macrophages | ||||||||||||
| TCPS | – | 0.45 | 0.02 | 0 | 0.01 | 0.15 | – | – | 3.6 | 3.2 | 3.3 | – |
| DTE | 2.2 | – | 0.05 | 0.01 | 0.03 | 0.32 | – | – | – | – | – | – |
| 0.013 | ||||||||||||
| 70/30 | 48.4 | 22.1 | – | 0.24 | 0.249 | 7.1 | 0.28 | – | – | 0.918 | 0.812 | – |
| 0.014 | 0.015 | 0.008 | ||||||||||
| 50/50 | 199.7 | 91.4 | 4.1 | – | 2.9 | 33.3 | 0.31 | – | 0.918 | – | 0.772 | – |
| 0.002 | 0.002 | 0.009 | 0.030 | |||||||||
| 30/70 | 67.6 | 30.9 | 0.249 | 0.34 | – | 10.0 | 0.30 | – | 0.812 | 0.772 | – | – |
| 0.034 | 0.035 | 0.026 | 0.029 | |||||||||
| DTO | 6.7 | 3.1 | 0.14 | 0.03 | 0.10 | – | – | – | – | – | – | – |
| 0.002 | 0.003 | 0.019 | 0.002 | 0.040 | ||||||||
| MC 3T3 Bone Osteoblasts | ||||||||||||
| TCPS | – | 0 | 0.34 | 0 | 0 | 0 | – | 4860 | 3.7 | 2.0 | 2.0 | 9640 |
| DTE | 5070 | – | 0.04 | 0.01 | 0.04 | 0.06 | 0 | – | 0 | 0 | 0 | 0.189 |
| 0.002 | ||||||||||||
| 70/30 | 2.9 | 23.7 | – | 0 | 0 | 0 | 0.27 | 1970 | – | 0.56 | 0.56 | 2570 |
| 0.001 | 0.005 | 0.004 | ||||||||||
| 50/50 | 27200 | 103 | 9310 | – | 2.6 | 20 | 0.49 | 3630 | 1.8 | – | 0.962 | 4710 |
| 0.000 | 0 | 0.020 | 0.005 | 0.010 | ||||||||
| 30/70 | 10000 | 23.0 | 3430 | 0.38 | – | 7.1 | 0.49 | 3600 | 1.8 | 0.962 | – | 4680 |
| 0.002 | 0 | 0 | 0.018 | 0.004 | 0.009 | |||||||
| DTO | 1410 | 16.7 | 481 | 0.05 | 0.14 | – | 0 | 0.189 | 0 | 0 | 0 | – |
| 0.004 | 0.001 | 0 | 0 | 0.002 | 0.004 | 0.005 | 0.004 | |||||
Note. The top number indicates the relative fold differences, the bottom number denotes the p value (p< 0.05 significant at 95% confidence, derived from the Student t test) indicating statistical significance, and bold numbers denote comparisons that are statistically insignificant.
Variations in ECM production on the polymer samples were measured next by quantifying the expression profile of FN in each of the cell populations. The RAW 264.7 macrophages do not express large quantities of FN; thus it was anticipated that FN copy numbers would be lower than other epithelial cell types such as the fibroblasts (or osteoblasts). The tyrosine polycarbonate blends displayed levels of FN that were relative to levels of TCPS. However, FN expression levels were undetectable on the discs coated with DTE and DTO homopolymers at 24 h. A similar upregulation trend was seen on each of the discrete blend populations in the osteoblast populations. The osteoblast mRNA expression levels of FN on the DTE and DTO homopolymers samples were 4.8 × 10³- and 9.6 × 10³-fold lower than the TCPS population. Furthermore, the osteoblast levels of FN gene expression on the blend samples were comparable to TCPS levels.
These findings provided data that were complementary, meaning that the DTE/DTO polymer blends stimulated the upregulation of FN relative to each of the homopolymers singly in both cell types. The compositionally dependent gene expression data demonstrate that different compositions and surface topographies can alter the gene expression behavior in these cells. Although the roughness in the blend samples as compared to the homopolymers appears to have contributed significantly to the upregulation in both gene expression markers, the differences cannot entirely explain the statistically significant differences between the respective compositions.
It is hypothesized that the orientation or the distribution of orientations of serum proteins adsorbed on the respective substrates is contributing to the compositionally distinct gene expression behavior in the osteoblast and macrophage populations. Numerous contributions in the literature demonstrate that the species, amount, and conformation of the proteins that bind are dictated by the chemistry of the polymer surface.43–45 The initial attachment of cells to surfaces is mediated by proteins from the serum that adsorbed onto the polymer surface.46 The confirmation and orientation of these adsorbed proteins affects the accessibility of the respective cell-binding sites on the protein molecule, which could affect the subsequent gene expression behavior.47,48 Efforts to characterize these differences in protein adsorption quantity and orientation are ongoing, but are beyond the scope of this article.
After the mRNA expression profiles in the cell populations were quantified, the cell morphology, cytoskeleton characteristics, and ECM distribution on each of the compositions were examined further. The MC3T3-E1 osteoblasts and RAW 264.7 macrophages were stained with the use of immunofluorescent techniques. Texas Red-conjugated phalloidin was used to stabilize and stain the fibrillar actin, and FITC-conjugated secondary antibody to an antivinculin primary antibody was used to look at the vinculin distribution to examine if gross changes were occurring in the cytoskeleton, cell spreading, or in the focal adhesion contacts (Figure 6). Vinculin is a eukaryotic protein located on the cytoplasmic side of focal adhesion contacts that is involved in the attachment of the actin-based microfilaments to the plasma membrane.49 It is also indirectly linked to FN through direct interaction with talin, which binds the intracellular domain of the FN receptor that mechanically couples to FN. Upon close examination of the vinculin staining (focal contact assemblies) there are distinct differences in the amount of cell spreading and the shape and extension of the lamellapodia (Figure 6). The reduced spreading and large lamellapodia protrusions of the MC3T3-E1 cells on DTO are readily apparent in comparison to those imaged on the TCPS and DTE homopolymer. The extension and distortion of the lamellapodia increase in the blend samples with increasing DTO content. Also, the cells appear to spread less with increasing DTO content as seen in the distribution of the fibrillar actin.
Figure 6.
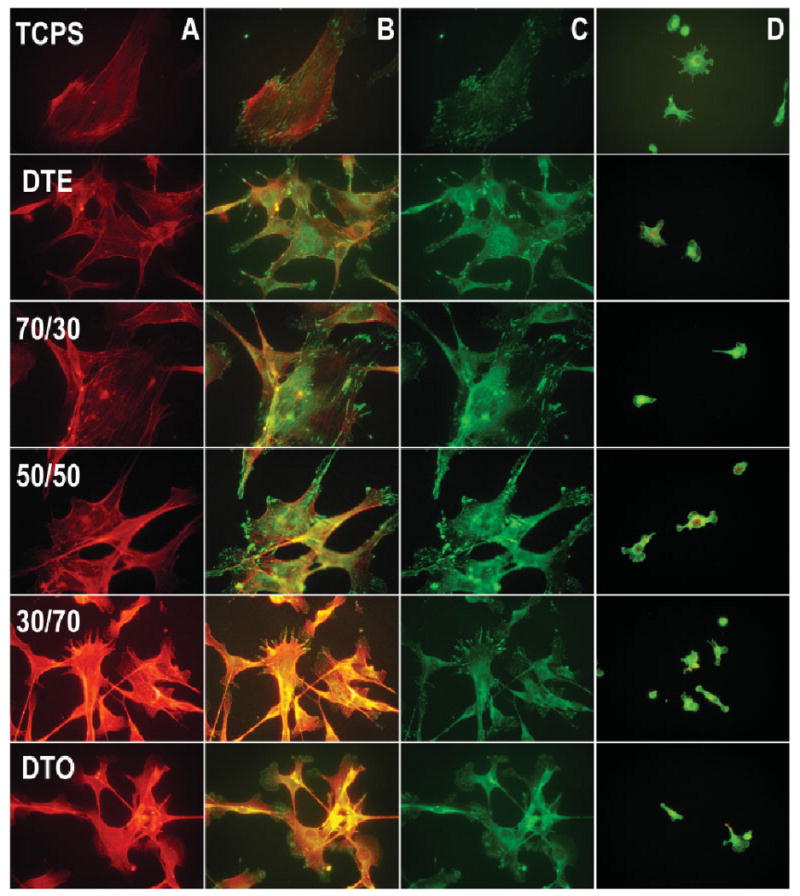
Immunofluorescent staining for (A) actin, (C) vinculin, (B) overlays of MC3T3-E1 osteoblasts, and (D) RAW 264.7 macrophages, showing the cytoskeleton and focal adhesion contact formation 16 h after seeding on each of the respective homopolymers and blends. [Color figure can be viewed in the online issue, which is available at www.interscience.wiley.com.]
In the macrophage populations, the differences in cell spreading are less apparent. Also, as expected, there are not any discernable focal adhesion contacts despite the upregulation of gene expression for FN. More quantitative measurements using automated fluorescence microscopy, which characterize the distributions of cell size, shape and spreading and the number, size and distribution of focal adhesion complexes between the homopolymers and the blends, are in progress.
Investigation of the physicochemical parameters that lead to the compositionally dependent expression behavior is ongoing. Of particular interest is the trend depicting upregulation of IL-1β and FN in most of the blend compositions relative to the homopolymers. Continuing studies by the Kohn group indicate that different amounts of various proteins adsorb to the individual homopolymers (unpublished results). The differences in phase domain size among the compositions may also influence both the amount and orientation distribution of adsorbed protein. These factors could contribute significantly to the differential gene expression seen in the homopolymers and compositional blends, and we are actively exploring new methods for measuring these phenomena.
Conclusions
Two-dimensional thin films consisting of homopolymers and discrete compositional blends of tyrosine-derived polycarbonates were prepared, and the surfaces were characterized in an effort to elucidate the nature of different cell responses that were measured in vitro. Genetic expression profiles of IL-1β and FN in both MC3T3-E1 osteoblasts and RAW 264.7 murine macrophages were measured at several time points, and the blends exhibited compositionally dependent gene-expression profiles that were significantly different than the respective homopolymer films. The physicochemical parameters that led to the upregulation of FN in each of the blend compositions are under investigation. Although the roughness in the blend samples as compared to the homopolymers certainly contributed significantly to the upregulation in both gene-expression markers, they cannot explain entirely the statistically significant differences between the respective compositions. The results of the discrete blend analyses provide the foundation for examination of 1D and 2D gradients of DTE and DTO to examine further the optimal composition and processing conditions that maximize extracellular matrix production and minimize IL-1β response. The results described in this article suggest strongly that there are numerous opportunities for combinatorial approaches to polymeric formulations in biomaterial applications.
Acknowledgments
The authors would like to thank Dr. Michael J. Fasolka and Dr. Lori A. Henderson for numerous discussions, suggestions, and helpful comments. Postdoctoral Fellowships (MLB, JSS, and NDG) from the NIST/National Research Council and support from the National Institutes of Health and the Advanced Technology Program of the National Institute of Standards and Technology are gratefully acknowledged. JK and AR were supported by RESBIO (the National Resource for Polymeric Biomaterials), supported by NIH Grant EB 003057.
Contract grant sponsor: NIST/National Research Council
Contract grant sponsor: National Institutes of Health (YI-DE-7006-01)
Contract grant sponsor: Advanced Technology Program of the National Institute of Standards and Technology
Contract grant sponsor: NIH NIBIB, Integrated Technologies Resource for Polymeric Biomaterials); contract grant number: EB001046
Abbreviations
- AFM
atomic force microscope
- ATCC
American Type Culture Collection
- EGTA
ethylene glycol bis(2-aminoethyl ether)-N,N,N′N′-tetraacetic acid
- HBSS
Hank's buffered salt solution
- FN
fibronectin
- IL-1β
interleukin-1 beta
- PBS
phosphate-buffered saline
- PCL
polycaprolactone
- PIPES
piperazine-1,4-bis(2-ethanesulphonic acid)
- RMS
root mean square
- RPMI
Roswell Park Memorial Institute
- RT-PCR
real-time reverse transcriptase polymerase chain reaction
- TCPS
tissue-culture polystyrene
- TNF-α
tumor necrosis factor alpha
Footnotes
Official contribution of the National Institute of Standards and Technology; not subject to copyright in the United States.
The authors will receive no benefit of any kind, either directly or indirectly. Certain commercial materials and equipment are identified in this article in order to specify adequately the experimental procedure. In no case does such identification imply recommendation by the National Institute of Standards and Technology; nor does it imply that the material or equipment identified is necessarily the best available for this purpose.
References
- 1.Karim A, Douglas JF, Sung LP, Ermi BD. Self assembly by phase separation in polymer thin films. In: Buschow KHJ, Cahn RW, Flemmings MC, Ilschner B, Kramer EJ, Mahajan S, editors. Encyclopedia of materials: science and technology. Elsevier Science; 2002. pp. 8319–8322. [Google Scholar]
- 2.Kohn J. New approaches to biomaterials design. Nat Mater. 2004;3:745–747. doi: 10.1038/nmat1249. [DOI] [PubMed] [Google Scholar]
- 3.Smith JR, Seyda A, Weber N, Knight D, Abramson S, Kohn J. Integration of combinatorial synthesis, rapid screening, and computational modeling in biomaterials development. Macromol Rapid Commun. 2004;25:127–140. [Google Scholar]
- 4.Washburn NR, Yamada KM, Simon CG, Kennedy SB, Amis EJ. High-throughput investigation of osteoblast response to polymer crystallinity: influence of nano-scale roughness on proliferation. Biomaterials. 2004;25:1215–1224. doi: 10.1016/j.biomaterials.2003.08.043. [DOI] [PubMed] [Google Scholar]
- 5.Meredith JC, Sormana JL, Keselowsky BG, Garcia AJ, Tona A, Karim A, Amis EJ. Combinatorial characterization of cell interactions with polymer surfaces. J Biomed Mater Res A. 2003;66:483–490. doi: 10.1002/jbm.a.10004. [DOI] [PubMed] [Google Scholar]
- 6.Smith AP, Sehgal A, Douglas JF, Karim A, Amis EJ. Combinatorial mapping of surface energy effects on diblock copolymer thin film ordering. Macromol Rapid Commun. 2003;24:134–135. [Google Scholar]
- 7.Brocchini S, James K, Tangpasuthadol V, Kohn J. A combinatorial approach for polymer design. J Am Chem Soc. 1997;119:4553–4554. [Google Scholar]
- 8.Anderson DG, Levenberg S, Langer R. Nanoliter-scale synthesis of arrayed biomaterials and application to human embryonic stem cells. Nat Biotechnol. 2004;22:863–866. doi: 10.1038/nbt981. [DOI] [PubMed] [Google Scholar]
- 9.Hoogenboom R, Meier MAR, Schubert US. Combinatorial methods, automated synthesis and high-throughput screening in polymer research: past and present. Macromol Rapid Commun. 2003;24:16–32. [Google Scholar]
- 10.Brodbeck WG, Voskerician G, Ziats NP, Nakayama Y, Matsuda T, Anderson JM. In vivo leukocyte cytokine m-RNA responses to biomaterials are dependent on surface chemistry. J Biomed Mater Res A. 2003;64:320–329. doi: 10.1002/jbm.a.10425. [DOI] [PubMed] [Google Scholar]
- 11.Xu C, Wu T, Drain CM, Batteas JD, Beers KL. Microchannel confined surface initiated polymerization. Macromolecules. 2005;38:6–8. [Google Scholar]
- 12.Wu T, Mei Y, Cabral JT, Xu C, Beers KL. A new synthetic method for controlled polymerization using a microfluidic system. J Am Chem Soc. 2004;126:9880–9881. doi: 10.1021/ja048432n. [DOI] [PubMed] [Google Scholar]
- 13.Chapekar MS, Zaremba TG, Kuester RK, Hitchins VM. Synergistic induction of tumor necrosis factor alpha by bacterial lipopolysaccharide and lipoteichoic acid in combination with polytetrafluoroethylene particles in a murine macrophage cell line RAW 264.7. J Biomed Mater Res. 1996;31:251–256. doi: 10.1002/(SICI)1097-4636(199606)31:2<251::AID-JBM12>3.0.CO;2-O. [DOI] [PubMed] [Google Scholar]
- 14.Tiffany CW, Burch RM. Bradykinin stimulates tumor necrosis factor and interleukin-1 release from macrophages. FEBS Lett. 1989;247:189–192. doi: 10.1016/0014-5793(89)81331-6. [DOI] [PubMed] [Google Scholar]
- 15.Babensee JE, Anderson JM, McIntire LV, Mikos AG. Host responses to tissue-engineered devices. Adv Drug Deliv Rev. 1998;33:111–139. doi: 10.1016/s0169-409x(98)00023-4. [DOI] [PubMed] [Google Scholar]
- 16.Geiger B, Bershadsky A, Pankov R, Yamada KM. Transmem-brane extracellular matrix- cytoskeleton crosstalk. Nat Rev Mol Cell Biol. 2001;2:793–805. doi: 10.1038/35099066. [DOI] [PubMed] [Google Scholar]
- 17.Garcia AJ, Huber F, Boettiger D. Force required to break a5b1 integrin fibronectin bonds in intact adherent cells is sensitive to integrin activation state. J Biol Chem. 1998;273:10988–10993. doi: 10.1074/jbc.273.18.10988. [DOI] [PubMed] [Google Scholar]
- 18.Hynes RO. Integrins: Bidirectional, allosteric signaling machines. Cell. 2002;110:673–687. doi: 10.1016/s0092-8674(02)00971-6. [DOI] [PubMed] [Google Scholar]
- 19.Tasai IY, Kimura M, Stockton R, Green JA, Puig R, Jacobson B, Russell TP. Fibroblast adhesion to micro and nano-heterogeneous topography using diblock copolymers and homopolymers. J Biomed Mater Res. 2004;71:462–469. doi: 10.1002/jbm.a.30183. [DOI] [PubMed] [Google Scholar]
- 20.Schneider GB, Perinpanayagam H, Clegg M, Zaharias R, Seabold D, Keller J, Stanford C. Implant surface roughness affects osteoblast gene expression. J Dent Res. 2003;82:372–376. doi: 10.1177/154405910308200509. [DOI] [PubMed] [Google Scholar]
- 21.Schneider GB, Zaharias R, Seabold D, Keller J, Stanford C. Differentiation of preosteoblasts is affected by implant surface microtopographies. J Biomed Mater Res A. 2004;69:462–468. doi: 10.1002/jbm.a.30016. [DOI] [PubMed] [Google Scholar]
- 22.Assender H, Bliznyuk Y, Porfyrakis K. How surface topography relates to material properties. Science. 2002;297:973–976. doi: 10.1126/science.1074955. [DOI] [PubMed] [Google Scholar]
- 23.Teixeira AI, Abrams GA, Bertics PJ, Murphy CJ, Nealey PF. Epithelial contact guidance on well-defined micro- and nanostructured substrates. J Cell Sci. 2003;116:1881–1892. doi: 10.1242/jcs.00383. [DOI] [PMC free article] [PubMed] [Google Scholar]
- 24.Teixeira AI, Nealey PF, Murphy CJ. Responses of human keratocytes to micro- and nanostructured substrates. J Biomed Mater Res A. 2004;71:369–376. doi: 10.1002/jbm.a.30089. [DOI] [PubMed] [Google Scholar]
- 25.Ertel SI, Kohn J. Evaluation of tyrosine-derived polycarbonates as degradable biomaterials. J Biomed Mater Res. 1994;28:919–930. doi: 10.1002/jbm.820280811. [DOI] [PubMed] [Google Scholar]
- 26.Attawia MA, Uhrich K, Botchwey A, Langer R, Laurencin CT. In vitro bone biocompatibility of poly(anhydride-co-imides) containing pyromellitylimidoalanine. J Orthop Res. 1996;14:445–454. doi: 10.1002/jor.1100140315. [DOI] [PubMed] [Google Scholar]
- 27.Bustin SA. Absolute quantification of mRNA using real-time reverse transcription polymerase chain reaction assays. J Mol Endocrinol. 2000;25:169–193. doi: 10.1677/jme.0.0250169. [DOI] [PubMed] [Google Scholar]
- 28.Suzuki T, Higgins PJ, Crawford DR. Control selection for RNA quantitation. Biotechniques. 2000;29:332–337. doi: 10.2144/00292rv02. [DOI] [PubMed] [Google Scholar]
- 29.Bailey L, Washburn N, Simon CG, Chan E, Wang FW. The quantification of inflammatory cellular responses using real-time polymerase chain reaction (RT-PCR) J Biomed Mater Res. 2004;69:305–313. doi: 10.1002/jbm.a.20134. [DOI] [PubMed] [Google Scholar]
- 30.Bourke SL, Kohn J. Polymers derived from the amino acid L-tyrosine: polycarbonates, polyarylates and copolymers with poly(ethylene glycol) Adv Drug Deliv Rev. 2003;55:447–466. doi: 10.1016/s0169-409x(03)00038-3. [DOI] [PubMed] [Google Scholar]
- 31.James K, Levene H, Parsons JR, Kohn J. Small changes in polymer chemistry have a large effect on the bone-implant interface: evaluation of a series of degradable tyrosine-derived polycarbonates in bone materials. Biomaterials. 1999;20:2203–2212. doi: 10.1016/s0142-9612(99)00151-9. [DOI] [PubMed] [Google Scholar]
- 32.Muggli DS, Burkoth AK, Keyser SA, Lee HR, Anseth KS. reaction behavior of biodegradable, photo-cross-linkable polyanhydrides. Macromolecules. 1998;31:4120–4125. [Google Scholar]
- 33.Tangpasuthadol V, Pendharkar SM, Kohn J. Hydrolytic degradation of tyrosine-derived polycarbonates, a class of new biomaterials. Part I: Study of model compounds. Biomaterials. 2000;21:2371–2378. doi: 10.1016/s0142-9612(00)00104-6. [DOI] [PubMed] [Google Scholar]
- 34.Tangpasuthadol V, Pendharkar SM, Peterson RC, Kohn J. Hydrolytic degradation of tyrosine-derived polycarbonates, a class of new biomaterials. Part II: 3-yr study of polymeric devices. Biomaterials. 2000;21:2379–2387. doi: 10.1016/s0142-9612(00)00105-8. [DOI] [PubMed] [Google Scholar]
- 35.Perez-Luna VH, Hooper KA, Kohn J, Ratner BD. Surface characterization of tyrosine-derived polycarbonates. J Appl Polym Sci. 1997;63:1467–1479. [Google Scholar]
- 36.Belu AM, Brocchini S, Kohn J, Ratner BD. Characterization of combinatorially designed polyarylates by time-of-flight secondary ion mass spectrometry. Rapid Commun Mass Spectrom. 2000;14:564–571. doi: 10.1002/(SICI)1097-0231(20000415)14:7<564::AID-RCM910>3.0.CO;2-0. [DOI] [PubMed] [Google Scholar]
- 37.Oppenheim JJ. Cytokines: past, present, and future. Int J Hematol. 2001;74:3–8. doi: 10.1007/BF02982543. [DOI] [PubMed] [Google Scholar]
- 38.Giulietti A, Overbergh L, Valckx D, Decallonne B, Bouillon R, Mathieu C. An overview of real-time quantitative pcr: applications to quantify cytokine gene expression. Methods Enzymol. 2001;25:386–401. doi: 10.1006/meth.2001.1261. [DOI] [PubMed] [Google Scholar]
- 39.Becker ML, Bailey LO, Wooley KL. Peptide functionalized shell cross-linked nanoparticles. 2. Biocompatability evaluation. Bioconjug Chem. 2004;15:710–717. doi: 10.1021/bc049945m. [DOI] [PubMed] [Google Scholar]
- 40.Raabe T, Bukrinsky M, Currie RA. relative contribution of transcription and translation to the induction of tumor necrosis factor-alpha by lipopolysaccharide. J Biol Chem. 1998;273:974–980. doi: 10.1074/jbc.273.2.974. [DOI] [PubMed] [Google Scholar]
- 41.Baer M, Dillner A, Schwartz RC, Sedon C, Nedospasov S, Johnson PF. Tumor necrosis factor alpha transcription in macrophages is attenuated by an autocrine factor that preferentially induces NF-kappaB p50. Mol Cell Biol. 1998;18:5678–5689. doi: 10.1128/mcb.18.10.5678. [DOI] [PMC free article] [PubMed] [Google Scholar]
- 42.Catelas I, Huk OL, Petit A, Zukor DJ, Marchand R, Yahida LH. Flow cytometric analysis of macrophage response to ceramic and polyethylene particles: effects of size, concentration, and composition. J Biomed Mater Res. 1998;41:600–607. doi: 10.1002/(sici)1097-4636(19980915)41:4<600::aid-jbm12>3.0.co;2-i. [DOI] [PubMed] [Google Scholar]
- 43.Tang L, Eaton JW. Inflammatory responses to biomaterials. Am J Clin Pathol. 1995;103:466–471. doi: 10.1093/ajcp/103.4.466. [DOI] [PubMed] [Google Scholar]
- 44.Evans MDM, Pavon-Djavid G, Hélary G, Legeais M, Migonney V. Vitronectin is significant in the adhesion of lens epithelial cells to PMMA polymers. J Biomed Mater Res A. 2004;69:469–476. doi: 10.1002/jbm.a.30017. [DOI] [PubMed] [Google Scholar]
- 45.Hubbell JA. Materials as morphogenetic guides in tissue engineering. Curr Opin Biotech. 2003;14:551–558. doi: 10.1016/j.copbio.2003.09.004. [DOI] [PubMed] [Google Scholar]
- 46.Van der Valk P, Van Pelt AWJ, Busscher HJ, de Jong HP, Wildevuur CRH, Arends J. Interaction of fibroblasts and polymer surfaces: relationship between surface free energy and fibroblast spreading. J Biomed Mater Res. 1983;17:807–817. doi: 10.1002/jbm.820170508. [DOI] [PubMed] [Google Scholar]
- 47.Latz C, Pavon-Djavid G, Hélary G, Evans MDM, Migonney V. Alternative intracellular signaling mechanism involved in the inhibitory biological response of functionalized PMMA-based polymers. Biomacromolecules. 2003;4:766–771. doi: 10.1021/bm025764g. [DOI] [PubMed] [Google Scholar]
- 48.Underwood PA, Steele JG, Dalton BA. Effects of polystyrene surface-chemistry on the biological activity of solid-phase fibronectin and vitronectin, analyzed with monoclonal antibodies. J Cell Sci. 1993;104:793. doi: 10.1242/jcs.104.3.793. [DOI] [PubMed] [Google Scholar]
- 49.DeMali KA, Barlow CA, Burridge K. Recruitment of the Arp2/3 Complex to Vinculin: coupling membrane protrusion to matrix adhesion. J Cell Biol. 2002;159:881–891. doi: 10.1083/jcb.200206043. [DOI] [PMC free article] [PubMed] [Google Scholar]