Abstract
The nervous system is a biological computer integrating the body's reflex and voluntary environmental interactions (behavior) with a relatively constant internal state (homeostasis)—promoting survival of the individual and species. The wiring diagram of the nervous system's structural connectivity provides an obligatory foundational model for understanding functional localization at molecular, cellular, systems, and behavioral organization levels. This paper provides a high-level, downwardly extendible, conceptual framework—like a compass and map—for describing and exploring in neuroinformatics systems (such as our Brain Architecture Knowledge Management System) the structural architecture of the nervous system's basic wiring diagram. For this, the Foundational Model of Connectivity's universe of discourse is the structural architecture of nervous system connectivity in all animals at all resolutions, and the model includes two key elements—a set of basic principles and an internally consistent set of concepts (defined vocabulary of standard terms)—arranged in an explicitly defined schema (set of relationships between concepts) allowing automatic inferences. In addition, rules and procedures for creating and modifying the foundational model are considered. Controlled vocabularies with broad community support typically are managed by standing committees of experts that create and refine boundary conditions, and a set of rules that are available on the Web.
Keywords: brain, connections, databases, neuron
“There is no set of organs, in the formation of which, we find so perfect a gradation from the simple to the compound, as in the…nervous system; in fact, this system is established on a uniform plan in the whole animal scale.” Friedrich Tiedemann (1).
A systems analysis axiom is that “once we see the relationship between structure and behavior, we can begin to understand how systems work” (2). The basic importance of accurate structural accounts in biology has been appreciated since classical antiquity, with the best 20th-century example being Watson and Crick's (3) double-helix structural model of DNA. Fifty years and three billion dollars later, the linear sequence of human DNA's three billion base pairs was determined with the help of the Human Genome Project. This historic achievement provided the structural blueprint of heredity, of life itself. It also highlighted the importance of accurate structural models—two months before Watson and Crick, Pauling and Corey (4) published a triple-helix model of DNA that alone would have led molecular biology far astray.
Human Genome Project success implied that a comprehensive account of structural connections forming brain circuitry—a connectome of the organ of thought and feeling—would be the next great biological milestone (5–8). This vision assumes that brain circuitry structural architecture provides a necessary foundational model to understand functional localization at molecular, cellular, systems, and behavioral organization levels. A Human Connectome Project goal might be framed as providing the detailed structural data needed to create a foundational nervous system structural model analogous to the DNA double-helix structural model.
Neuroinformatics offers powerful new tools to store, share, mine, analyze, and model data about neural connectivity including the human brain—by far the most complex system known. Databases and inference engines for automatic reasoning in neuroinformatics workbenches require an integrated conceptual framework: (i) a defined universe of discourse (concept domain), (ii) sets of basic principles and internally consistent defined standard terms (concepts—a defined vocabulary), and (iii) a network of defined relationships between concepts often generating a hierarchical schema (9, 10). It has been stressed that anatomy (structure) provides a foundational model, or internally consistent set of conceptual representations, for organizing all other biomedical information (11).
Here we provide an integrated conceptual framework to describe the structural architecture of the nervous system's basic wiring diagram at levels able to incorporate the most sophisticated current basic research—from ultrastructure to MRI. No widely accepted model of global nervous system organization currently exists. Lacking a broad theoretical foundation, contemporary systems neuroscience remains at a pre-Watson–Crick stage of maturity.
Universe of Discourse
The Foundational Model of Connectivity (FMC) scope is the structural architecture of nervous system connectivity in all animals at all resolutions. Two key long-term goals are obvious: Get complete structure–function data about the nervous system wiring diagram in multiple species, and formulate models of the wiring diagrams and basic plans of these species and of higher taxa such as mammals and vertebrates (12). The FMC serves both experimental and theoretical neuroscience. An analogy is Vesalius's (13) detailed structural account of the human arterial system, venous system, and heart, followed by Harvey's (14) new structure–function hypothesis and experimental demonstration of the mammalian circulatory system—the classic life sciences example of the scientific method: observation and description, hypothesis, experiment, and generalization or modeling (15).
Systematic models of global nervous system organization and function have a long and complex history (16, 17) reflected in the defined vocabularies (SI Text). But few neuroanatomists have attempted novel comprehensive structural models of nervous system circuitry—with the goal of elucidating the basic wiring diagram in terms of its cellular organization—and none have been widely accepted in today's reductionist-oriented neuroscience. The Institute of Medicine recognized this void in the late 1980s and issued a report, Mapping the Brain and Its Functions: Integrating Enabling Technologies into Neuroscience Research (18). A top priority now would be called a “connectome project” for humans and other mammals, and a key recommendation led to the Human Brain Project (19, 20), which spawned neuroinformatics, and then morphed into actual connectome projects for humans and other species. The term “connectome” was invented to describe a connection matrix of the human brain—a comprehensive table showing which elements structurally connect to which elements (6). The term caught on immediately because of its association with the familiar “genome” concept. A connection table is a systematic and convenient way to simplify data about neural networks for databases, but is only one, very abstract way to understand neural networks (see below).
An important consequence of 2,500 y of research is that basic assumptions about the structural organization of nervous system circuitry—and the nomenclature used to describe it—are very complex and inconsistent. So on one hand there is currently no widely accepted set of principles, defined terms, and relationships for basic research on structural neural circuitry, and on the other hand the databases, controlled vocabularies, and inference engines of neuroinformatics workbenches require them.
FMC General Principles
The first two statements about describing structural neural connectivity architecture in all animals are axioms, the next three general assumptions, and the rest domain-specific assumptions (9, 21).
i. Any point in space is associated with only one structural object, at the lowest level of a hierarchical arrangement of parts. This axiom is basic for PART-OF relations (Fig. S1).
ii. All cell and neuron types have progenitors, and are thus linked to phylogeny and ontogeny.
iii. Systematic attempts to produce internally consistent classifications and taxonomies require theoretical frameworks for deciding between alternatives (22).
iv. Alternate classification and taxonomy schemes are always possible and must be accommodated (22). In comparing two schemes, the terms, concepts, and principles of one must be mapped rigorously onto the other. With multiple schemes the number (N) of term definitions required is lowest when one scheme is adopted as standard. Then N is proportional to the number of standard nomenclature terms, whereas with no standard nomenclature the number of definitions is proportional to N2 (23). Neuroinformatics applications should thus adopt a standard terminology and allow for documented alternates.
v. The FMC is based on evidence, not authority. All components are justified by reference to the best observational or experimental evidence from the literature, combined with reference to priority when possible, not by undocumented statements from textbooks, the Web, or elsewhere—the difference between empirical observation and a priori statements. The FMC is thus based on evolving evidence and concepts, revisions are based on enforced rules, and versioning is systematic and historical.
vi. The nervous system is a system of the body as a whole. For vertebrates, other examples include circulatory, endocrine, digestive, and skeletomotor (24, 25).
vii. Not all animals have a nervous system; it is not present in Poriphera, but is from Cnideria to vertebrates (26).
viii. The universal structure–function unit of all nervous systems is the neuron, with the same core structure, function, cell biology, and molecular biology in all animals (26).
ix. Neurons are arranged to form clearly different, genetically determined neural network architectures characteristic of each animal taxon (26, 27). The basic units (neurons) are similar in all nervous systems; what distinguishes nervous system architecture in different species is the stereotypical, genetically determined arrangement of those units.
x. Nervous systems may also include glial, vascular, and connective tissue cellular elements influencing neural network function secondarily. As in animal tissues generally, all nervous system cells are bathed in extracellular fluid (25).
Introduction to Defined Vocabulary
Effective scientific communication axiomatically requires a clearly defined, accurate, internally consistent vocabulary consistently applied. Unfortunately, structural neuroscience terminology is woefully inadequate because there is (i) a vast, complex, internally inconsistent literature that is historically based and growing exponentially, (ii) insufficient evidence to resolve conflicting interpretations, and (iii) no widely accepted theoretical framework for data interpretation (28–31).
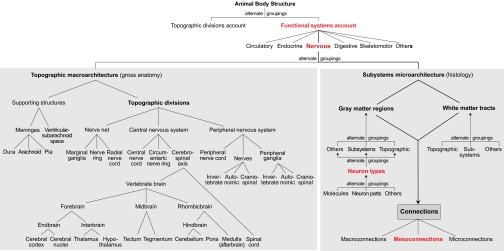
In creating an FMC defined vocabulary, dealing with true synonyms (identical definitions) is relatively trivial and choosing a standard term from a list of synonyms is solved (10). A more serious and pervasive problem is internal inconsistency—partly corresponding (Fig. S1) or completely different meanings for the same term in the same or different sources. These considerations have two basic consequences. First, FMC creation requires picking one standard term for each model component, and each term needs a clear, unambiguous definition. These defined standard terms are concepts, grouped in explicitly defined classes with defined relations (10, 21). The FMC schema (Fig. 1) evolved from our atlas nomenclature tables (32, 33) and Brain Architecture Knowledge Management System (BAMS) (5, 30, 31). The second consequence is that accurate and reliable curation of literature data to FMC data requires defining terminology in each literature source and relating it directly to FMC reference terminology. This is not trivial. For example, there are eight formal topological relations between a pair of 2D objects such as a gray matter region with the same name in two different atlas plates (34, 35).
Fig. 1.
General FMC schema. The nervous system of all animals is described in two complementary, alternate ways: topographic macroarchitecture (gross anatomy) and subsystems microarchitecture (histology). All schema concepts are defined in a controlled vocabulary (see thesaurus in SI Text). Structural connectivity is described primarily in terms of regions (including neuron types, parts, and molecules) and tracts, with the mesoconnectional level (based on neuron types) being most informative.
Next, we present a concept set for describing nervous system positional information accurately and unambiguously. Then, defined vocabularies for describing nervous system structural objects are considered in the FMC schema context, and a thesaurus of terms is provided (SI Text).
Symmetry and Positional Information
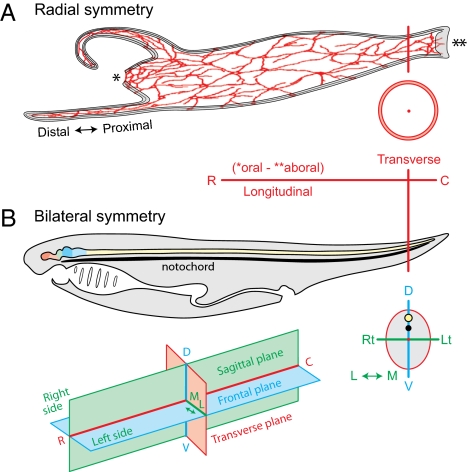
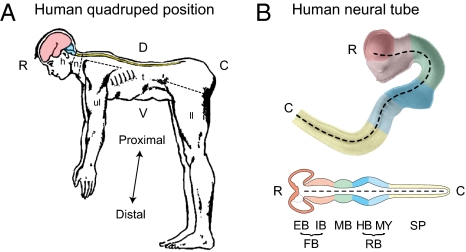
The FMC is comparative and uses a system of positional information descriptors as general, clear, and simple as possible (Fig. 2). All metazoan body plans have a basic longitudinal symmetry axis with oral and aboral ends (36), and if present a nervous system with either radial or bilateral symmetry on this axis (26). In animals with perfect radial symmetry (Fig. 2A) the body has two orthogonal axes, rostrocaudal (oral–aboral, longitudinal) and transverse, and two orthogonal planes of section, longitudinal (dividing the body into similar halves) and transverse (37). In animals with bilateral symmetry the body has three orthogonal axes (rostrocaudal, dorsoventral, mediolateral; Fig. 2B) and three orthogonal planes (frontal, sagittal, transverse). A general terminology based on vertebrates but applicable to invertebrates is adopted (Fig. 2). This simple universal scheme uses morphological principles related to fundamental body plan topology, not actual individual geometry (12, 24, 37, 38). The main feature during development (39) and in adults is the longitudinal axis's irregular changing course that varies by species and even an individual's changing posture (Fig. 3).
Fig. 2.
General description of symmetry and positional information. (A) Nerve net (red) in animal (hydra) with radial symmetry, and two orthogonal axes (rostrocaudal, oral–aboral, or longitudinal; transverse) and planes of section (longitudinal, transverse). The relative position along tentacles is indicated. (B) Bilaterally symmetrical animals have three cardinal axes and three orthogonal planes of section, shown for an idealized chordate body plan with central nervous system dorsal to notochord and digestive system ventral to it. CNS topographic divisions are color-coded to match Fig. 3B. C, caudal; D, dorsal; L, lateral; Lt, left; M, medial; R, rostral; Rt, right; V, ventral. B (Top) is adapted from figure 1 in ref. 24. [Reprinted from The Vertebrae Body, A.S. Romer, page 3, Copyright (1962).]
Fig. 3.
Metazoan conceptual longitudinal axis is quite variable in embryos and adults. (A) Adult human in comparative anatomical position for easy comparison with other vertebrates (Fig. 2B) and application of the same positional descriptors. Also note the difference between topographic and systems body descriptions (Fig. 1). The former includes head (h), neck (n), trunk (t), upper limb (ul), and lower limb (ll) divisions; an example of the latter is the CNS (color-coded as in B and Fig. 2B) extending across body divisions. [Reprinted from Basic Neurology, J.P. Schade & D.H. Ford, page 15, Copyright (1965).] (B) Neural tube of a 4-wk-old human embryo (dashed line is longitudinal–rostrocaudal axis). The top is the right half of the neural tube with topographic divisions (Fig. 1 Left) color-coded to match a conceptualized straightened neural tube (bottom half) in frontal section (Fig. 2B). C, caudal; D, dorsal; EB, endbrain; FB, forebrain; HB, hindbrain; IB, interbrain; MB, midbrain; MY, medulla (afterbrain); R, rostral; RB, rhombicbrain; SP, spinal cord; V, ventral. A is adapted with permission from ref. 40; the photo in B is adapted from ref. 41.
Other terms describing position are distal or proximal (Figs. 2A and 3A); inner (internal) and outer (external), referring to the distance from the center of a part; and superficial and deep, describing relationships between adjacent parts. In bilateria, ipsilateral refers to the same side of the body, bilateral to both sides, and contralateral to the opposite side; the median plane is the midsagittal plane dividing the body into right and left halves. Also important to consider are sex and age, beginning with neural plate formation.
FMC Schema: Complementary Architecture Descriptions
Atop the FMC schema (Fig. 1) are two traditional, complementary, and alternate ways to describe biological structure—topographic and systemic (42). One has divisions such as head and neck (hierarchical PART-OF relations; Fig. S1); the other lists circulatory, nervous, and other systems (IS-A relations to systems description; Figs. 2B and 3A). They are equally valid and useful dissection methods but serve quite different expository needs; for example, the arm is an important body part, but as a topographic division is formed by limited components of the various systems.
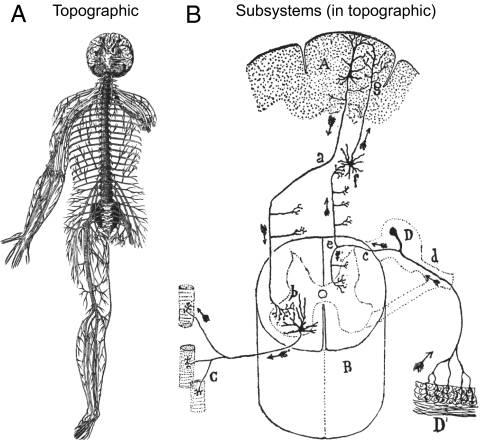
The nervous system itself is also described topographically and systemically. For example, midbrain, pons, medulla, and spinal cord (topographic divisions) together contain the somatic motoneuron pools generating the motor subsystem's total output controlling vertebrate behavior. Distinguishing these two unique descriptions of nervous system structural organization is commonly ignored, leading to interchangeable use in arbitrary and confusing ways. The FMC strictly separates concepts for the two architectures. Topographic macroarchitecture covers nervous system gross anatomy and subsystems microarchitecture covers the cellular, histological organization of neural circuitry (26) (Figs. 1 and 4). For describing experimental results the complementary concept of sites is key (Figs. S1 and S2).
Fig. 4.
Comparing vertebrate nervous system topographic macroarchitecture and subsystems microarchitecture (Fig. 1). (A) Magnificent Vesalius drawing (13) shows the adult human nervous system dissected free from the body. Note the CNS location down the median plane with the spinal column intact around the spinal cord to strengthen the preparation. The CNS is basically in the position of Fig. 3A—with the brain rotated back to show its base. The PNS shows spinal nerves to limbs and trunk, which outline the body, and stubs of cranial nerves cut after leaving the brain base. For clarity, he placed autonomic nerves in a separate figure. (B) Seminal Cajal drawing (43) shows elementary network model of nervous system organization based on neuron doctrine and the functional polarity hypothesis. The former stated that the basic unit of nervous system organization is the neuron, a cell type usually interacting with other cells by contact or contiguity, not continuity; the latter stated that in typical neurons, information conducts from dendrites and the cell body (input side) to the axon (output side). This basic hypothesis allowed information flow prediction (arrows) in neural networks based on individual neuron shape. A, cerebral cortex; a, pyramidal cell > motoneuron axon; B, spinal cord; b, motoneuron; C, motoneuron axon branches > muscle fibers; c, spinal nerve ganglion cell axon; D, spinal nerve ganglion; D′, skin; d, spinal nerve ganglion cell dendrite; e, sensory axon bifurcation branch; f, somatosensory brainstem relay; g, brainstem somatosensory > cortex axon terminals.
Topographic Macroarchitecture: Divisions
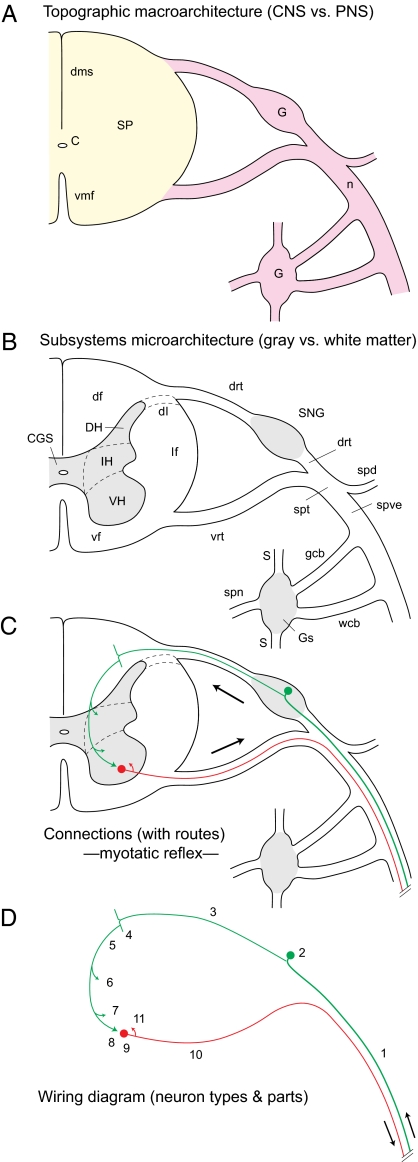
The nervous system's topographic macroarchitecture includes supporting structures and topographic divisions (Fig. 1 and Fig. S3; PART-OF hierarchical relations). Topographic divisions describe neural circuitry's general location and are macroscopic objects formed by cutting (dividing)—for example, the central nervous system (CNS) from the peripheral nervous system (PNS; Fig. 5A). Invertebrate terminology is mostly adapted from ref. 26; see thesaurus (SI Text). Vertebrate topographic divisions contain gray matter, white matter, blood vessels, and often parts of the meninges and ventricular–subarachnoid space. There is fair agreement on the CNS scheme, based on countless adult dissections over the last 2,500 y and basic neural tube divisions (29). The bottom of the hierarchy has 10 elemental divisions (Fig. 1 Bottom Left); their parceling becomes increasingly controversial and is not dealt with. The 10 elemental divisions are useful for combining to name larger topographic units, such as brainstem, whose meaning depends on division inclusion (29). Lower levels can be added to any hierarchy branch if desired. The basic topographic macroarchitecture scheme is adapted from table A in ref. 33.
Fig. 5.
Deconstruction of vertebrate topographic macroarchitecture and subsystems microarchitecture organization (Fig. 4B). (A) Gross anatomy level distinguishes CNS (yellow) and PNS (pink) divisions with spinal cord (SP), and nerves (n) and ganglia (G), respectively. (B) Histology level distinguishes regions (gray) and tracts (white). (C) Connection level describes cell-level synaptic interactions between different regions (macroconnections), neuron types (mesoconnections), or individual neurons (microconnections, here), including route information. The simplest mammalian spinal reflex (monosynaptic myotatic) is illustrated; arrows indicate information flow. (D) Wiring diagram level shows connections at abstract level of neuron types and parts, and routes. Connectomes and basic plans are further abstractions. C, central canal; CGS, spinal central gray; df, dorsal funiculus; dh, dorsal horn; dl, dorsolateral fascicle; dms, dorsal median septum; drt, dorsal root; G, ganglion; gcb, gray communicating branch; Gs, sympathetic ganglion; IH, intermediate horn; lf, lateral funiculus; n, nerve; S, sympathetic trunk; SNG, spinal nerve ganglion; SP, spinal cord; spd, spinal nerve dorsal branch; spn, splanchnic nerve; spt, spinal nerve trunk; spve, spinal nerve ventral branch; vf, ventral funiculus; VH, ventral horn; vmf, ventral median fissure; vrt, ventral root; wcb, white communicating branch. 1, dendrite of 2; 2, pseudopolar spinal nerve ganglion cell body (green); 3, axon of 2; 4, bifurcation branch of 3; 5, axon collateral of 4; 6, collateral of 5 to dorsal nucleus; 7, collateral of 5 to VH inhibitory interneurons; 8, axon terminals of 5 on 9; 9, α-motoneuron innervating extensor muscle (red); 10, axon of 9; 11, local axon collateral of 10.
Subsystems Microarchitecture
For 500 y, the nervous system has been divided ever more precisely into gray matter and white matter, with naked-eye observations supplemented for the last 200 y by histological–microarchitectural analyses (Fig. 5B) (16). Gray matter is the compartment with neuron cell bodies, neuron extensions (axons, dendrites, amacrine), synapses between extensions, glia, and blood vessels. Neuropil is the gray matter compartment without cell bodies and blood vessels (44).
White matter is a generic term for nervous system volumes where axons predominate, along with glia and blood vessels. In the white matter compartment, named for the whitish macroscopic appearance of myelin, axons dominate, although white matter is often a mixture of myelinated and unmyelinated axons, and axon aggregates can be unmyelinated. White matter may have scattered neurons assigned to adjacent gray matter regions or to a region embedded in the white matter; assignment depends on the neuron types involved (25, 44, 45).
Gray Matter Regions
Subsystems microarchitecture concerns microscopic differentiation of gray matter regions and white matter tracts—and how their differentiations combine for macro-, meso-, and microconnections (Fig. 1 Right). A region is a structurally recognizable gray matter volume with a unique set of neuron types in a unique spatial distribution. The entire gray matter is regionalized and individual regions may contain white matter, with axons of passage. Regionalization is classically viewed in Nissl-stained sections interpreted with methods identifying neuron types and their spatial distribution (33, 45). Region examples are retina, dorsal lateral geniculate nucleus, striate area, zona incerta, substantia nigra, locus ceruleus, and celiac ganglion.
Region sets are arranged differently: strictly topographically or by functional subsystems. The former uses hierarchical groupings from particular topographic division schemes. A systematic example based on the 10 elemental CNS divisions (Fig. 1 Bottom Left) in adult rat is available (table B in ref. 32), but alternate schemes are possible. Subsystems groupings are basically network groupings of regions based on functional criteria. A systematic example using a four-subsystem network model of rat CNS organization is available (table B in ref. 33) and again alternate schemes are possible, as are schemes neither topographic nor subsystems.
Neuron Types
Regions are defined by a unique neuron type set, so neuron types (and neuron parts that help distinguish types) also need defining. This problem is key for describing nervous system structural connectivity, and its solution is contentious. According to one approach (46), multiple valid nonisomorphic ways to classify neurons exist. Neurons may be classified by neurotransmitter, that is, glutamatergic, GABAergic, or cholinergic—a valuable approach in pharmacology with its agonists and antagonists. But glutamatergic neurons are connectionally very heterogeneous, for example, cerebral pyramidal and cerebellar granule cells. Neurons are also classified by gene expression pattern, valuable for genetic engineering applications. With >4,000 single-gene patterns available for mouse brain (47), combinatorial patterns make a vast number of gene expression neuron types possible, most with probable connectional heterogeneity. In fact, it has been suggested that there may be no strict correlation between gene expression patterns and classical neuronal functional subsystems (48).
Neuron types are also classified by connections supplemented with location, and shape—the classic Golgi–Cajal approach (49). This is how cerebral pyramidal cells, spinal nerve ganglion cells, and α-motoneurons were identified and characterized (Figs. 4B and 5C). Simple invertebrate nervous systems may be formed by sets of individually identified neurons each with a unique combination of connections, location, and shape—each a neuron type. For vertebrates, identified neurons are usually replaced by neuron populations with unique combinations of connections, location, shape, and other factors (neuron types). Thus, a region contains a unique neuron type set, each type a population.
To establish the nervous system's wiring diagram, then, neuron type is defined primarily by its stereotyped connections (and secondarily by location, size, expressed molecules, etc.), and a region is defined by a unique neuron type set. Neurons can be arranged in a seven-level taxonomic hierarchy with neuron as a cell type on top and neuron varieties on the bottom (figure 3 in ref. 46).
Neuron Parts and Molecules
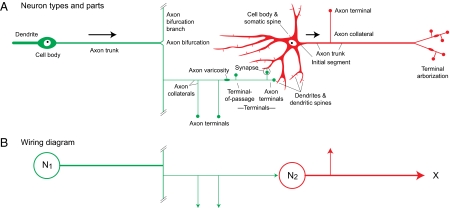
Only basic cellular and molecular (50) neuron features used to define structural connectivity are relevant for the FMC (Fig. 1 Right; Figs. 5D and 6A). Critical for structural connectivity is the synapse, a structure–function interaction between a neuron and another cell (neuron or effector). Major features of synapses (electrical, chemical, unidirectional, bidirectional, spines) are considered in the thesaurus (SI Text). In normally functioning neural networks, impulses initiated by inputs to dendrites and cell bodies propagate down axons to their terminals; for example, action potentials normally do not propagate from muscle to motoneurons, then from motoneurons to periphery via sensory neurons (Figs. 4B, 5C, and 6A). However, there are reciprocal chemical synapses that release neurotransmitters on both sides of the synaptic cleft and are typically associated with amacrine extensions conducting impulses bidirectionally in a neural network. Thus, neurons have three cytoplasmic extension types: axons conducting information to their terminals, dendrites conducting information to axons, and amacrine extensions conducting information to or away from the cell body depending on network functional activity (Fig. S4). Vertebrate neurons with amacrine extensions are found in retina, olfactory bulb, and intestine; for invertebrates they are common in nerve nets.
Fig. 6.
Key neuron parts to describe connections with an example of monosynaptic sensory-motor reflex (Fig. 5). (A) Bipolar sensory neuron (green) and multipolar motoneuron (red) parts shown with information flow direction indicated (arrows). Fig. S4 has other configurations. See thesaurus (SI Text) for part definitions. (B) Wiring diagram schematizing connections in A. Two nodes (N1, N2) are shown and could represent regions (macroconnections), neuron types (mesoconnections), or individual neurons, as in A (microconnections).
White Matter Tracts
Nervous system white matter tracts (Fig. 1 Right) are structurally recognizable white matter volumes bordered by gray matter, another white matter tract(s), or nonneural tissue. Borders between white matter tracts are determined by structural landmarks and are commonly arbitrary. They are homogeneous or heterogeneous. A homogeneous tract has one specific connection, whereas a heterogeneous tract has two or more connections. The standard way to view vertebrate tracts is with myelin and reduced silver stains (51). Examples in mammals are corpus callosum, internal capsule, fornix, perforant path, anterior commissure, optic tract, medial forebrain bundle, brachium of superior colliculus, superior cerebellar peduncle, fasciculus retroflexus, pyramidal decussation, dorsal columns, lateral funiculus, ventral root, and sciatic nerve. Tract sets can be arranged variously: strictly topographically, by functional subsystems (table C in ref. 33), or otherwise.
Connections with Routes
An initial overview is useful. A connection is the overall structural link between two nodes in a nervous system wiring diagram, or a node and an effector (such as muscle or gland; Figs. 6 and 7). Nodes are described at three increasing levels of resolution and accuracy. For macroconnections the two nodes are regions; for mesoconnections, neuron types; for microconnections, individual neurons. A node establishes one or more connections and their route is the physical course of axons through regions and tracts. Axon connections are unidirectional and amacrine connections are bidirectional. Information about a connection set is arranged variously as a wiring diagram, connectome, or basic plan.
Fig. 7.
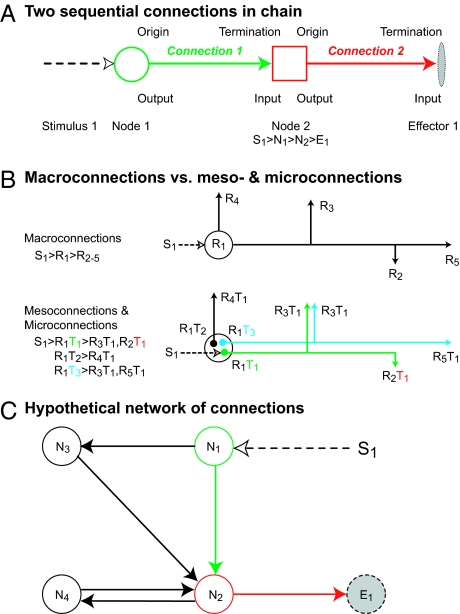
Concepts for describing connections. (A) Basic terms for describing axonal connections. (B) Difference between macroconnections, where regions (R) are black boxes, and meso- and microconnections, where specific connections are made between neuron types (T) and individual neurons, respectively, within regions. A simple self-evident notation for describing relationships in A and B is given. (C) A hypothetical network of four nodes (N1–4), a stimulus (S1), and an effector (E1); note closed chain (circuit) between N2 and N4.
Systematic connection description requires care, because it involves combinations of terms associated with regions (with neuron types, neurons, neuron parts) and tracts (Fig. 1 Right) in a broader context of topographic macroarchitecture (Fig. 1 Left; Figs. 4B and 5). To clarify understanding, analysis, and description, begin with a connection between two nodes (N1,2; Fig. 6B) in a myotatic reflex. This connection is interpreted at three successively higher-resolution analysis levels: macroconnectional, mesoconnectional, and microconnectional (52). For macroconnections, regions are black boxes (Fig. 6B; e.g., spinal nerve ganglion > ventral horn), mesoconnections are between two neuron types (Fig. 6B; e.g., Ia spinal nerve ganglion cells > α-motoneuron pool), and microconnections are between two neurons (Figs. 5C and 6A). In normal animals, macro- and mesoconnections form a genetically determined, hardwired architecture unique for each species, whereas microconnections may vary with experience.
A node thus represents a region, neuron type, or neuron, and establishes one or more connections (Fig. 6B). The next step in describing a wiring diagram is to specify connection relations for node pairs. Fig. 7A, for example, shows a stimulus to node 1 and a connection from node 2 to an effector (Figs. 4B and 5C). For connection 1, node 1 connects to node 2 (output of node 1 is input to node 2) and node 2’s output is an input to nonneuronal effector 1 (e.g., skeletal muscle). In acceptable shorthand, node 2 receives an input from node 1 and has an output to effector 1—or node 2 is the origin of a connection with a termination in node 3. Again, these terms apply to axonal connections that by definition are polarized, FROM-TO relations. For amacrine extensions the relation is bidirectional with appropriately modified terminology (Fig. S4A).
The basic difference between macroconnectional description and the preferable meso- and microconnectional descriptions is that the latter describe neuron types in a region. These types form unique connections, and describe intraregional and internodal connections (Fig. 7B).
A connection's route is described by the regions, tracts, and topographic divisions occupied by the output and input nodes (Fig. 5). The vast majority of connections are formed in gray matter; connections in white matter tracts are unusual.
The basic motif of two links in a chain of connections (Fig. 7A) in principle may be extended indefinitely to the network level of nervous system architecture (Fig. 7C), at various analysis levels.
A clear distinction between connection and pathway is important for describing the results of experimental network analysis (Fig. S2).
Analysis Levels
Historically and conceptually, neural connection accounts divide into four classes with decreasing information. First is physical macroscopic and microscopic dissection at macro-, meso-, or microconnectional resolutions (see above). The second class includes verbal and textual dissection descriptions. The third is connection diagrams. These range from realistic 3D to conceptual schemes but subdivide into wiring diagrams reflecting the physical arrangement of connections with route information, and basic plans (bauplans) or high-level conceptual schemes with elementary features. The fourth class has tables of connections between nodes. Simple 2D connectomes conveniently store basic connectional information (53) but lack key features such as branching patterns to multiple terminal fields, routes, and physical distances.
Modifying the FMC
To describe connections, researchers often use any desired combination of nomenclatures, even new ones without definitions or relations to earlier terms. The opposite applies to animal classification, where authors cannot freely choose a species technical name and new species naming is tightly regulated. The British Association adopted in 1843 a formal animal-naming system. Its enduring influence rested on three principles: (i) establish a uniform, permanent, international language among naturalists, (ii) claim no mandatory authority or forceful sanctions, and (iii) explain each article of the document. National and international committees with a stated mission to ensure one unique universally accepted name for every animal have continually updated the document (54), a book of principles and practices (55). Organized attempts to standardize human topographic anatomy date from 1895 and the German Anatomical Society's Nomina Anatomica (56). Its goals were to (i) be produced by an expert committee and of limited scope (human topographic anatomy), (ii) use one language, and (iii) elaborate name assignment rules. It has been revised or resuscitated at least six times by international committees (57), although its CNS part is hardly used by experimental neuroanatomists.
An internally consistent FMC in neuroinformatics applications is incompatible with uncontrolled nomenclature use. Conceptual frameworks with controlled vocabularies and broad community support in other major domains such as books, geography, and astronomy are managed by expert standing committees that formulate statements, concepts, and online sets of principles and practices. Minimally, principles and practices for modifying existing FMC assumptions, concepts, and terms—and for adding new ones—must be created to assure the conceptual framework remains internally consistent and useful (see SI Text for guidelines).
Discussion
The results presented here represent a high-level, integrated framework to describe in English the architecture of nervous system structural connections in all animals at all resolutions. FMC 1.0 design is internally consistent, with defined concepts for use in neuroinformatics systems, and lower schema levels are readily extendible for more detailed descriptions and for alternate arrangements and interpretations of term sets for regions, neuron types, and so on. Because the FMC deals with a highly specialized domain, its principles and concepts are necessarily specialized and sometimes narrowly defined. But it is designed to complement and extend the National Library of Medicine's Unified Medical Language System (58); Foundational Model of Anatomy (10, 59), a pioneering domain ontology representing a coherent body of explicit declarative knowledge about human anatomy applicable to other species; and Neuroscience Information Framework (60) with its NeuroLex. The FMC is fully compatible with BAMS (30, 31, 35), a neuroinformatics workbench to store, mine, and model structural connectivity information with five modules—parts, with divisions, regions, and tracts (5), cell types, including neurons and neuron parts (46), molecules (50), connections (53), and relations (30).
Neuroanatomical nomenclature is conservative and historically based, with foundations easily traced back to classical antiquity. In contrast, Linnaeus revolutionized species nomenclature in 1735 with his binomial nomenclature—only a specific and a general word for each species. It was paradigm-shifting because species names changed from descriptions to merely concept labels pointing to complete accounts in a list and staying constant if definitions and descriptions change; in essence, names themselves become insignificant (54). Neuroanatomical terms remain descriptive and based largely on historical accident and whim. It may be time to plan a new, streamlined neuroanatomical nomenclature, easily implemented online with older nomenclature comparisons. Three obvious problems need attention. First, terms should be labels rather than descriptions. Second, a uniform positional information scheme should be adopted (Fig. 2; e.g., superior colliculus to rostral colliculus). And third, the framework should be based on comparative embryology, following Darwin's second revolution in biological taxonomy—the concept that descent with modification is the natural organizing principle for establishing homologies (22).
Supplementary Material
Acknowledgments
We thank Arshad Khan, Richard H. Thompson, Gully Burns, and Alan Watts for seminal discussions. Supported by National Institutes of Health Grant NS050792.
Footnotes
The authors declare no conflict of interest.
This article contains supporting information online at www.pnas.org/lookup/suppl/doi:10.1073/pnas.1015128107/-/DCSupplemental.
References
- 1.Tiedemann F. Anatomy of the Foetal Brain. Edinburgh: Carfrae; 1826. p. 2. [Google Scholar]
- 2.Meadows DM. Thinking in Systems. White River Junction, VT: Chelsea Green; 2008. p. 1. [Google Scholar]
- 3.Watson JD, Crick FHC. Molecular structure of nucleic acids: A structure for deoxyribose nucleic acid. Nature. 1953;171:737–738. doi: 10.1038/171737a0. [DOI] [PubMed] [Google Scholar]
- 4.Pauling L, Corey RB. A proposed structure for the nucleic acids. Proc Natl Acad Sci USA. 1953;39:84–97. doi: 10.1073/pnas.39.2.84. [DOI] [PMC free article] [PubMed] [Google Scholar]
- 5.Bota M, Dong H-W, Swanson LW. From gene networks to brain networks. Nat Neurosci. 2003;6:795–799. doi: 10.1038/nn1096. [DOI] [PubMed] [Google Scholar]
- 6.Sporns O, Tononi G, Kötter R. The human connectome: A structural description of the human brain. PLoS Comput Biol. 2005;1:e42. doi: 10.1371/journal.pcbi.0010042. [DOI] [PMC free article] [PubMed] [Google Scholar]
- 7.Lichtman JW, Sanes JR. Ome sweet ome: What can the genome tell us about the connectome? Curr Opin Neurobiol. 2008;18:346–353. doi: 10.1016/j.conb.2008.08.010. [DOI] [PMC free article] [PubMed] [Google Scholar]
- 8.Bohland JW, et al. A proposal for a coordinated effort for the determination of brainwide neuroanatomical connectivity in model organisms at a mesoscopic scale. PLoS Comput Biol. 2009;5:e1000334. doi: 10.1371/journal.pcbi.1000334. [DOI] [PMC free article] [PubMed] [Google Scholar]
- 9.Gruber TM. Toward principles for the design of ontologies used for knowledge sharing. Int J Hum Comput Stud. 1995;43:907–928. [Google Scholar]
- 10.Martin RF, Mejino JLV, Jr, Bowden DM, Brinkley JF, III, Rosse C. Foundational model of neuroanatomy: Implications for the Human Brain Project. Proc AMIA Symp. 2001;2001:438–442. [PMC free article] [PubMed] [Google Scholar]
- 11.Brinkley JF. Structural informatics and its applications in medicine and biology. Acad Med. 1991;66:589–591. doi: 10.1097/00001888-199110000-00005. [DOI] [PubMed] [Google Scholar]
- 12.Kuhlenbeck H. The Central Nervous System of Vertebrates. Basel: Karger; 1967–1978. 5 vols. [Google Scholar]
- 13.Vesalius A. De Humani Corporis Fabrica Libri Septum. Basel: Oporinus; 1543. [Google Scholar]
- 14.Harvey W. Exercitatio Anatomica de Motu Cordis et Sanguinis in Animalibus. Frankfurt-am-Main: Fitzeri; 1628. [PubMed] [Google Scholar]
- 15.Singer C. The Discovery of the Circulation of the Blood. London: Dawson; 1956. [Google Scholar]
- 16.Clarke E, O'Malley CD. The Human Brain and Spinal Cord. 2nd Ed. San Francisco: Norman; 1996. [Google Scholar]
- 17.Swanson LW. Quest for the basic plan of nervous system circuitry. Brain Res Brain Res Rev. 2007;55:356–372. doi: 10.1016/j.brainresrev.2006.12.006. [DOI] [PMC free article] [PubMed] [Google Scholar]
- 18.Pechura CM, Martin JB, editors. Mapping the Brain and Its Functions: Integrating Enabling Technologies into Neuroscience Research. Washington, DC: National Academy Press; 1991. [PubMed] [Google Scholar]
- 19.Koslow SH, Huerta MF, editors. Neuroinformatics. Mahwah, NJ: Erlbaum; 1997. [Google Scholar]
- 20.De Schutter E, Ascoli GA, Kennedy DN. On the future of the Human Brain Project. Neuroinformatics. 2006;4:129–130. doi: 10.1385/NI:4:2:129. [DOI] [PubMed] [Google Scholar]
- 21.Gómez-Pérez A, Fernández-López M, Corcho O. Ontological Engineering. London: Springer; 2004. [Google Scholar]
- 22.Simpson GG. Principles of Animal Taxonomy. New York: Columbia Univ Press; 1961. [Google Scholar]
- 23.Dashti AE, Ghandeharizadeh S, Stone J, Swanson LW, Thompson RH. Database challenges and solutions in neuroscientific applications. Neuroimage. 1997;5:97–115. doi: 10.1006/nimg.1996.0253. [DOI] [PubMed] [Google Scholar]
- 24.Romer A. The Vertebrate Body. 3rd Ed. Philadelphia: Saunders; 1962. [Google Scholar]
- 25.Standring S, editor. Gray's Anatomy. 40th Ed. Amsterdam: Elsevier; 2008. [Google Scholar]
- 26.Bullock TH, Horridge G. Structure and Function of the Nervous System of Invertebrates. San Francisco: Freeman; 1965. 2 vols. [Google Scholar]
- 27.Nieuwenhuys R, ten Donkelaar HJ, Nicholson C, editors. The Central Nervous System of Vertebrates. Berlin: Springer; 1998. 3 vols. [Google Scholar]
- 28.Anthoney TR. Neuroanatomy and the Neurologic Exam. Boca Raton, FL: CRC; 1994. [Google Scholar]
- 29.Swanson LW. What is the brain? Trends Neurosci. 2000;23:519–527. doi: 10.1016/s0166-2236(00)01639-8. [DOI] [PubMed] [Google Scholar]
- 30.Bota M, Swanson LW. BAMS neuroanatomical ontology: Design and implementation. Front Neuroinform. 2008;2:1–8. doi: 10.3389/neuro.11.002.2008. [DOI] [PMC free article] [PubMed] [Google Scholar]
- 31.Bota M, Swanson LW. Collating and curating neuroanatomical nomenclatures: Principles and use of the Brain Architecture Knowledge Management System (BAMS) Front Neuroinform. 2010;4:1–16. doi: 10.3389/fninf.2010.00003. [DOI] [PMC free article] [PubMed] [Google Scholar]
- 32.Swanson LW. Brain Maps. Amsterdam: Elsevier; 1992. [Google Scholar]
- 33.Swanson LW. Brain Maps. 3rd Ed. Amsterdam: Elsevier; 2004. [Google Scholar]
- 34.Egenhofer M, Franzosa R. Point-set topological spatial relations. Int J Geogr Inf Syst. 1991;5:161–174. [Google Scholar]
- 35.Bota M, Dong H-W, Swanson LW. Brain architecture management system. Neuroinformatics. 2005;3:15–48. doi: 10.1385/NI:3:1:015. [DOI] [PubMed] [Google Scholar]
- 36.Willmer P. Invertebrate Relationships. Cambridge, UK: Cambridge Univ Press; 1990. [Google Scholar]
- 37.Brusca RC, Brusca GJ. Invertebrates. Sunderland, MA: Sinauer; 1990. [Google Scholar]
- 38.Russell ES. Form and Function. London: Murray; 1916. [Google Scholar]
- 39.Alvarez-Bolado G, Swanson LW. Developmental Brain Maps. Amsterdam: Elsevier; 1996. fig 14. [Google Scholar]
- 40.Schadé JP, Ford DH. Basic Neurology. Amsterdam: Elsevier; 1965. [Google Scholar]
- 41.Hines M. Studies in the growth and differentiation of the telencephalon in man. J Comp Neurol. 1922;34:73–171. [Google Scholar]
- 42.Williams PL, editor. Gray's Anatomy. 38th Ed. New York: Churchill Livingstone; 1995. p. 15. [Google Scholar]
- 43.Cajal S. A new concept of the histology of neural centers. Rev Cienc Med. 1892;18:457–476. [Google Scholar]
- 44.Peters A, Palay SL, Webster HdeF. The Fine Structure of the Nervous System. 3rd Ed. New York: Oxford Univ Press; 1991. [Google Scholar]
- 45.Swanson LW. Brain Architecture. Oxford: Oxford Univ Press; 2003. [Google Scholar]
- 46.Bota M, Swanson LW. The neuron classification problem. Brain Res Brain Res Rev. 2007;56:79–88. doi: 10.1016/j.brainresrev.2007.05.005. [DOI] [PMC free article] [PubMed] [Google Scholar]
- 47.Ng L, et al. An anatomic gene expression atlas of the adult mouse brain. Nat Neurosci. 2009;12:356–362. doi: 10.1038/nn.2281. [DOI] [PubMed] [Google Scholar]
- 48.He X, et al. Expression of a large family of POU-domain regulatory genes in mammalian brain development. Nature. 1989;340:35–41. doi: 10.1038/340035a0. [DOI] [PubMed] [Google Scholar]
- 49.Shepherd GM. Foundations of the Neuron Doctrine. New York: Oxford Univ Press; 1991. [Google Scholar]
- 50.Bota M, Swanson LW. A new module for on-line manipulation and display of molecular information in the brain architecture management system. Neuroinformatics. 2006;4:275–298. doi: 10.1385/NI:4:4:275. [DOI] [PubMed] [Google Scholar]
- 51.Brodal A. Neurological Anatomy in Relation to Clinical Medicine. 3rd Ed. New York: Oxford Univ Press; 1981. p. 5. [Google Scholar]
- 52.Thompson RH, Swanson LW. Hypothesis-driven structural connectivity analysis supports network over hierarchical model of brain architecture. Proc Natl Acad Sci USA. 2010;107:15235–15239. doi: 10.1073/pnas.1009112107. [DOI] [PMC free article] [PubMed] [Google Scholar]
- 53.Bota M, Swanson LW. Online workbenches for neural network connections. J Comp Neurol. 2007;500:807–814. doi: 10.1002/cne.21209. [DOI] [PubMed] [Google Scholar]
- 54.Melville RV. Towards Stability in the Names of Animals. London: International Trust for Zoological Nomenclature; 1995. [Google Scholar]
- 55.International Commission on Zoological Nomenclature . International Code of Zoological Nomenclature. 4th Ed. London: International Trust for Zoological Nomenclature; 1999. [DOI] [PMC free article] [PubMed] [Google Scholar]
- 56.His W. Anatomical nomenclature. Nomina anatomica. Arch Anat Physiol Leipzig. Anat Abth. 1895;(Suppl):1–180. [Google Scholar]
- 57.Federative Committee on Anatomical Terminology . Terminologia Anatomica. Stuttgart: Thieme; 1998. [Google Scholar]
- 58.Mehnert RB. A world of knowledge for the nation's health: The U.S. National Library of Medicine. Am J Hosp Pharm. 1986;43:2991–2997. [PubMed] [Google Scholar]
- 59.Rosse C, Mejino JL., Jr A reference ontology for biomedical informatics: The Foundational Model of Anatomy. J Biomed Inform. 2003;36:478–500. doi: 10.1016/j.jbi.2003.11.007. [DOI] [PubMed] [Google Scholar]
- 60.Gardner D, et al. The Neuroscience Information Framework: A data and knowledge environment for neuroscience. Neuroinformatics. 2008;6:149–160. doi: 10.1007/s12021-008-9024-z. [DOI] [PMC free article] [PubMed] [Google Scholar]
Associated Data
This section collects any data citations, data availability statements, or supplementary materials included in this article.


