Abstract
The translation of salivary alpha-amylase (sAA) to the ambulatory assessment of stress hinges on the development of technologies capable of speedy and accurate reporting of sAA levels. Here, we describe the developmental validation and usability testing of a point-of-care, colorimetric, sAA biosensor. A disposable test strip allows for streamlined sample collection and a corresponding hand-held reader with integrated analytic capabilities permits rapid analysis and reporting of sAA levels. Bioanalytical validation utilizing saliva samples from 20 normal subjects indicates that, within the biosensor’s linear range (10–230 U/ml), its accuracy (R2 = 0.989), precision (CV < 9%), and measurement repeatability (range −3.1% to + 3.1%) approach more elaborate laboratory-based, clinical analyzers. The truncated sampling-reporting cycle (< 1 minute) and the excellent performance characteristics of the biosensor has the potential to take sAA analysis out of the realm of dedicated, centralized laboratories and facilitate future sAA biomarker qualification studies.
Keywords: SALIVARY DIAGNOSTICS, STRESS BIOMARKER, SALIVARY ALPHA AMYASE, BIOSENSOR, POINT OF CARE MEASURMENT
1. INTRODUCTION
The promise of salivary α-amylase (sAA) as a biological indicator is reflected in its growing application for assessing the individual response to stressors (Chatterton, Vogelsong, Lu, Ellman, & Hudgens, 1996)(Nicolas Rohleder, Urs M Nater, Wolf, Ehlert, & Clemens Kirschbaum, 2004);(Urs M. Nater et al., 2005) Posited as a measurable indicator of sympathetic nervous system (SNS) activity, sAA’s presumptive clinical utility derives from the association between sAA levels and self-reported psychological states in a variety of laboratory and naturalistic settings (Granger, Kivlighan, el-Sheikh, Gordis, & Stroud, 2007);(U.M. Nater & N. Rohleder, 2009). Although the physiological underpinnings are not yet clear, the reported changes in sAA levels in response to acute stressors underscore the potential for sAA to serve as a non-invasive biomarker of SNS activity. A robust pattern of literature suggesting divergence between measures of salivary α-amylase and cortisol reactivity (Nater & Rohleder, 2009) indicates that sAA may have additive value to cortisol in studying individual differences in stress-related vulnerability and resilience. The ability to expediently obtain saliva samples without the collection anxiety and compliance issues involving blood or urine renders sAA particularly appealing as a stress biomarker.
The potential notwithstanding, a broader application of sAA to the study of stress has been hampered by conventional strategies for saliva analysis which lack the ease of use, reliability, reporting immediacy or temporal resolution desired for psychobiological investigations. Typically, saliva samples collected from subjects are processed in centralized laboratories which results in an extended collection-measurement-reporting cycle that is burdened by several potential quality failure points. For example, the total process to deliver a salivary test result involves the multiple steps of saliva sample acquisition, labeling, freezing, transportation, processing in the laboratory (sorting, aliquotting, loading into analyzer), analysis and results reporting. The expenses associated with sample acquisition and transport supplies, specialized analytical equipment and testing supplies, as well as all the labor costs incurred across the total process can also be significant impediments. All these inefficiencies and limitations argue for the development of simpler, integrated, and field-practical methods for quantitative analysis of salivary α-amylase.
Here, we present the developmental validation and usability testing of a portable, point-of-care (POC) biosensor system for rapid measurement of salivary α-amylase levels. A simple, colorimetric test strip allows for streamlined sample collection and preparation. A corresponding hand-held reader with integrated analytic capabilities facilitates rapid, repetitive analysis and reporting of sAA levels. Compared to more elaborate immunoassay based approaches, the operating advantages of this low-cost, point-of care method can confer significant advantages to future investigations seeking to establish the evidentiary linkages between sAA and biological and clinical endpoints (biomarker qualification). As an initial step towards clinical implementation of the sAA biosensor, we investigated the measurement performance characteristics of the sAA biosensor (method validation) using saliva samples from a group of male volunteers. Our aim was to establish biosensor reliability (accuracy and precision) and repeatability through concordance with conventional laboratory-based “gold standard” analyzers.
2. MATERIALS AND METHODS
MEASUREMENT DEVICE
The sAA biosensor builds on a precursor colorimetric assay platform wherein the color intensity of the enzymatic reaction product is photometrically measured to determine the concentration of salivary α-amylase ((Yamaguchi et al., 2004)(Yamaguchi et al., 2006). Some of the technical improvements in the current prototype address field deployability of the devices and include: temperature-stable test strips that can be stored at room temperature for extended periods, an extended dynamic range and improved linearity through the incorporation of pseudosubstrates that slow down enzyme kinetics, improved collector pads that control the volume of collected saliva, refined algorithms to process the raw optical density readings, and digital time/date stamps for collected data.
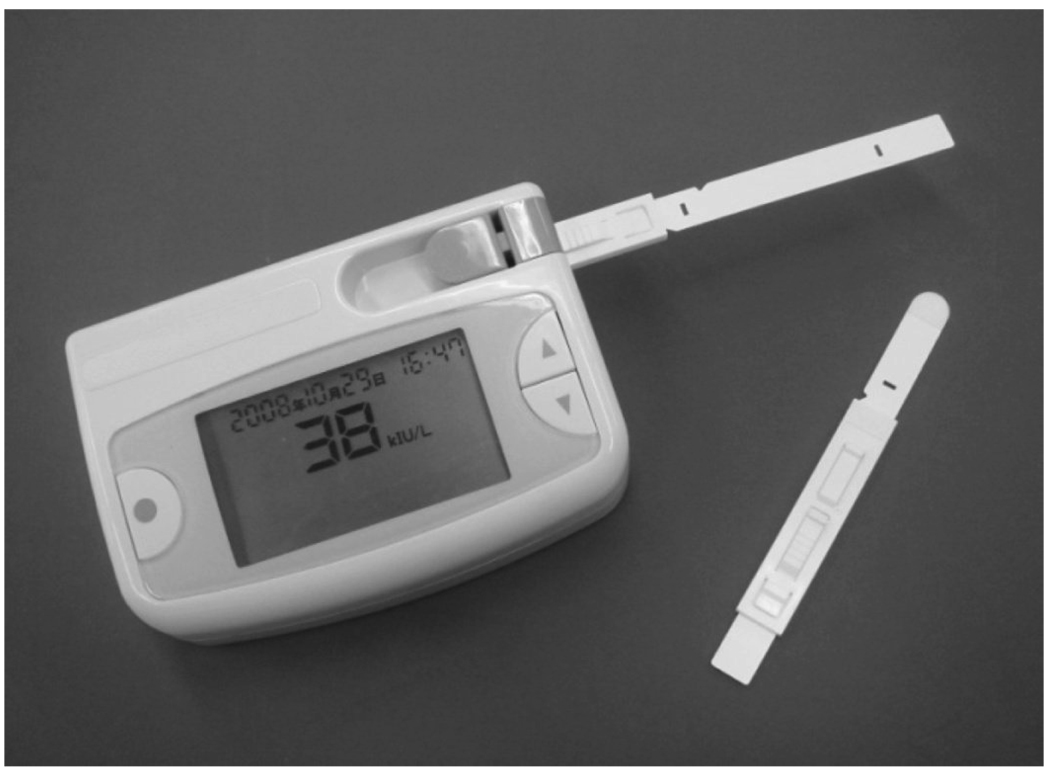
The biosensor system (Figure 1) comprises of a disposable test-strip and a hand-held reader with digital display. The test-strip (Figure 2a) integrates a collector pad (10 mm × 10 mm × 0.23 mm) at its tip and a reagent paper (4 mm × 4 mm × 0.25 mm) infused with Gal-G2-CNP (Toyobo Co. Ltd., Japan), a chromogenic substrate for salivary α-amylase (Yamaguchi et al. 2005). When placed under the tongue, the collector pad quickly (≈ 10 seconds) saturates with fixed micro-liter quantities (≈25µl) of saliva. The strip is inserted into the reader and the lever raised to activate the reader and transfer the collected saliva onto the reagent paper (Figure 2a). After a 10 second interval, an audible signal indicates completion of saliva transfer and the strip is retracted. The sAA in the transferred saliva begins metabolizing the Gal-G2-CNP substrate to yield the colored product CNP according to the reaction  . Ezymatic activity is allowed to proceed for 10 seconds and the reflectance of the reaction product then measured photometrically at 430 nm. The color measured is proportional to the concentration of the sAA; the greater the intensity of the color observed, the greater the concentration of sAA. The biosensor’s microprocessing unit (MPU) calculates the SAA level and displays it as a digital readout (0- 999) along with a date and time stamp (see Fig.2c). Variations in salivary pH are minimized by normalizing equations for pH (R2=0.96) inputted into the biosensor MPU. To compensate for variations in the ambient temperature at the time of saliva collection, the sensor incorporates a miniature thermosensor (resolution ± 0.5°C; Maxim Integrated Products, CA, USA). An embedded temperature adjustment equation (R2=0.99) transforms the measured values into SAA activity at 37°C. From saliva collection to readout, the duration of the entire test is approximately 30 seconds.
Figure 1.
Portable sAA Biosensor comprising of handheld reader and disposable collector strip.
Figure 2.
The saliva collector (Fig. 2a) is placed under the tongue, allowed to saturate with saliva (≈10 seconds) and inserted into the reader (Fig 2b). Raising the lever transfers the saliva sample onto the reagent paper containing the chromogenic substrate (Fig 2b). After 10 seconds, reflectance of the product is measured photometrically at 430 nm (Fig 2c) and provided as an optical readout.
EXPERIMENTAL DESIGN
Saliva samples were obtained from twenty healthy, male students (mean age = 24 years, range 20–30 years). Females were excluded in order to minimize any potential differences related to gender differences in the endocrine response. A short screening questionnaire was used to select participants who were at least 18 years of age, free from psychotropic medication, steroids or drug abuse, and without transitory illnesses or chronic conditions that might interfere with biomarker evaluation. Written informed consent was obtained from all the participants after a full description of the study as approved by the UCLA Institutional Review Board.
Participants were asked not to brush their teeth, drink hot liquids, or eat foods for at least an hour before providing samples. Each participant provided 4 ml of whole saliva by passive drool into a 10 ml plastic tube. All samples were obtained between 8 – 10.00 am during the first week of the academic semester. After the collection, the whole saliva samples were split into two 2ml aliquots, placed in an icebox and immediately transported to the laboratory, where they were stored at −70°C until analysis.
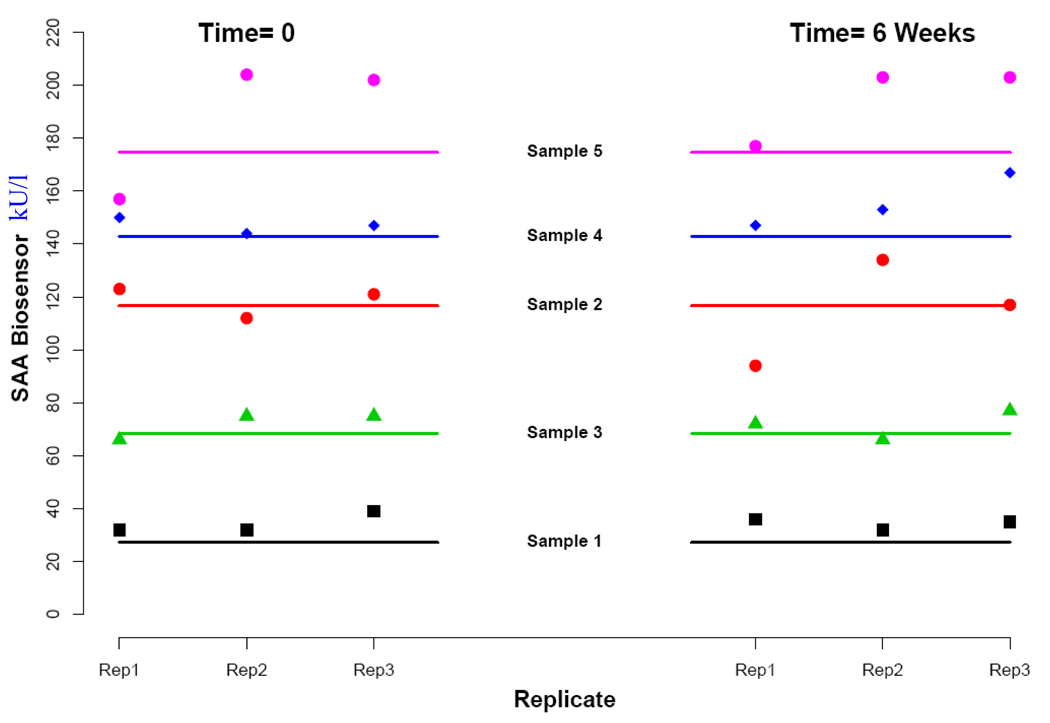
For verifying the biosensor’s analytic characteristics, a vial from each pair was thawed and the aliquot analyzed concurrently with the sAA biosensor and a laboratory-based automated clinical chemistry analyzer (Olympus AU 400 Olympus America, Center Valley, PA). The Olympus analyzer was used as a reference standard and each saliva sample was assayed for sAA levels in accordance with the manufacturer’s operating directives. Calibration standards were prepared by serially diluting a saliva sample containing high sAA levels with stripped saliva or 1% BSA. The dynamic range and the upper limits of linearity were determined by measuring each standard in triplicate with three individual biosensors as well as the Olympus analyzer. Biosensor accuracy and precision were established by assessing each of the 20 saliva samples with five individual biosensors and comparing them to the Olympus analyzer readings. Precision of the Olympus AU4000 was estimated independently by using replicate measurements of five different SAA concentrations. Between-run precision (repeatability) was established through repeated assessment of five saliva samples conducted six weeks apart. The original aliquots were stored at −70°C to prevent potential degradation between analyses. After 6 weeks, the five aliquots were thawed and re-measured in duplicate.
DATA ANALYSIS
Data analysis was performed using the publicly-available R software package. Linear regression was used to estimate linear correspondence between measurements from a single biosensor and laboratory-based readings. Mixed-effects linear models with random-effects for sample and for biosensor device were used to compare readings across machines. Measurement precision quantified with the coefficient of variation (CV). Statistical significance was assessed at the alpha=.05 level, and reported p-values are two-sided.
RESULTS
Linearity and dynamic range
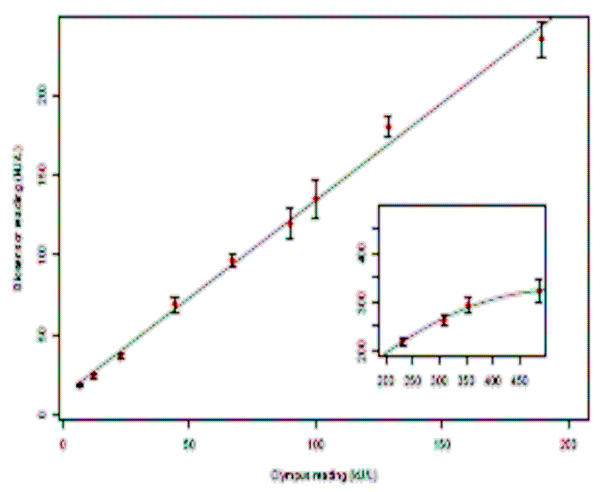
Figure 3 provides a graphical representation of the linearity and dynamic range of the sAA biosensor. Although the dynamic range of the biosensor extended from 5 to 450 U/ml, the generated calibration curve was linear in the range of 10–230 U/ml. Regression analysis revealed a close correspondence between the measured values and the standards with a coefficient of linearity, R2 > 0.98. The dose-response relationship began to deteriorate (inset graph- Figure 1) above the biosensor’s linearity limit (≈230 U/ml), suggesting a saturation point beyond which the biosensor detects but does not accurately measure sAA.
Figure 3.
Calibration curve of sAA biosensor. The standard curve is in triplicate and derived from results for sAA serially diluted with stripped saliva and 1% BSA (inset graph). The error bars indicate the standard deviations.
Biosensor Accuracy
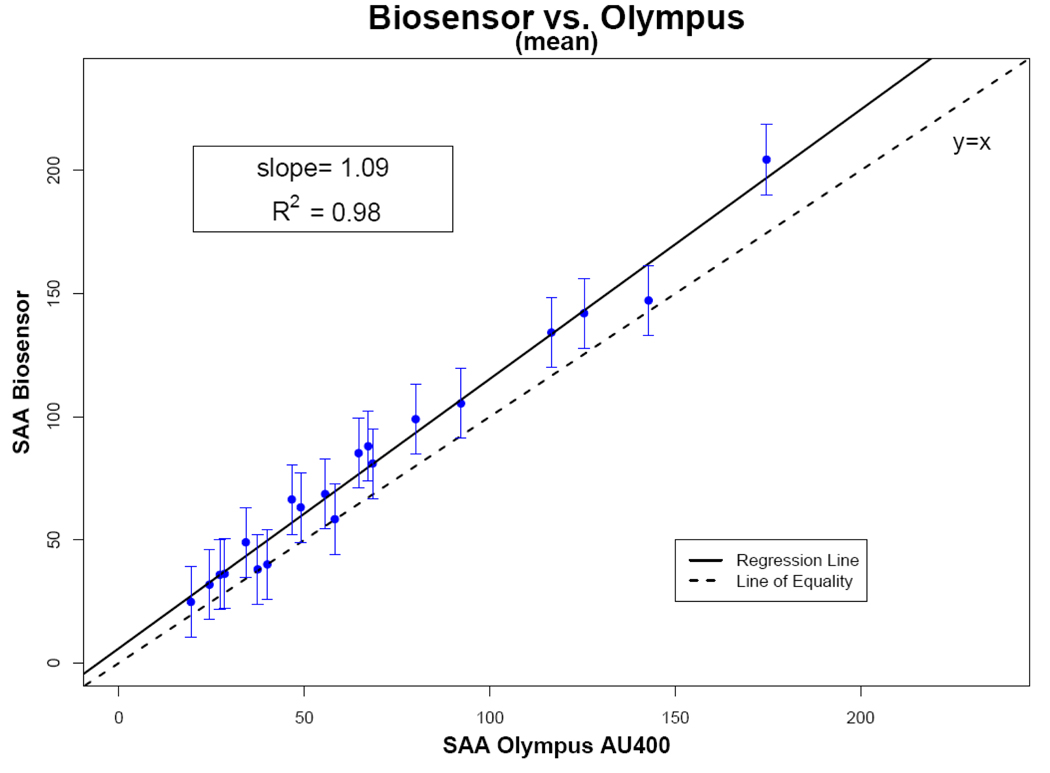
Within the biosensor’s linear range (10–230 U/ml), there was close agreement between the biosensor readings and Olympus AU400 analyzer (Figure 4). Average biosensor measurements across the different devices showed excellent correlation (R2 = 0.98) with the measurements obtained from the laboratory-based Olympus analyzer. The slope of the fitted linear regression model (1.09) was very close to best fit line for the measured standards.
Figure 3.
Regression analysis of the correlation between the sAA biosensors (n = 5) and the Olympus AU400 for saliva samples from 20 subjects. The dotted line represents the line of perfect agreement and the solid line the correlation plot. Error bars are ± 2 regression standard errors.
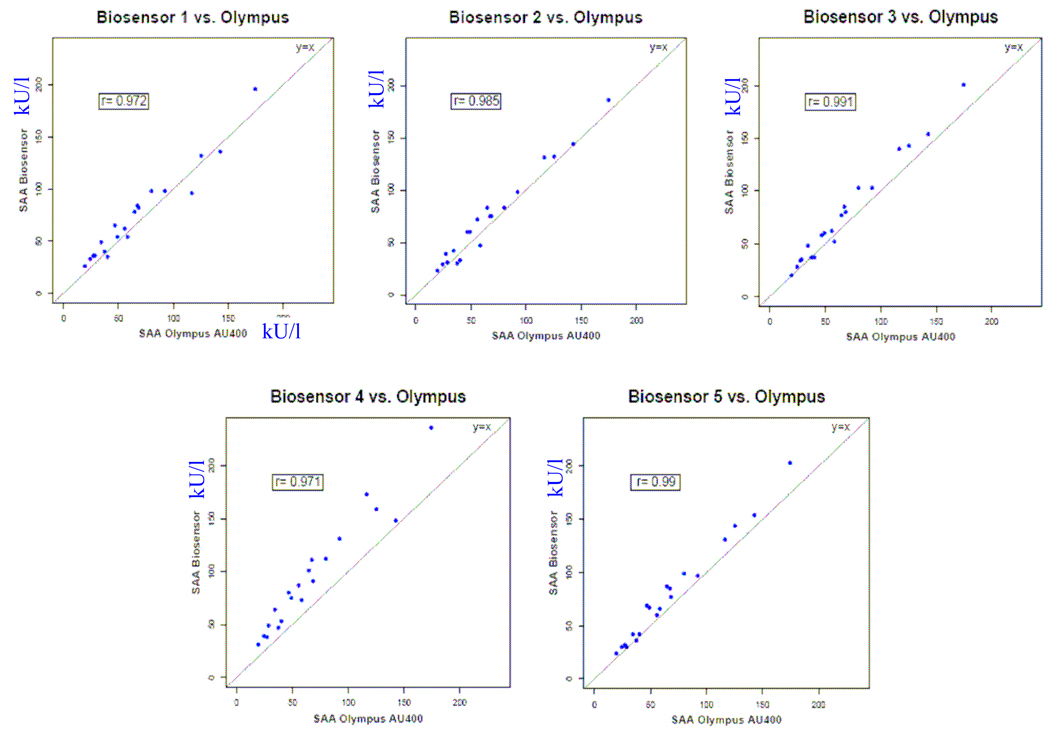
The individual correlation plots of sAA measured by the five biosensors and the Olympus AU400 chemical analyzer are summarized in Figure 5. Although each of the sAA devices exhibited high correlation with the gold standard, the relationship dirrered across the devices with the slopes of the fitted regression lines varying from 0.98 to 1.20. An ANOVA model using the saliva sample as a random blocking factor and biosensor device as a fixed effect indicated that biosensor sAA measurements differed significantly across the devices (p<.0001).
Figure 4.
Comparison of standard curves obtained by the five individual sAA biosensors and the Olympus AU400 for saliva samples from 20 healthy males.
Examining the intraclass correlations from a random-effects linear model, treating both saliva sample and biosensor machine as random effects, indicated that 94.5% of the measurement variability derived from subject-level differences, with only 3.0% attributable to differences between biosensors and 2.5% to random measurement variability. This suggests that while measurement variability between biosensor devices is relatively small compared to the biological variability of sAA levels, the between-machine variability is slightly higher than the random measurement variability.
Biosensor Repeatability
The measurement repeatability for the biosensors is summarized in Figure 6. Repeat analysis of five saliva samples after a period of 6 weeks evidenced no systematic differences between the measurements taken at the two time points. The average percentage drift, as quantified by the difference in average readings from each time point divided by the mean of all measurements across both times, was 0.0%, 3.1%, 0.5%, −5.7%, and −3.5% for the five samples. In general, the biosensor appeared to overestimate the sAA levels with 24 of the 30 total measurements slightly higher than the corresponding chemical analyzer measurements.
Figure 5.
Measurement stability verified by repeating sAA biosensor measurements in 5 saliva samples and comparing them to measurements obtained from the normative Olympus AU400 analyzer.
Biosensor Precision
The precision of the biosensor was established by inter-run measurements of saliva samples taken with the same device. The coefficient of variation (CV) for the nine measurements at each concentration in the dynamic range experiment averaged 8.1% (range 4.9%–13.3%), and values from all six replicate measurements across both days of the stability experiment averaged 8.4% (range 5.5%–11.4%) indicating adequate precision of the biosensor. In contrast, the coefficient of variation of the Olympus analyzer was 1.1 % (range 0.4%–1.9%). CVs calculated from concentrations measured repeatedly with five different biosensor machines averaged 13.8% (range 5.3%–21.0%), suggesting between-machine differences.
DISCUSSION
The translation of salivary α-amylase to the ambulatory assessment of stress hinges on the development of new technologies capable of rapid quantitative analysis of saliva in a variety of settings. At a minimum, the performance characteristics of the point-of-care (POC) devices should approach the consistency and reliability of the more elaborate laboratory instruments they are meant to replace. As our method validation study demonstrates, the precision, accuracy and repeatability of the sAA biosensor closely replicates the measurement qualities of a conventional, automated Olympus clinical analyzer. Through replicate testing of the same saliva samples, we established that the biosensor-reported values (measured values) were linearly proportional to the laboratory-ascertained sAA concentrations (true values) over a range extending from 10 to 230 U/ml. Above 250 U/ml, the sensor response showed a deviation from linearity, indicating that saturation mechanisms were degrading the signal-to-noise ratio. The linear response limits of the biosensor corresponds closely to the physiological range of sAA in normal subjects, i.e. 10–250 U/ml (Urs M. Nater et al., 2005). However, future versions of the biosensor would benefit from a wider linearity response capable of accurately capturing higher sAA levels that may manifest in extreme stress conditions.
Regression analysis of the correlation between the biosensor and chemical analyzer values confirmed the general accuracy of the biosensor with R2 values > 0.98. The slope of the summary best-fit line (1.09) describes the close agreement between the sensor and the Olympus machine measurements. The positive residual slope (.09) indicates that the biosensors have a tendency to slightly overestimate sAA values in comparison to laboratory-based analyzers. Similar to the preassessment calibrations routinely performed on laboratory analyzers, strategies for refining measurement accuracy could include the use of standardized calibration strips with varying reflectances as well as embedded software to transform and rectify estimation errors. The biosensor’s precision (average CV < 9%) falls within the acceptable range for medical use and can be construed as the inevitable tradeoff for its point-of-care capabilities. The ICC analysis used to disentangle measurement variability into subject-level, biosensor-level, and random variability suggested that less that 3% of variability resulted from measurement differences arising from the five biosensors used in this study. Simply put, if applied in clinical studies, any measurement error introduced by the biosensor (i.e. the noise) can be expected to be similar to random measurement variability (2.5% in this case) and very minimal when compared to the natural variability in sAA levels (i.e. the signal) in a study population. The consistent linear relationship between biosensor and laboratory-based readings notwithstanding, one of the biosensor units exhibited a higher slope than the others (see Figure 5). Prescreening adjustments or integrated normalizing equations could be used to adjust for any such baseline differences between individual biosensor units. Using a colorimetric rather than an immobilized antibody platform simplifies handling and results in greater stability, as evidenced by the minimal measurement drift over the 6 week period. This measurement consistency is especially critical when it comes to studying temporal changes in psychobiologic events related to behavioral problems and for the longitudinal evaluation of treatment effects (Haynes & Yoshioka, 2007)
The excellent performance characteristics of the biosensor take sAA analysis out of the realm of dedicated, centralized laboratories and eliminate quality failure points along the sample acquisition, transport, processing and reporting sequence. The quick, non-invasive sample acquisition (≈ 10 seconds), the lack of sample preparation steps and the rapid reporting (within 30 seconds) renders the biosensor very useful for providing quick determinations of sAA in near-patient testing. Moreover, feedback from subjects and staff involved in our ongoing biomarker qualification studies (Robles et al, 2010) suggest that the biosensor is simple to operate, durable and requires little to no maintenance. The mechanical portion of the analyzer was very reliable throughout the testing. The computerized electronics and digital display simplified analyzer operation by providing step by step instructions and storing the individual measurements with a time and date stamp. The saliva sample required is very small (<25 µl), allowing the system to be utilized even in xerostomic individuals. As De Caro (DeCaro, 2008) has pointed out and our own experiences echo, absorbent saliva collection materials (e.g., Salivettes, Sarstedt, Rommelsdorf, Germany) have serious handling disadvantages. Incomplete saturation of the collection material can lead to large variances in the reported levels, with amylase recovery approaching zero at sample volumes below 0.25 ml – a volume tenfold that required for the sAA biosensor. Moreover, our sample collection method avoids the inconvenience subjects often experience when providing saliva samples through passive drool (Navazesh, 1993). Finally, the cost per unit measurement is very low due to the use of disposable plastic collector strips that are similar to the single-use paper strips for glucose monitoring in diabetics.
The ease of use and logistical simplicity of ambulatory biosensor measurement provides several improvements in studying biological responses to stress. Because the biosensor requires less saliva, time, and collection complexity (e.g., passive drool), biosensor measurement reduces reactivity to the assessment method itself. Unlike obtaining plasma for catecholamines, which requires venipuncture, or conventional methods of obtaining saliva, biosensor measurement is considerably less intrusive, and much less likely to play a role in the biological stress response itself. Moreover, the truncated saliva sampling-reporting cycle (< 1 minute) allows a temporal resolution that approaches that of more elaborate electrophysiologic measures (e.g., impedance cardiography, continuous blood pressure monitoring, electrodermal activity). This level of temporal resolution allows a time-sampling protocol that is sensitive to common sources of biomarker variability (e.g., diurnal variation, timing relative to stressor) and renders it particularly useful for time-series psychophysiological measurements in naturalistic settings.
In summary, our investigations verify that the sAA biosensor system provides an automated analytical technology for monitoring sAA levels in human saliva. The sAA biosensor has an accuracy, precision and measurement reliability that approaches elaborate laboratory-based analyzers. Other compelling advantages include nominal sample requirement, lack of sample pretreatment, a digital operation that controls experimental variables, rapid reporting, and an integrated microprocessor-based data collection and archiving system. Integrated within a multimodal assessment strategy, the sAA biosensor can assist researchers navigate the arduous process of biomarker validation and utilizing it as the basis for increasing the incremental validity and specificity of clinical judgments about the individual response to stressors.
ACKNOWLEDGEMENTS
The project described was supported by Grant Number 1UO1-DAO23815 from the NIH/National Institute on Drug Abuse (P.I. - V. Shetty). The authors would like to acknowledge the technical assistance of Mr. Amir Chalak and thank Dr. Najib Aziz for providing insight and expertise that greatly assisted the research. The prototype sAA biosensor units and collector strips were provide by Mr. Sano of NIPRO Corp. Japan.
Footnotes
Publisher's Disclaimer: This is a PDF file of an unedited manuscript that has been accepted for publication. As a service to our customers we are providing this early version of the manuscript. The manuscript will undergo copyediting, typesetting, and review of the resulting proof before it is published in its final citable form. Please note that during the production process errors may be discovered which could affect the content, and all legal disclaimers that apply to the journal pertain.
REFERENCES
- Chatterton RT, Vogelsong KM, Lu YC, Ellman AB, Hudgens GA. Salivary alpha-amylase as a measure of endogenous adrenergic activity. Clinical Physiology (Oxford, England) 1996;16(4):433–448. doi: 10.1111/j.1475-097x.1996.tb00731.x. Retrieved from http://www.ncbi.nlm.nih.gov/pubmed/8842578. [DOI] [PubMed] [Google Scholar]
- DeCaro JA. Methodological considerations in the use of salivary alpha-amylase as a stress marker in field research. American Journal of Human Biology. 2008;20(5):617–619. doi: 10.1002/ajhb.20795. doi: 10.1002/ajhb.20795. [DOI] [PubMed] [Google Scholar]
- Granger DA, Kivlighan KT, el-Sheikh M, Gordis EB, Stroud LR. Salivary alpha-amylase in biobehavioral research: recent developments and applications. Annals of the New York Academy of Sciences. 2007;1098:122–144. doi: 10.1196/annals.1384.008. doi: 10.1196/annals.1384.008. [DOI] [PubMed] [Google Scholar]
- Haynes SN, Yoshioka DT. Clinical assessment applications of ambulatory biosensors. Psychological Assessment. 2007;19(1):44–57. doi: 10.1037/1040-3590.19.1.44. doi: 10.1037/1040-3590.19.1.44. [DOI] [PubMed] [Google Scholar]
- Nater U, Rohleder N. Salivary alpha-amylase as a non-invasive biomarker for the sympathetic nervous system: Current state of research. Psychoneuroendocrinology. 2009;34(4):486–496. doi: 10.1016/j.psyneuen.2009.01.014. doi: 10.1016/j.psyneuen.2009.01.014. [DOI] [PubMed] [Google Scholar]
- Nater UM, Rohleder N, Gaab J, Berger S, Jud A, Kirschbaum C, et al. Human salivary alpha-amylase reactivity in a psychosocial stress paradigm. International Journal of Psychophysiology. 2005;55(3):333–342. doi: 10.1016/j.ijpsycho.2004.09.009. doi: 10.1016/j.ijpsycho.2004.09.009. [DOI] [PubMed] [Google Scholar]
- Navazesh M. Methods for collecting saliva. Annals of the New York Academy of Sciences. 1993;694:72–77. doi: 10.1111/j.1749-6632.1993.tb18343.x. Retrieved from http://www.ncbi.nlm.nih.gov/pubmed/8215087. [DOI] [PubMed] [Google Scholar]
- Rohleder N, Nater UM, Wolf JM, Ehlert U, Kirschbaum C. Psychosocial stress-induced activation of salivary alpha-amylase: an indicator of sympathetic activity? Annals of the New York Academy of Sciences. 2004;1032:258–263. doi: 10.1196/annals.1314.033. doi: 10.1196/annals.1314.033. [DOI] [PubMed] [Google Scholar]
- Yamaguchi M, Deguchi M, Wakasugi J, Ono S, Takai N, Higashi T, et al. Hand-held monitor of sympathetic nervous system using salivary amylase activity and its validation by driver fatigue assessment. Biosensors and Bioelectronics. 2006;21(7):1007–1014. doi: 10.1016/j.bios.2005.03.014. doi: 10.1016/j.bios.2005.03.014. [DOI] [PubMed] [Google Scholar]
- Yamaguchi M, Kanemori T, Kanemaru M, Takai N, Mizuno Y, Yoshida H. Performance evaluation of salivary amylase activity monitor. Biosensors and Bioelectronics. 2004;20(3):491–497. doi: 10.1016/j.bios.2004.02.012. doi: 10.1016/j.bios.2004.02.012. [DOI] [PubMed] [Google Scholar]


