
Fig. 2.
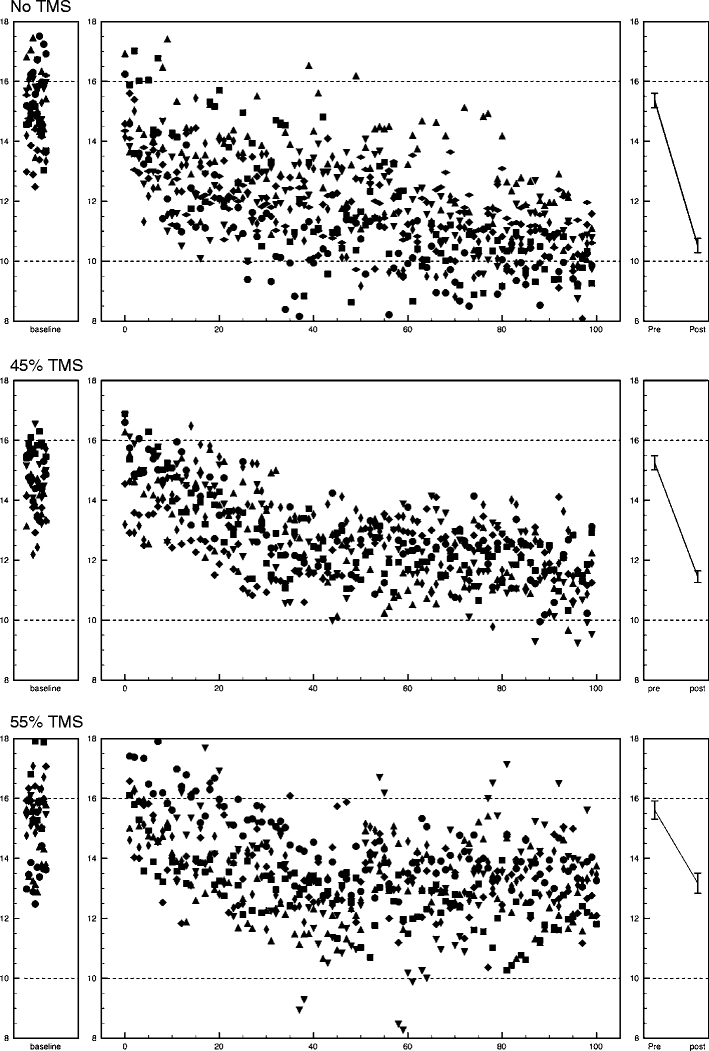
Individual and mean results of the three groups performing the saccadic adaptation task. The line plots on the right-hand side of each panel show the mean saccadic amplitude of the 10 pre-adaptation baseline saccades made to a 16° target and the mean saccadic amplitude of the last 10 saccades of the adaptation experiment; error bars represent the standard error of the means. The scatter plots on the left of each panel represent the trial-by-trial amplitude of the primary reactive saccade for each individual in the group, after exclusion of outliers. Different symbols are used for each participant in each group. The left-most data are for baseline trial symbol in which participants moved towards static targets; the central data points are the primary saccades made by each individual during the time course of 100 adaptive trials. Horizontal dotted lines indicate the amplitude of the ideal initial and final saccades