

Abstract
To compare the ability of the multifocal electroretinogram (mfERG) and frequency domain optical coherence tomography (fdOCT) to detect retinal abnormalities. A total of 198 eyes (100 patients) were referred by neuro-ophthalmologists to rule out a retinal etiology of visual impairment. All patients were evaluated with static automated perimetry (SAP) (Humphrey Visual Field Analyzer; Zeiss Meditec), mfERG (Veris, EDI) and fdOCT (3D-OCT 1000, Topcon). The mfERG was performed with 103 scaled hexagons and procedures conforming to ISCEV standards (Hood DC et al. (2008) Doc Ophthalmol 116(1):1–11). The fdOCT imaging included horizontal and vertical line scans through the fovea. Local mfERG and fdOCT abnormalities were compared to local regions of visual field sensitivity loss measured with SAP and categorized as normal/inconclusive or abnormal. 146 eyes were categorized as normal retina on both fdOCT and mfERG. The retina of 52 eyes (36 patients) was categorized as abnormal based upon mfERG and/or fdOCT. Of this group, 25 eyes (20 patients) were abnormal on both tests. However, 20 eyes (13 patients) were abnormal on mfERG, while the fdOCT was normal/inconclusive; and 7 eyes (7 patients) had normal or inconclusive mfERG, but abnormal fdOCT. Considerable disagreement exists between these two methods for detection of retinal abnormalities. The mfERG tends to miss small local abnormalities that are detectable on the fdOCT. On the other hand, the fdOCT can appear normal in the face of clearly abnormal mfERG and SAP results. While improved imaging and analysis may show fdOCT abnormalities in some cases, in others early damage may not appear on structural tests.
Keywords: Neuro-ophthalmology, Electroretinography, Optical coherence tomography, Retina, Electroretinogram
Introduction
The mfERG technique [1], which was developed to provide a topographical measure of retinal activity, has proven useful in distinguishing between local abnormalities of the retina, as opposed to damage of the optic nerve [2]. Specifically, with the “standard” mfERG paradigm [3], the retinal ganglion cells (RGCs) and their axons contribute relatively little to the mfERG response [2, 4]. Thus, dysfunction at the level of the RGCs or optic nerve leaves the mfERG relatively normal, and mfERG abnormalities, including changes in both amplitude and timing, largely reflect damage at or before the bipolar cells.
The clinical utility of the mfERG is enhanced by comparing the pattern of abnormality to visual field abnormalities obtained, for example, with static automated perimetry (SAP). Topographical agreement between mfERG abnormalities and sensitivity loss on visual fields provides strong evidence of a local retinal abnormality [2]. The mfERG is not without its problems, however. First, stray light contributes to the ERG responses to local stimuli [5–7], and thus small defects may be hard to detect [2, 8]. Second, local retinal damage to only the RGC layer, perhaps rare, would be missed. In addition, the technique requires specialized equipment and trained electrophysiologists.
Recent advances in retinal imaging, in particular frequency domain optical coherence tomography (fdOCT), now allow the visualization of the retinal structure in vivo [9]. Numerous recent studies have demonstrated the clinical utility of the fdOCT technique in identifying local damage to the retina in diverse diseases including, but not limited to, retinal dystrophy [10, 11], acute macular neuroretinopathy [12–14], hydroxychloroquine toxicity [15–18], Stargardt disease [19, 20] and adult-onset vitelliform macular dystrophy [21–25]. In addition to being more accessible than the mfERG to clinicians, this technique has the advantage of being relatively easy and fast to perform. On the other hand, it is a structural test, unlike visual fields and mfERGs, which are functional tests, and thus, theoretically, can appear normal in the presence of some retinal functional abnormalities.
Here, we compare the ability of the mfERG and fdOCT to detect abnormalities of the retina. For reasons mentioned earlier, and detailed in the “Discussion”, we do not necessarily expect the techniques to agree. In fact, it is the disagreements that are of most interest. On the one hand, they should help the clinician understand the relative effectiveness of each modality in ruling out a retinal etiology of a visual field defect. In addition, they may provide the basic clinical scientist with important information to better understand the action of a particular retinal disease.
Methods
Subjects
Between October 2007 and June 2009, 107 consecutive patients (212 eyes) <80 years of age were referred by neuro-ophthalmologists for a mfERG to rule out a retinal etiology of visual impairment. Seven patients (14 eyes) were excluded for technical reasons: insufficient pupil dilation for mfERG evaluation (1 patient; 2 eyes); incomplete fdOCT evaluation (3 patients; 6 eyes); and corrupted mfERG data (3 patients; 6 eyes). The study group of 100 patients (198 eyes), consisted of 57 women and 43 men, ranging in age from 9 to 79 years, with a mean age of 49.1 ± 17.6 years. Both eyes of each patient were tested, with the exception of two patients, who could not comply with testing as a result of very poor visual acuity (count fingers at 12 inches) in one eye. All subjects underwent an ophthalmologic examination by a board certified neuro-ophthalmologist. This examination included medical history review, best-corrected visual acuity (BCVA), slit-lamp biomicroscopy, dilated fundoscopic examination and SAP. The procedures adhered to the tenets of the Declaration of Helsinki, and the protocol was approved by the Committee of the Institutional Board of Research Associates of Columbia University. Written informed consent was obtained from all subjects prior to their participation.
Standard automated perimetry (SAP)
SAP was performed using the Humphrey Visual Field Analyzer (Zeiss Meditec) using the 30-2, 24-2 and/or 10-2 program. All patients had abnormalities on SAP testing. In general, the visual fields were obtained with the center spot on. The dB sensitivity value for this central point is referred to as “foveal sensitivity” in the following text.
mfERG stimulus, recording and analysis
The “standard” mfERG was performed with procedures conforming to ISCEV guidelines [3] and with procedures previously described [2, 26]. Briefly, the ERG signal (measured with 10 and 300 Hz cutoffs) was recorded with a Burian–Allen corneal electrode and a forehead ground electrode. The fixation target was a central cross, unless the patient's visual field defect prevented them from visualizing the cross, in which case a central circle was used to prevent obscuration of the central signals. During the 8-min recording, the 103 scaled hexagon display had a mean luminance of 100 cd/m2 and a contrast of ≥90%. The mfERG responses were analyzed with artifact rejection and with and without spatial averaging of 1/6 of surrounding responses.
The resultant mfERG responses were examined for local changes in amplitude and latency. Local mfERG abnormalities were compared to local regions of visual field sensitivity loss measured with SAP. The mfERG results were categorized as normal/inconclusive or abnormal. An mfERG was categorized as abnormal if there was a decrease in amplitude or an increase in latency in regions consistent with the abnormal sensitivity seen on the SAP visual field. These eyes with abnormal mfERGs were classified as “Retina”. Conversely, the eyes were classified as “Not Retina” if the mfERG was normal or inconclusive in regions with abnormal visual fields. Inconclusive refers to changes that were too small or subtle to make a judgment (refer to Fig. 3 for an example).
Fig. 3.
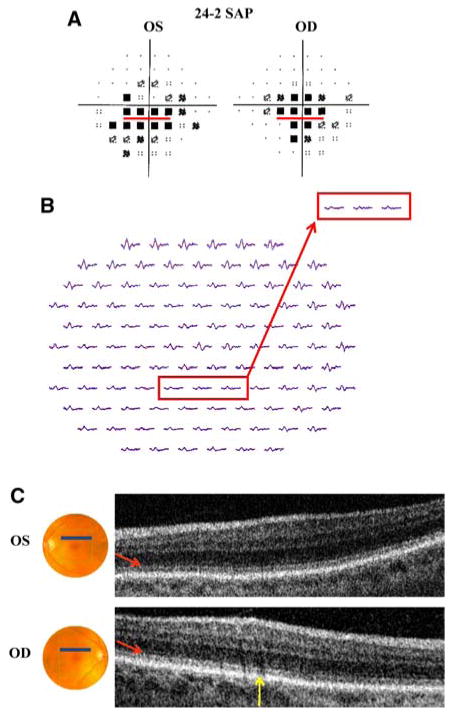
Patient 3. a 24-2 SAP demonstrates central scotomas (more pronounced inferiorly) in both eyes. b mfERG with marked reduction in amplitude and slight increase in latency in both eyes. c fdOCT demonstrates subtle disorganization of the IS/OS junction (red arrows) in both eyes; yellow arrow identifies shadow created by blood vessels. Red boxes (a and b) correspond to the fdOCT scan (c) through the retina 5° superior to the fovea
fdOCT image acquisition and analysis
The fdOCT imaging was performed with the 3DOCT-1000 (Topcon Corporation, Tokyo, Japan) on the same day as the mfERG. The fdOCT imaging included: 3D macular scans and 3D optic disc scans, each consisting of the following: 128 line scans (B-scans) 6 mm in horizontal and vertical distance; and 6 mm horizontal and vertical line scans through the fovea (consisting of 1024 A-scans). The 3D optic disc scans included an interpolated circle scan of 3.4 mm diameter around the optic disc.
For diagnosing an eye as “Retina” versus “Not retina”, only the vertical and horizontal line scans and 3D macular scans were used. In particular, these scans were examined for local changes in retinal structure in regions corresponding to the regions of abnormal SAP sensitivity. As with the mfERG, fdOCT results were subsequently categorized as normal/inconclusive or abnormal, based upon agreement with the SAP defect.
Results
Table 1 shows the results for all 198 eyes. In the case of 146 eyes, both the mfERG and fdOCT were classified as “Not Retina”. Of the remaining 52 eyes, 25 were classified as “Retina” on both tests, while the other 27 were classified as “Retina” on only the mfERG (20 eyes) or only the fdOCT (7 eyes). Tables 2 and 3 present the data for only one eye per patient. The eye with the poorer visual field (Table 2) or better visual field (Table 3) is presented, where poorer or better is based upon the mean deviation (MD) of the visual field. Whether examining Table 1 or Tables 2 and 3, the pattern of results is clear. Of the eyes classified as “Retina”, 52% (44% of the poorer and 65% of the better eyes) were classified as “Retina” on only one of the two tests.
Table 1. Summary of results for all subjects.
| All eyes | mfERG not retina | mfERG retina |
|---|---|---|
| fdOCT not retina | 146 | 20 |
| fdOCT retina | 7 | 25 |
Table 2. Summary of results for poorer eye (determined by mean deviation) of each subject.
| Poorer eyes | mfERG not retina | mfERG retina |
|---|---|---|
| fdOCT not retina | 68 | 11 |
| fdOCT retina | 3 | 18 |
Table 3. Summary of results for better eye (determined by mean deviation) of each subject.
| Better eyes | mfERG not retina | mfERG retina |
|---|---|---|
| fdOCT not retina | 78 | 9 |
| fdOCT retina | 4 | 7 |
Eyes classified as retinal on both mfERG and fdOCT tests
Figures 1 and 2 present results for three of the 25 eyes (2 of the 20 patients) classified as “Retina” on both tests. Patient 1 is a 49-year-old woman who experienced the sudden onset of dark spots in the right eye after a day of skiing in bright sunlight. Her visual acuity was 20/15 in both eyes. Fundoscopic examination revealed choroidal hypopigmentation and a gray-colored lesion temporal to the macula. The SAP test (30-2 program) demonstrated a dense nasal scotoma out to 30°, with inferior extension (Fig. 1a). Figure 1b shows the mfERG response arrays. In this figure and all similar plots of the mfERG, the red and blue records correspond to the left and right eyes, respectively. The mfERG records from the right eye were flipped along the vertical meridian so that responses from corresponding retinal locations in the two eyes are shown together (i.e. the nasal retina is to the left of center for both eyes). In Fig. 1b, the mfERG waveforms from the right eye (blue) show reduced amplitude and increased latency when compared to those from the left eye (red) throughout most of the field. The fdOCT scans of the left eye were normal, but those of the right showed abnormalities in the receptor region. Figure 1c shows the horizontal line scans with the arrow indicating a loss of the inner segment–outer segment (IS/OS) junction and a thinning of the receptors, which begins 5° temporal to the fovea and extends to the temporal border of the image (10° temporal to the fovea). The red rectangles in Fig. 1 show corresponding regions of the three tests. Subtle differences in the extent of the abnormalities on the structural versus functional tests are probably due to the size of the mfERG and SAP test lights and the effects of stray light. In any case, both fdOCT and mfERG clearly indicate a retinal origin. While a diagnosis of acute macular neuroretinopathy (AMN) has been considered by the neuro-ophthalmologist, no definitive diagnosis has been made, as the clinical findings are not completely consistent with AMN.
Fig. 1.
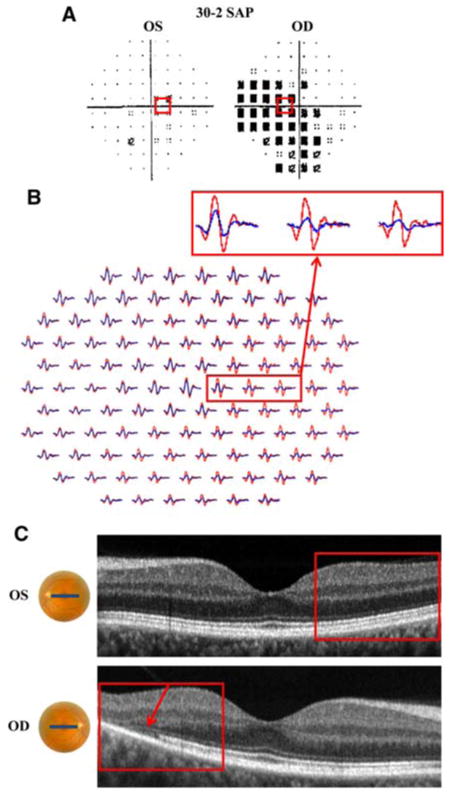
Patient 1. a 30-2 SAP demonstrates dense nasal scotoma with inferior extension in the right eye. b mfERG with reduced amplitude and increased latency throughout most of the field for the right eye (blue waveforms). c fdOCT horizontal line scans of the left and right eyes demonstrate loss of the inner segment–outer segment (IS/OS) junction in the temporal retina of the right eye. a–c Red boxes identify corresponding regions of the retina
Fig. 2.
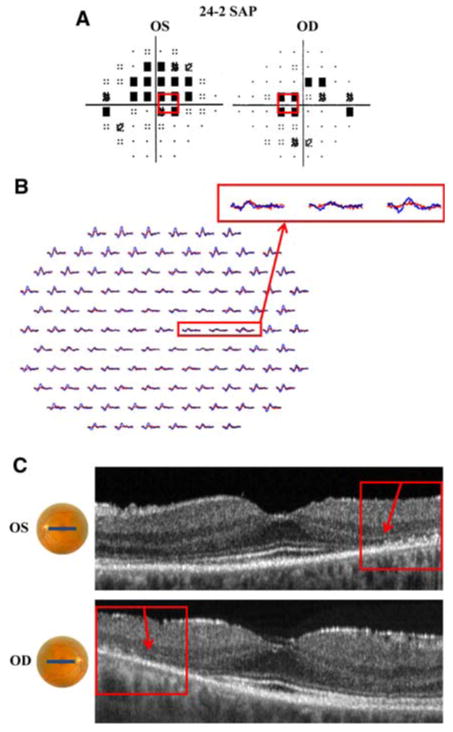
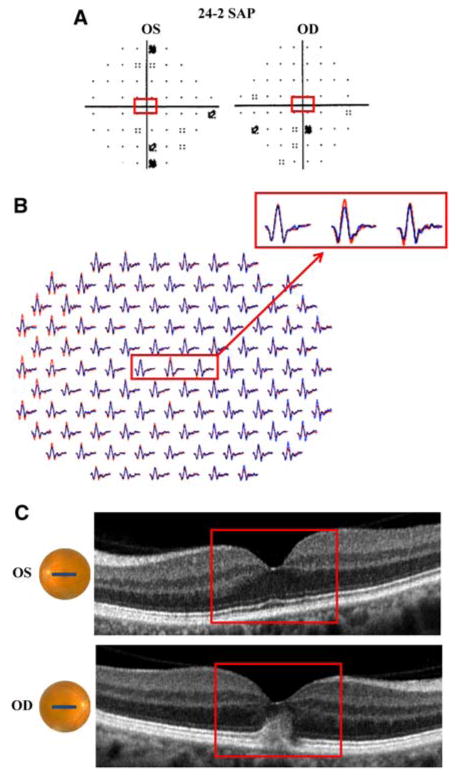
Patient 2. a 24-2 SAP demonstrates paracentral scotomas in left and right eyes. b mfERG with reduced amplitude and increased latency in both eyes. c fdOCT demonstrates loss of the IS/OS junction, most prominent in the temporal retina of both eyes (red boxes). a–c Red boxes identify corresponding regions of the retina
Patient 2 is a 50-year-old woman with a past medical history of systemic lupus erythematosus, who had been treated with hydroxychloroquine (plaquenil) for 20 years. Despite the absence of subjective visual complaints and normal appearing retina on fundoscopic examination, her visual acuity was 20/25 OD and 20/30 OS. The SAP (24-2 program) test revealed paracentral scotomas in both eyes (Fig. 2a). The sensitivity for the central foveal test spot was normal in both eyes. The mfERG showed abnormalities for both eyes, there was increased latency and reduced waveform amplitude, throughout the region corresponding to the SAP defects (Fig. 2b). The fdOCT horizontal line scans through the fovea (Fig. 2c) reveal loss of the IS/OS junction and receptor outer segments (arrows). These structural changes at the level of the receptors correspond to the regions of abnormality on the SAP test. For example, the red rectangle in Fig. 2c corresponds to approximately the same regions shown in the red rectangles in Fig. 2a and b. To a first approximation, regions of decreased SAP sensitivity correspond to abnormalities on both the mfERG and fdOCT. Similar results have been reported for hydroxychloroquine retinopathy [15–18].
The remaining patients in this category had SAP, mfERG and fdOCT defects within the central 10°. In addition, the vast majority of the fdOCT abnormalities (18 of 25 eyes) were characterized by clear structural changes in the IS/OS junction (15 eyes) or by a macular hole (3 eyes). The fdOCT imaging of the remaining eyes in this category was characterized by diffuse thinning in the inner nuclear, inner plexiform and retinal ganglion cell layers (7 eyes). Perhaps of clinical significance, vascular damage was presumed to be the cause of the retinal abnormality for 4 of these 7 eyes.
As clinical electrophysiologists, our focus here is on establishing a retinal etiology based upon the mfERG or fdOCT, rather than establishing a diagnosis. However, for those who may be interested, we list the tentative diagnoses as supplied by each patient's neuro-ophthalmologist. The diagnoses for the remaining 22 eyes (18 patients) with abnormal mfERG and abnormal fdOCT included age-related macular degeneration (1 eye, 1 patient); cancer associated retinopathy versus cone–rod dystrophy (2 eyes, 1 patient); cone–rod dystrophy (2 eyes, 1 patient); central serous retinopathy (2 eyes, 1 patient); central serous retinopathy with superimposed cone–rod dystrophy versus autoimmune retinopathy (1 eye, 1 patient); local foveal defects, including macular hole and cyst (2 eyes, 2 patients); local vascular damage (4 eyes, 4 patients); possible Stargardt disease (2 eyes, 1 patient); retinal damage secondary to persistent optic nerve edema (1 eye, 1 patient); no definitive diagnosis (4 eyes, 4 patients); and unknown diagnosis/lost to follow-up (1 eye, 1 patient).
Eyes classified as retinal based upon the mfERG, but not the fdOCT
Of the 52 eyes categorized as Retina (Table 1), 20 eyes, or 38.5%, were classified as Retina based only on the mfERG; the fdOCT was normal or inconclusive. Figures 3 and 4 present results for 4 of the 20 eyes (2 of 13 patients).
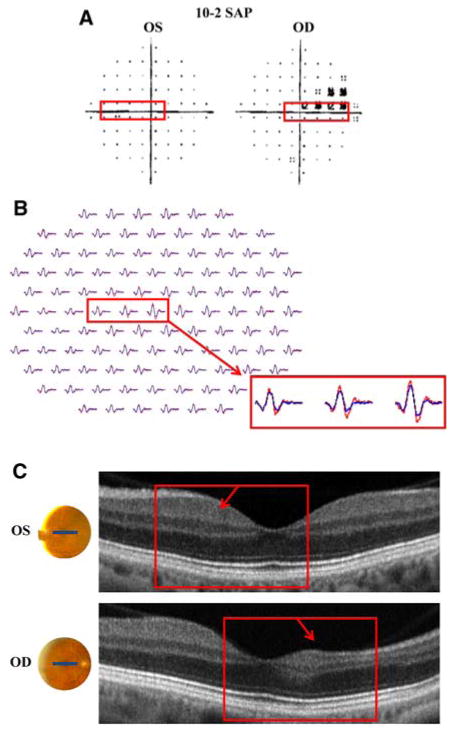
Fig. 4.
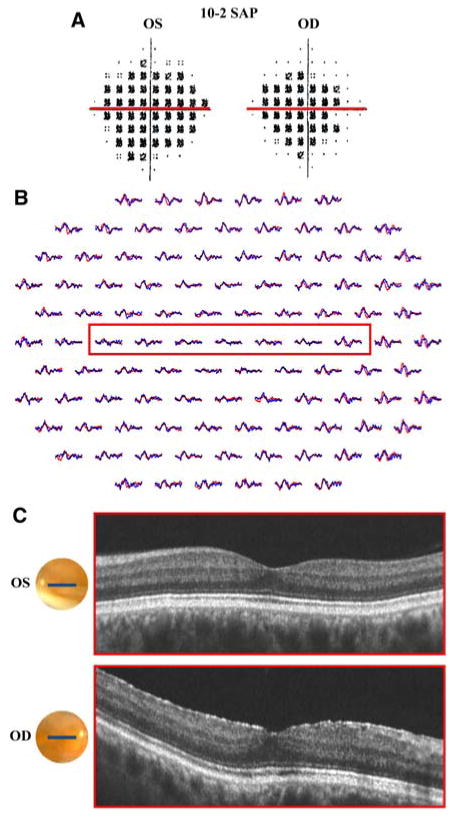
Patient 4. a 10-2 SAP demonstrates dense central scotomas in both eyes. b mfERG with reduced amplitude and latency at the upper limit of normal throughout the central 10°. c fdOCT with normal appearance in both eyes. a–c Red boxes identify corresponding regions of the retina
Patient 3 is a 69-year-old woman who presented for routine visual field testing, which demonstrated central scotomas in both eyes. Fundoscopic examination was notable for slight pallor of the neuroretinal rim. These findings raised suspicion of a congenital optic atrophy, however, the differential diagnosis included cone dystrophy, melanoma-associated optic neuropathy (paraneoplastic) and chronic open angle glaucoma. Visual acuity was 20/25 + 1 in the right eye and 20/20-2 in the left eye. SAP (24-2 program) showed bilateral central scotomas (more pronounced inferiorly) with reduced foveal sensitivity values (32 dB) in both eyes (Fig. 3a). The mfERG waveforms were markedly decreased in amplitude and slightly increased in latency over a region consistent with the SAP defect (Fig. 3b). On the other hand, the fdOCT imaging did not provide conclusive evidence to justify a “Retina” diagnosis. Figure 3 highlights (in red) a region 5° inferior to the fovea, in which both the SAP and mfERG results are abnormal. There is a suggestion of subtle differences in the 3D macular scan through the corresponding retinal location, 5° superior to the fovea (red arrow in Fig. 3c). (Note: the dark regions shown by the yellow arrow are probably due to shadows from blood vessels.) The possible changes shown near the red arrow, which are characterized by subtle disorganization of the IS/OS junction, may be suggestive of a retinal abnormality. Nonetheless, these changes are inconspicuous and are not present throughout the region corresponding to the SAP defect. Consequently, the fdOCT was not sufficiently aberrant for us to be comfortable with a diagnosis of a retinal abnormality. The neuro-ophthalmologist has not yet determined the underlying etiology of the dysfunction.
Patient 4 is a 59-year-old man with a history of tobacco use, who experienced the sudden onset of blurred vision in both eyes 2 years prior to presentation. After approximately 20 min, peripheral vision returned to normal but his central vision remained blurred. He denied experiencing flashes of light, floaters and symptoms of amaurosis fugax. Emergency room evaluation, including CT scan of the brain, did not yield significant findings, and the patient was diagnosed with an ocular migraine versus a transient ischemic attack. BCVA was 20/30-2 in the right eye and 20/25 in the left eye. Fundoscopic examination did not reveal any abnormalities of the optic nerve, macula, vessels or periphery. SAP (10-2 program), as seen in Fig. 4a, demonstrated dense central scotomas in both eyes. The mfERG shows markedly reduced amplitude throughout the central 10° and latency at the upper limit of normal (Fig. 4b). This abnormality is consistent with the defect demonstrated by SAP. In addition, waveform amplitude is preserved outside the central 10°–20°, which is consistent with both the SAP and the patient's subjective complaints. Despite these findings, the fdOCT horizontal line scan through the fovea (Fig. 4c) does not show retinal abnormalities. The red line in Fig. 4a corresponds to the regions within the red boxes in the mfERG (Fig. 4b) and the fdOCT (Fig. 4c). Despite the apparent central defect on SAP and mfERG testing, the fdOCT line scan in this region appears normal. The etiology of this retinal defect remains unknown, however, given the patient's history of tobacco use, the differential diagnosis includes a paraneoplastic disorder. Although previous case reports of OCT findings in the setting of paraneoplastic disorders have demonstrated dramatic retinal thinning and loss of the highly reflective retinal layer, these findings were not present in this case [27].
Of the 20 eyes categorized as “Retina” based only on abnormal mfERG, the fdOCT was considered normal in 10 eyes and inconclusive in 10 eyes. Of the 10 eyes with normal fdOCT, 4 had SAP defects within the central 5°; diagnoses included no definitive diagnosis (2 eyes), age-related macular degeneration (1 eye) and cone–rod dystrophy versus autoimmune retinopathy (1 eye). Two of the 10 eyes had SAP defects outside the central 5° of the visual field; diagnosis was acute idiopathic blind spot enlargement (2 eyes). Also of note, the remaining 4 of 10 eyes with normal fdOCT had peripheral SAP defects that could not be visualized within the 6 mm × 6 mm fdOCT image frame; diagnoses included AZOOR (1 eye), calcific embolus (1 eye) and retinitis pigmentosa (2 eyes). The fdOCT of the remaining 10 eyes was considered inconclusive. Eight eyes had SAP defects within the central 5°; diagnoses included possible Stargardt disease (2 eyes), no definitive diagnosis (4 eyes) and cone–rod dystrophy (2 eyes). Two eyes had peripheral SAP defects, that is, they were outside of the central 5° of the visual field. The diagnoses included possible local vascular damage (1 eye) and no definitive diagnosis (1 eye).
Eyes classified as retinal based upon the fdOCT, but not the mfERG
Of the 52 eyes categorized as Retina (Table 1), 7 eyes, or 13.5%, were classified as Retina based only on the fdOCT, the mfERG was normal or inconclusive. Figures 5–7 present results for all 7 eyes (7 patients) involved.
Fig. 5.
Patient 5. a 24-2 SAP is without significant abnormalities, but with reduced foveal sensitivity in the right eye (33 dB). b mfERG with slightly reduced amplitude of foveal waveform in the right eye (blue waveform). c fdOCT demonstrates thickening of outer retina in the right eye. a–c Red boxes identify corresponding regions of the retina
Fig. 7.
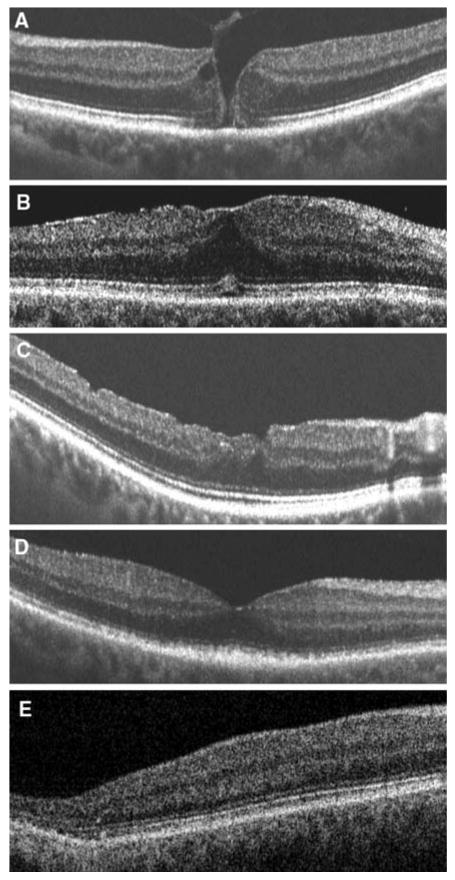
fdOCT of 5 patients with normal mfERG results, but abnormal fdOCT results. fdOCT demonstrates: a macular hole, b premacular fibrosis, c macular hole status post surgical repair, d disorganization of inner segment–outer segment junction (unknown diagnosis/lost to follow-up), e loss of inner segment-outer segment junction (no definitive diagnosis)
Subject 5 is a 50-year-old woman who presented with the gradual onset of blurred vision in the right eye. Visual acuity was 20/25 + 2 in the right eye and 20/20-2 in the left eye. The SAP (24-2) test was unremarkable in both eyes, with the exception of a reduced foveal sensitivity value (33 dB) in the right eye (Fig. 5a). In general, the mfERG appeared normal (Fig. 5b). Upon closer examination, the amplitude of the response to the central hexagon is slightly smaller for the right eye when compared to the left (inset Fig. 5b). This mfERG was classified as inconclusive as this difference is far too small to be considered significant statistically. The fdOCT imaging of the fovea, however, revealed a clearly identifiable retinal structural abnormality in the right eye (Fig. 5c). As above, the red rectangles show corresponding regions of the three tests. Fundoscopic examination revealed a vitelliform lesion of the macula. The patient was diagnosed with adult-onset vitelliform macular dystrophy, although this diagnosis is typically reserved for bilateral vitelliform lesions [11, 23–25, 28, 29].
Subject 6 is a 58-year-old man, who presented for the evaluation of a blind spot in the right eye, which had been present for 9 years and had not changed or progressed since the onset. Visual acuity was 20/25 in both eyes and Amsler grid testing revealed a small central scotoma, superior and temporal to fixation, in the right eye. Fundoscopic examination showed sharp discs, prominent choroidal pattern and a narrowed, irregular cilioretinal artery. Fluorescein angiography was negative and did not demonstrate underlying choroidal defects. Nonetheless, the initial differential diagnosis included vascular damage and atypical cone dystrophy. SAP (10-2), shown in Fig. 6a, is notable for a scotoma in the right eye, which was consistent with findings on Amsler grid testing. The red boxes in Fig. 6a–c highlight a region of the retina that extends from 2° temporal to fixation to 7° nasal to fixation. Although the mfERG appears to have grossly normal latency and amplitude in both eyes (Fig. 6b), closer examination of the mfERG in the region corresponding to the SAP defect demonstrates slightly reduced waveform amplitude in the right eye. This subtle mfERG finding was not deemed sufficient for a diagnosis of “Retina”. The fdOCT horizontal line scan, on the other hand, demonstrates dramatic thinning of the retina in the region of the SAP defect (Fig. 6c). This thinning appears to include the inner nuclear layer (INL), inner plexiform and RGC layers, but does not include the IS/OS junction. Based upon the irregular appearance of the cilioretinal artery, the neuro-ophthalmologist's working diagnosis is a cilioretinal artery occlusion.
Fig. 6.
Patient 6. a 10-2 SAP demonstrates scotoma in the right eye. b mfERG with slightly reduced waveform amplitude in the region corresponding to the SAP defect (red box). c fdOCT demonstrates dramatic thinning of the nasal retina in the right eye. a–c Red boxes identify corresponding regions of the retina
The fdOCT horizontal line scans for the remaining 5 patients with normal or inconclusive mfERGs and abnormal fdOCTs are shown in Fig. 7a–e. In all 7 cases, clear structural abnormalities are present. The majority (6 eyes) of the SAP defects were within 10° of fixation (Figs. 5, 6, 7a–d). Two of these SAP defects were <4° in size (Figs. 5, 7a) and three of these SAP defects were >4° in size (Figs. 6, 7b, d). One eye had a central SAP defect, however, this defect consisted of minimal dB losses of −2 to −3 dB (Fig. 7c). The remaining patient had a reasonable local peripheral defect seen on the 3D fdOCT (Fig. 7e) slice at about 10–15° temporal and 3.5° inferior to fixation.
The diagnoses for the 5 eyes in Fig. 7, as provided by their neuro-ophthalmologists, included: macular hole (1 eye; Fig. 7a); premacular fibrosis (1 eye; Fig. 7b); history of macular hole status post surgical repair (1 eye; Fig. 7c); unknown diagnosis/lost to follow-up (1 eye; Fig. 7d); and no definitive diagnosis (1 eye; Fig. 7e).
Discussion
We compared the ability of the mfERG and fdOCT to detect abnormalities of the retina. A priori, we did not expect these two tests, one functional and the other structural, to always be in agreement. In fact, about half (27) of the 52 eyes classified as having retinal defects were identified as retinal on only one of these two tests. Here, we consider the conditions under which these tests might not agree.
Why should the mfERG be normal/inconclusive when the fdOCT is abnormal?
We expected based upon previous work that small, local abnormalities of the retina would be missed on the mfERG. The spatial resolution of the mfERG topographic map may represent a significant limitation of this technique. Scotomas at least as small as 4° have been detected with this technique, however, there is no definitive evidence that scotomas smaller than 4° can be reliably detected [2, 30]. The presence of a scotoma of less than 4° seems to be the explanation for 2 of the 7 eyes/patients with normal/inconclusive mfERGs and clearly abnormal fdOCT. In contrast, SAP for all patients with both abnormal mfERG and abnormal fdOCT was characterized by defects larger than >4° degrees and within the central 10°. As previously mentioned, stray light may conceal retinal defects [1, 2, 5–8, 30], as will responses from healthy regions in situations where the defects are small relative to the size of the mfERG test hexagon. In fact, Sutter and Tran described the complications of light scattering within the eye, noting that even a small amount of scattered light can elicit a response from an unresponsive portion of the retina [1].
Because the mfERG, when recorded with the ISCEV protocol, has a relatively small contribution from the RGCs, retinal damage to the RGC layer will be hard to detect. Therefore, in the case of vascular damage to the retina, the mfERG is capable of revealing damage to the INL, but not the RGC layer. On the other hand, the fdOCT enables examination of both the RGC layer and the INL. In fact, the abnormalities in mfERGs following branch retinal artery occlusion (BRAO) can be subtle and may only be evident in second-order responses, which are heavily influenced by inner retina activity [5, 30]. The fdOCT, in which RGC layer and INL can be examined, is more likely to reveal damage. The results in Fig. 6, from the patient with presumed cilioretinal artery occlusion, are consistent with this hypothesis. In this case, the fdOCT clearly identifies retinal thinning, but this thinning is most apparent in the RGC layer, which contributes relatively little to the mfERG.
Why should the fdOCT be normal/inconclusive when the mfERG is abnormal?
First, compared to the mfERG, the fdOCT technology is new and the methods for analyzing the scans relatively crude. We chose to take a qualitative approach to identifying abnormalities, in part, because that is basically what is available for the fdOCT. However, we expect that, with time, some of the scans we considered inconclusive will be considered abnormal with either better analysis or improved scan quality. Figure 3c illustrates this point; subtle disorganization of the IS/OS junction may be present in the fdOCT scans, however, we cannot determine whether this is a true structural abnormality or an artifact secondary to poor scan quality. Figure 8 shows the fdOCT scans of two patients, both with markedly abnormal mfERG results and with clinical findings suggesting a diagnosis of Stargardt disease. Previous studies have documented central outer retinal thinning, including thinning of the retinal pigment epithelium and loss of the photoreceptor layer, in Stargardt patients who underwent evaluation with OCT [10, 19, 20, 31]. Although the horizontal line scan of one patient (Fig. 8a) shows clear structural changes in the IS/OS junction (within the red box), the horizontal line scan of the other patient (Fig. 8b), has a very subtle decrease in density of the IS/OS junction, which is more difficult to differentiate from a normal image. Interestingly, the SAP of the subject depicted in Fig. 8b had greater dB losses (>–10 dB) than that of the patient in Fig. 8a.
Fig. 8.
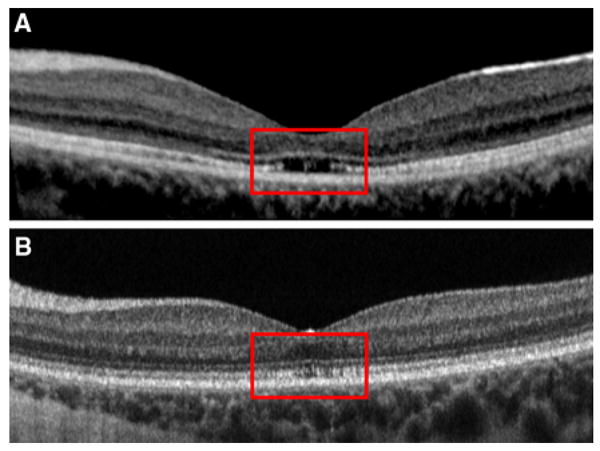
fdOCT of two patients presumed to have Stargardt disease: a fdOCT demonstrates clear loss of inner segment–outer segment junction at the fovea, b fdOCT demonstrates subtle reduction in density of inner segment–outer segment junction
We have other evidence that the IS/OS junction may appear reasonably good in the early stages of degenerative diseases of the receptors. In both Stargardt disease [31, 32] and RP [33], the IS/OS junction is present under conditions where the SAP loss is −8 dB or greater. In any case, of the 20 eyes (13 patients) with abnormal mfERG but normal/inconclusive fdOCT imaging, 17 eyes had SAP losses of greater than −8 dB and 3 eyes had SAP losses of less than −8 dB. Despite these substantial SAP losses in the majority of the eyes, fdOCT did not reveal damage consistent with the SAP defects. In contrast, as described earlier, of the eyes with normal mfERG and abnormal fdOCT, only 2 of 7 eyes had SAP losses of greater than −7 dB. Therefore, the SAP loss, by itself, was not a good predictor of whether damage appeared on the fdOCT in this study. Perhaps a quantitative analysis of the outer segment (OS) layer would be helpful in these patients. We found the OS layer was thinner in RP (see Fig. 4e in [34]) and Stargardt patients (see Fig. 3 in [31]) in regions where the IS/OS junction remained intact. It remains to be seen if improved quantification of the OS layer on fdOCT scans will enable earlier detection of retinal disease.
Having said this, we should expect some patients to show functional changes before fdOCT structural changes no matter how good the quality of the scan or the analysis. In particular, all causes of functional loss will not necessarily show up on fdOCT scans. For example, RP mutations affecting the visual cycle, as opposed to those affecting the structure of the rhodopsin molecule, may leave the receptors relatively intact in early stages of the disease. In fact, evidence is available that some patients with RPE65 can exhibit structural sparing [35]. It is difficult to know whether any of the eyes fall into this general category.
In summary, only 25 of the 52 eyes categorized as having an abnormal retina based upon the fdOCT and/or mfERG test were abnormal on both tests. We suspect that with more experience and better methods, the number of disagreements can be substantially reduced. However, it is clear that structural and functional tests will never be in complete agreement. On one hand, the mfERG will miss small lesions due to stray light limits on its spatial resolution and will miss local inner retinal damage due to a very small contribution from the RGC layer. On the other hand, in some cases, the functional damage may appear before a structural change is detected on the fdOCT. In addition, there are circumstances in which structural damage appears more extensive than functional damage. Of course, together the fdOCT and mfERG tests provide a powerful way to identify the locus and cause of retinal damage. From a practical point of view, the fdOCT is easier on the patient and quicker to obtain than is the mfERG, and probably should be performed first.
Acknowledgments
We would like to thank Drs. Behrens, Bortz, Forman, Kostina-O'Neil, Lesser and Moazami for patient referrals. This study was supported by funds from EY09076 and 02115.
Contributor Information
Elizabeth A. Dale, Department of Psychology, Columbia University, 405 Schermerhorn, New York, NY 10027, USA; Department of Ophthalmology, Columbia University College of Physicians and Surgeons, New York, NY, USA
Donald C. Hood, Email: dch3@columbia.edu, Department of Psychology, Columbia University, 405 Schermerhorn, New York, NY 10027, USA; Department of Ophthalmology, Columbia University College of Physicians and Surgeons, New York, NY, USA.
Vivienne C. Greenstein, Department of Ophthalmology, Columbia University College of Physicians and Surgeons, New York, NY, USA
Jeffrey G. Odel, Department of Ophthalmology, Columbia University College of Physicians and Surgeons, New York, NY, USA
References
- 1.Sutter EE, Tran D. The full field topography of ERG components in man—I. The photopic luminance response. Vision Res. 1992;32(3):433–446. doi: 10.1016/0042-6989(92)90235-b. [DOI] [PubMed] [Google Scholar]
- 2.Hood DC. Assessing retinal function with the multifocal technique. Prog Retin Eye Res. 2000;19(5):607–646. doi: 10.1016/s1350-9462(00)00013-6. [DOI] [PubMed] [Google Scholar]
- 3.Hood DC, Bach M, Brigell M, Keating D, Kondo M, Lyons JS, Palmowski-Wolfe AM. ISCEV guidelines for clinical multifocal electroretinography (2007 edition) Doc Ophthalmol. 2008;116(1):1–11. doi: 10.1007/s10633-007-9089-2. [DOI] [PMC free article] [PubMed] [Google Scholar]
- 4.Hood DC, Frishman LJ, Saszik S, Viswanathan S. Retinal origins of the primate multifocal ERG: implications for the human response. Invest Ophthalmol Vis Sci. 2002;43(5):1673–1685. [PubMed] [Google Scholar]
- 5.Shimada Y, Horiguchi M. Stray light-induced multifocal electroretinograms. Invest Ophthalmol Vis Sci. 2003;44(3):1245–1251. doi: 10.1167/iovs.02-0527. [DOI] [PubMed] [Google Scholar]
- 6.Wirth A, Zetterstrom B. Effect of area and intensity on the size and shape of the electroretinogram; exclusion of stray light effects. Br J Ophthalmol. 1954;38(5):257–265. doi: 10.1136/bjo.38.5.257. [DOI] [PMC free article] [PubMed] [Google Scholar]
- 7.Boynton RM. Stray light and the human electroretinogram. J Opt Soc Am. 1953;43(6):442–449. doi: 10.1364/josa.43.000442. [DOI] [PubMed] [Google Scholar]
- 8.Bearse MA, Sutter EE. Imaging localized retinal dysfunction with the multifocal electroretinogram. J Opt Soc Am A Opt Image Sci Vis. 1996;13(3):634–640. doi: 10.1364/josaa.13.000634. [DOI] [PubMed] [Google Scholar]
- 9.Sakata LM, Deleon-Ortega J, Sakata V, Girkin CA. Optical coherence tomography of the retina and optic nerve–a review. Clin Experiment Ophthalmol. 2009;37(1):90–99. doi: 10.1111/j.1442-9071.2009.02015.x. [DOI] [PubMed] [Google Scholar]
- 10.Lim JI, Tan O, Fawzi AA, Hopkins JJ, Gil-Flamer JH, Huang D. A pilot study of Fourier-domain optical coherence tomography of retinal dystrophy patients. Am J Ophthalmol. 2008;146(3):417–426. doi: 10.1016/j.ajo.2008.05.018. [DOI] [PMC free article] [PubMed] [Google Scholar]
- 11.Wirtitsch MG, Ergun E, Hermann B, Unterhuber A, Stur M, Scholda C, Sattmann H, Ko TH, Fujimoto JG, Drexler W. Ultrahigh resolution optical coherence tomography in macular dystrophy. Am J Ophthalmol. 2005;140(6):976–983. doi: 10.1016/j.ajo.2005.06.029. [DOI] [PubMed] [Google Scholar]
- 12.Hughes EH, Siow YC, Hunyor AP. Acute macular neuroretinopathy: anatomic localisation of the lesion with high-resolution OCT. Eye. 2009;23(11):2132–2134. doi: 10.1038/eye.2008.430. [DOI] [PubMed] [Google Scholar]
- 13.Feigl B, Haas A. Optical coherence tomography (OCT) in acute macular neuroretinopathy. Acta Ophthalmol Scand. 2000;78(6):714–716. doi: 10.1034/j.1600-0420.2000.078006714.x. [DOI] [PubMed] [Google Scholar]
- 14.Chan WM, Liu DT, Tong JP, Law RW, Lam DS. Longitudinal findings of acute macular neuroretinopathy with multifocal electroretinogram and optical coherence tomography. Clin Experiment Ophthalmol. 2005;33(4):439–442. doi: 10.1111/j.1442-9071.2005.01006.x. [DOI] [PubMed] [Google Scholar]
- 15.Turgot B, Turkcuoglu P, Serder Koca S, Aydemir O. Detection of the regression on hydroxychloroquine retinopathy in optical coherence tomography. Clin Rheumatol. 2009;28(5):607–609. doi: 10.1007/s10067-009-1108-0. [DOI] [PubMed] [Google Scholar]
- 16.Rodriguez-Padilla JA, Hedges TR, III, Monson B, Srinivansan V, Wojtkowski M, Reichel E, Duker JS, Schuman JS, Fujimoto JG. High-speed ultra-high-resolution optical coherence tomography findings in hydroxychloroquine retinopathy. Arch Ophthalmol. 2007;125(6):775–780. doi: 10.1001/archopht.125.6.775. [DOI] [PMC free article] [PubMed] [Google Scholar]
- 17.Kellner U, Kellner S, Weinitz S. Chloroquine retinopathy: lipofuscin- and melanin-related fundus autofluorescence, optical coherence tomography and multifocal electroretinography. Doc Ophthalmol. 2008;116(2):119–123. doi: 10.1007/s10633-007-9105-6. [DOI] [PubMed] [Google Scholar]
- 18.Kellner S, Weinitz S, Kellner U. Spectral domain optical coherence tomography detects early stages of chloroquine retinopathy similar to multifocal electroretinography, fundus autofluorescence and near-infrared autofluorescence. Br J Ophthalmol. 2009;93(11):1444–1447. doi: 10.1136/bjo.2008.157198. [DOI] [PubMed] [Google Scholar]
- 19.Gerth C, Zawadzki RJ, Choi SS, Keltner JL, Park SS, Werner JS. Visualization of lipofuscin accumulation in Stargardt macular dystrophy by high-resolution Fourier-domain optical coherence tomography. Arch Ophthalmol. 2007;125(4):575. doi: 10.1001/archopht.125.4.575. [DOI] [PubMed] [Google Scholar]
- 20.Ergun E, Hermann B, Wirtitsch M, Unterhuber A, Ko TH, Sattmann H, Scholda C, Fujimoto JG, Stur M, Drexler W. Assessment of central visual function in Stargardt's disease/fundus flavimaculatus with ultrahigh-resolution optical coherence tomography. Invest Ophthalmol Vis Sci. 2005;46(1):310–316. doi: 10.1167/iovs.04-0212. [DOI] [PubMed] [Google Scholar]
- 21.Furino C, Boscia F, Cardascia N, Sborgia L, Sborgia C. Fundus autofluorescence, optical coherence tomography and visual acuity in adult-onset foveomacular dystrophy. Ophthalmologica. 2008;222(4):240–244. doi: 10.1159/000130427. [DOI] [PubMed] [Google Scholar]
- 22.Petropoulos IK, Desmangles PM, Matter MA. Spectral optical coherence tomography findings in adult-onset foveomacular vitelliform dystrophy. Klin Monatsbl Augenheilkd. 2008;255(5):488–490. doi: 10.1055/s-2008-1027309. [DOI] [PubMed] [Google Scholar]
- 23.Saito W, Yamamoto S, Hayashi M, Ogata K. Morphological and functional analyses of adult onset vitelliform macular dystrophy. Br J Ophthalmol. 2003;87(6):758–762. doi: 10.1136/bjo.87.6.758. [DOI] [PMC free article] [PubMed] [Google Scholar]
- 24.Benhamou N, Souied EH, Zolf R, Coscas F, Coscas G, Soubrane G. Adult-onset foveomacular vitelliform dystrophy: a study by optical coherence tomography. Am J Ophthalmol. 2003;135(3):362–367. doi: 10.1016/s0002-9394(02)01946-3. [DOI] [PubMed] [Google Scholar]
- 25.Pierro L, Tremolada G, Introini U, Calori G, Brancato R. Optical coherence tomography findings in adult-onset foveomacular vitelliform dystrophy. Am J Ophthalmol. 2002;134(5):675–680. doi: 10.1016/s0002-9394(02)01685-9. [DOI] [PubMed] [Google Scholar]
- 26.Hood DC, Wladis EJ, Shady S, Holopigian K, Li J, Seiple W. Multifocal rod electroretinograms. Invest Ophthalmol Vis Sci. 1998;39(7):1152–1162. [PubMed] [Google Scholar]
- 27.Mohamed Q, Harper CA. Acute optical coherence tomographic findings in cancer-associated retinopathy. Arch Ophthalmol. 2007;125(8):1132–1133. doi: 10.1001/archopht.125.8.1132. [DOI] [PubMed] [Google Scholar]
- 28.Do P, Ferrucci S. Adult-onset foveomacular vitelliform dystrophy. Optometry. 2006;77(4):156–166. doi: 10.1016/j.optm.2006.01.020. [DOI] [PubMed] [Google Scholar]
- 29.Gass JDM. A clinicopathologic study of a peculiar foveomacular dystrophy. Trans Am Ophthalmol Soc. 1974;72:139–156. [PMC free article] [PubMed] [Google Scholar]
- 30.Hood DC, Odel JG, Chen CS, Winn BJ. The multifocal electroretinogram. J Neuroophthalmol. 2003;23(3):225–235. doi: 10.1097/00041327-200309000-00008. [DOI] [PubMed] [Google Scholar]
- 31.Gomes NL, Greenstein VC, Carlson JN, Tsang SH, Smith RT, Carr RE, Hood DC, Chang S. A comparison of fundus autofluorescence and retinal structure in patients with Stargardt disease. Invest Ophthalmol Vis Sci. 2009;50(8):3953–3959. doi: 10.1167/iovs.08-2657. [DOI] [PMC free article] [PubMed] [Google Scholar]
- 32.Greenstein VC, Carlson JN, Wang M, Tsang SH, Smith RT, Carr RE, Hood DC. A comparison of retinal structure and visual function in foveal and preferred retinal location regions of patients with Stargardt disease. Poster presented at the annual meeting of the Association for research in vision and ophthalmology (ARVO); Fort Lauderdale, Florida. 3–7 May 2009.2009. [Google Scholar]
- 33.Rangaswamy NV, Hood DC, Birch DG, Locke KG. A comparison of visual field sensitivity to photoreceptor thickness in retinitis pigmentosa (RP). Poster presented at the annual meeting of the Association for research in vision and ophthalmology (ARVO); Fort Lauderdale, Florida. 3–7 May 2009.2009. [Google Scholar]
- 34.Hood DC, Lin CE, Lazow MA, Locke KG, Zhang X, Birch DG. Thickness of receptor and post-receptor retinal layers in patients with retinitis pigmentosa measured with frequency-domain optical coherence tomography. Invest Ophthalmol Vis Sci. 2009;50(5):2328–2336. doi: 10.1167/iovs.08-2936. [DOI] [PMC free article] [PubMed] [Google Scholar]
- 35.Jacobson SG, Cideciyan AV, Aleman TS, Sumaroka A, Windsor EA, Schwartz SB, Heon E, Stone EM. Photoreceptor layer topography in children with leber congenital amaurosis caused by RPE65 mutations. Invest Ophthalmol Vis Sci. 2008;49(10):4573–4577. doi: 10.1167/iovs.08-2121. [DOI] [PMC free article] [PubMed] [Google Scholar]