Abstract
Leprosy is an infectious disease in which the clinical manifestations correlate with the type of immune response mounted to the pathogen, Mycobacterium leprae. To investigate which biological pathways or gene sets are over-represented in lepromatous (L-Lep) versus tuberculoid (T-Lep) patients that might be relevant in disease pathogenesis, we compared the gene expression profiles of L-lep versus T-lep skin lesions using knowledge-guided bioinformatic analysis, incorporating data on likely biological functions, including gene ontology information and regulatory data. Analysis of probe sets comparatively increased in expression in L-lep versus T-lep revealed multiple pathways and functional groups involving B-cell genes (P values all < 0·005) relevant to the dataset. Further pathways analysis of B-cell genes comparatively increased in expression in L-lep versus T-lep lesions revealed a potential network linking the expression of immunoglobulin M (IgM) and interleukin-5 (IL-5). Analysis of the leprosy lesions by immunohistology indicated that there was approximately 8% more IgM-positive cells in L-lep lesions than in T-lep lesions. Furthermore, IL-5 synergized in vitro with M. leprae to enhance total IgM secretion from peripheral blood mononuclear cells. This pathways analysis of leprosy in combination with our in vitro studies implicates a role for IL-5 in the increased IgM at the site of disease in leprosy.
Keywords: B cells, interleukin-5, immunoglobulin, leprosy
Introduction
Leprosy, caused by the intracellular pathogen Mycobacterium leprae, offers an excellent model for investigating the regulation of immune responses to infection because it presents as a clinical/immunological spectrum,1 providing an opportunity to study self-limited versus progressive infection. At one end of the disease spectrum, patients with tuberculoid leprosy (T-lep) typify the resistant response that restricts the growth of the pathogen. The number of lesions is few and bacilli are rare, although tissue and nerve damage are frequent. At the opposite end of this spectrum, patients with lepromatous leprosy (L-lep) represent susceptibility to disseminated infection. Skin lesions are numerous and growth of the pathogen is unabated.
These polar clinical presentations correlate with the level of cell-mediated immunity against M. leprae, as well as with the cytokine patterns in the skin lesions, with type 1 [interleukin-12 (IL-12) and interferon-γ] patterns found in T-lep lesions and type 2 (IL-4, IL-5 and IL-10) in L-lep lesions.2–4 In fact, type 2 cytokines such as IL-4 and IL-10 have negative immunoregulatory roles in the context of infection,5,6 and antibody responses are greater in lepromatous patients, suggesting that humoral immunity is not protective. In fact, immune complex deposition is thought to contribute to the pathogenesis of acute inflammatory reactions such as erythema nodosum leprosum (ENL), revealed by the detection of immune complexes in vessel walls and by evidence of damaged endothelial cells,7 as well as granular deposits of immunoglobulin and complement in a perivascular8 and extravascular distribution.9 To gain insight into potential pathways contributing to progressive infection with M. leprae, we performed pathways analysis on gene expression profiles comparing L-lep and. T-lep skin lesions.
Methods
Patients and clinical specimens
The acquisition of all specimens was approved by the committees on investigations involving human subjects of the University of California, Los Angeles. Patients with leprosy were classified according to the criteria of Ridley and Jopling.1 Scalpel or punch skin biopsy specimens were obtained after informed consent from five patients with tuberculoid leprosy and five patients with lepromatous leprosy at the time of diagnosis. Specimens were embedded in OCT medium (Ames, Elkhart, IN), snap-frozen in liquid nitrogen and stored at − 80° until sectioning.
Pathways analysis of gene expression data
The canonical pathways and functional groups analyses of differentially expressed genes in L-lep versus T-lep10 (NCBI GEO website accession number GSE443) were performed through the use of Ingenuity Pathways Analysis (Ingenuity® Systems, version 7.5, http://www.ingenuity.com). Probe sets that comparatively increased in expression in L-lep versus T-lep and that met a P-value cutoff of 0·05 and a fold change of 1·2 were included in the analysis. Fischer's exact test was used to calculate a P-value determining the probability that each canonical pathway or functional group of genes was due to chance alone.
Antibodies
The following antibodies were used for immunohistochemical studies: G20-127 [anti-immunoglobulin M (anti-IgM); BD Biosciences, San Diego, CA], Mc24-2E11 (anti-IgA, Serotec, Raleigh, NC), DL101 (anti-CD138, e-bioscience, San Diego, CA) and IgG controls (Sigma, St. Louis, MO).
Immunoperoxidase and immunofluoresence labelling
Immunoperoxidase labelling of cryostat sections was performed as described previously.11 Double immunofluorescence was performed by serially incubating sections with mouse anti-human monoclonal antibodies (against CD138 marker) followed by incubation with isotype-specific fluorochrome (Alexa 488; Invitrogen, Carlsbad, CA). Sections were then washed and incubated with anti-IgM, followed by an Alexa 568-conjugated anti-mouse IgG1 (Invitrogen). Controls were performed as described.12
Confocal microscopy
Double immunofluorescence of sections and cells was examined with a Leica-TCS-SP inverted confocal laser scanning microscope fitted with krypton and argon lasers. Sections and cells were illuminated with 488 and 568 nm of light after filtering through an acoustic optical device. Images decorated with Alexa 488 and Alexa 568 were recorded simultaneously through separate optical detectors with a 530-nm band-pass filter and a 590-nm long-pass filter, respectively. Pairs of images were superimposed for co-localization analysis. Sections stained with DAPI were examined using the multi-photon laser system tuned to 770 to generate UV excitation.
Stimulation of IgM
Peripheral blood mononuclear cells (PBMC) were purified using Ficoll–Hypaque (Pharmacia Biotech AB, Uppsala, Sweden) gradient centrifugation and then B cells were purified by magnetic column separation (Stem Cell Technologies, Vancouver, BC, Canada). Purity of B cells was confirmed by CD19 expression with 99% purity by flow cytometric analysis. Triplicate wells of PBMC or B cells were plated in 96-well round-bottom plates with medium or IL-5 (50 ng/ml) in the presence or absence of M. leprae sonicate (10 μg/ml) for 10 days. Total immunoglobulin isotypes (IgM, IgG, IgA) were measured by enzyme-linked immunosorbent assay (Bethyl labs, Montgomery, TX).
Results
Canonical pathways and functional groups represented in the differential gene expression profiles of L-lep versus T-lep skin lesions
To detect which gene sets or biological pathways are differentially over-represented in progressive (L-lep) versus self-limited (T-lep) infection, which might be particularly relevant to disease pathogenesis, we re-analysed our existing gene expression profile data, obtained from L-lep and T-lep skin lesions10 using knowledge-guided bioinformatic analysis and incorporating data on likely biological functions, including gene ontology information and regulatory data (Ingenuity® Systems, http://www.ingenuity.com) (Figs 1 and 2). Within the top 15 canonical pathways (Fig. 1a) and the top 20 functional groups (Fig. 2a) that were represented in genes expressed in L-lep versus T-lep, we identified a number of B-cell-related genes that belonged to the canonical pathway, B-cell receptor signalling and the functional groups, ‘proliferation of B lymphocytes’ and ‘quantity of B lymphocytes’. Pathways analysis of comparatively increased genes expressed in T-lep versus L-lep lesions revealed no B-cell functional groups or pathways (Figs 1b and 2b). Further investigation of pathways involving B cells revealed a number of functional groups involving genes related to B cells and their function (Fig. 3). In addition, the second highest biological function in the category of ‘physiological system development and function’ was identified as ‘Humoral Immune Response’. In summary, the bioinformatics analysis of L-lep versus T-lep lesions according to biological pathways revealed the differential expression of genes involved with B-cell function at the site of disease, suggesting a role for B cells and immunoglobulins in progressive infection with M. leprae.
Figure 1.
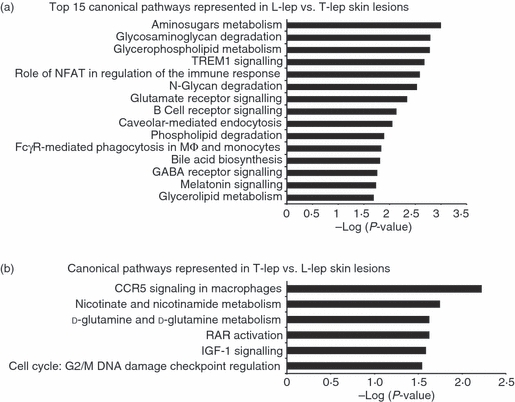
Enriched canonical pathways in the spectrum of leprosy. The canonical pathways analysis was generated through the use of Ingenuity Pathways Analysis (http://www.ingenuity.com). (a) The top 15 canonical pathways in lepromatous leprosy (L-lep) versus tuberculoid leprosy (T-lep) are ranked by their P-values (x-axis). (b) All canonical pathways in T-lep versus L-lep are ranked by their P-values (x-axis). Fischer's exact test was used to calculate a P-value determining the probability that each pathway represented by the expression data was due to chance alone.
Figure 2.
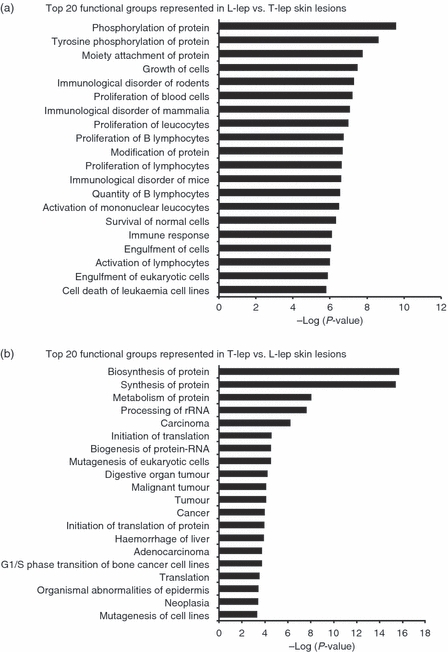
Enriched functional groups in the spectrum of leprosy. The functional groups analysis was generated through the use of Ingenuity Pathways Analysis (http://www.ingenuity.com). The top 20 biological functions in lepromatous (L-lep) versus tuberculoid (T-lep) leprosy (a) and in T-lep versus L-lep (b) are ranked by their P-values (x-axis). Fischer's exact test was used to calculate a P-value determining the probability that each pathway represented by the expression data was due to chance alone.
Figure 3.
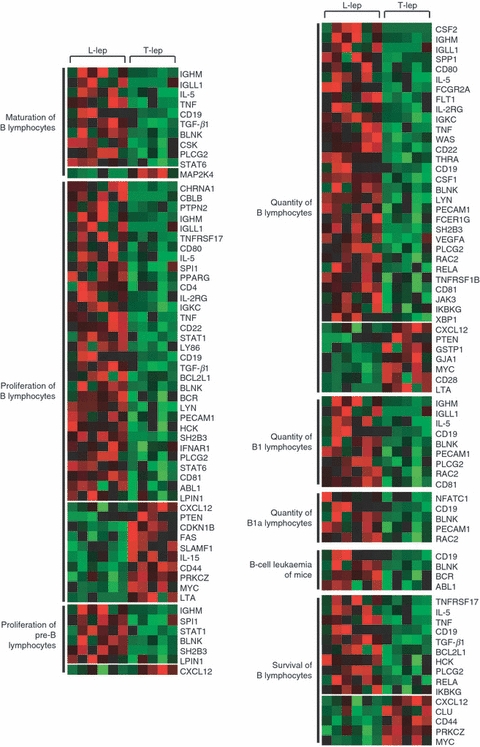
Functional groups represented in lepromatous (L-lep) versus tuberculoid (T-lep) leprosy involving B cells. The functional groups involving B cells from pathways analysis are shown with each row of red and green squares representing the gene expression profile of a particular probe corresponding to the gene listed. Individual squares represent the relative gene expression intensity of the given gene in a patient with red being relatively increased in expression and green relatively decreased in expression. All functional groups shown met a P-value < 0·005 by Fischer's exact test, determining the probability that the given functional pathway represented by the expression data was due to chance alone.
Pathways involving IGHM
To further investigate the role of B cells in progressive infection, we focused our attention on the immunoglobulins. A search for all immunoglobulin genes revealed the differentially increased expression of IGHM (IgM, fold change = 4.9, P < 0.05), IGHG1 (IgG1, fold change = 9.7, P < 0.05) and IGHA1/IGHA2 (IgA, fold change = 4.6, P < 0.05) in L-lep versus T-lep lesions. Furthermore, IGBP1, the immunoglobulin-binding protein 1 (CD79A) gene, which associates with the B-cell receptor complex, was also increased in expression (fold change 1·6, P < 0·05). To identify potential pathways for increased IgM, we explored the relationships contained within the Ingenuity knowledge base between all B-cell genes (Fig. 3) that were comparatively increased in expression in L-lep versus T-lep lesions and IGHM (Fig. 4). Of all the genes with a first-level interaction with IGHM, only IL5 has been reported to induce IGHM expression. Therefore, the pathways analysis of genes differentially expressed in leprosy lesions according to biological pathways revealed the up-regulation and interaction between IGHM and IL5, providing a potential pathway to explain the increased IgM expression observed in L-lep skin lesions.
Figure 4.
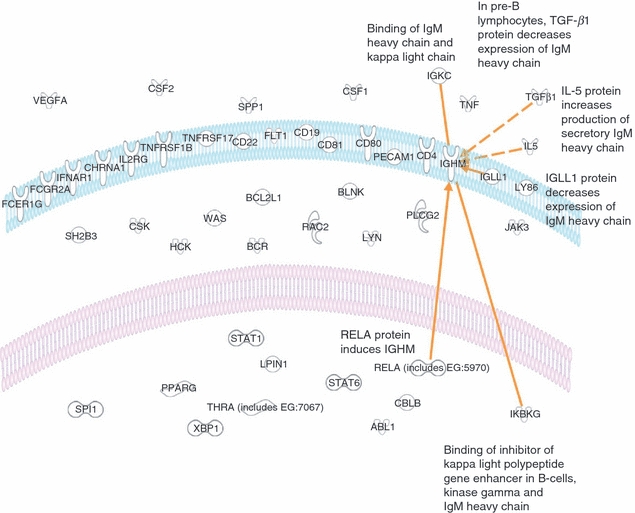
Diagram illustrating the cellular location and relationships. Each of the genes identified by analysis of functional groups involving B cells is shown. Further analysis of relationships between all B-cell genes and IGHM revealed six relationships (orange lines or arrows) requiring no additional nodes.
IgM and IgA expression in leprosy tissue
To confirm the microarray results we determined the expression of IgM and IgA across the spectrum of leprosy in skin lesions from five T-lep patients and five L-lep patients. Using a monoclonal antibody specific for IgM and IgA and immunohistological techniques, we found that IgM and IgA were more abundant in lesions from patients with lepromatous leprosy, those with the disseminated form of the disease – accounting for 8% of the cells in the infiltrate compared with < 2% of the cells in lesions from patients with T-lep (Fig. 5). These results correlate the expression of IgM and IgA in leprosy with the clinical form of the disease – being greatest in those patients in whom the disease is disseminated – and, by inference, also correlate with the T helper type 2 immunity to the pathogen.
Figure 5.
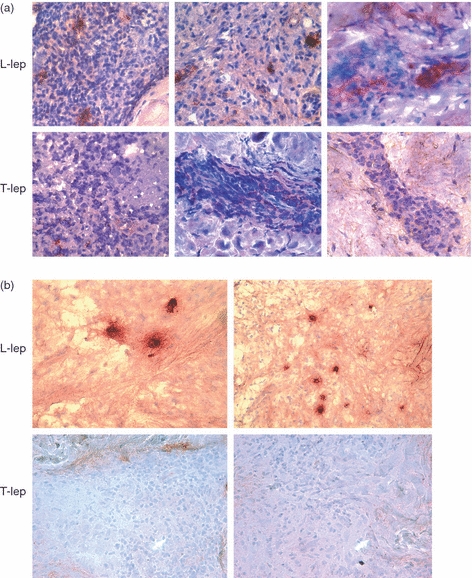
Immunoglobulin M (IgM) and IgA expression in leprosy lesions (T-lep, tuberculoid leprosy lesions; L-lep, lepromatous leprosy lesions). Representative sections from skin biopsy specimens of tuberculoid and lepromatous lesions stained by the immunoperoxidase method with monoclonal antibodies specific for IgM (a) and IgA (b). Multiple IgM- and IgA-positive cells were identified in the dermis of L-lep patients. In contrast, IgM- and IgA-positive cells were infrequent in the T-lep patients. Original magnification: × 400.
IgM-positive cells in leprosy lesions co-localize with a plasma cell marker
We reasoned that immunoglobulins should be expressed on mature B cells or plasma cells so we examined the expression of CD138, a specific marker for plasma cells in leprosy tissue, using immunoperoxidase. Plasma cells were more abundant in L-lep patients, accounting for approximately 15% of the cells in the infiltrate. In contrast, CD138-expressing cells were rare or absent in T-lep lesions (Fig. 6a). To identify the phenotype of the cells containing IgM at the site of disease in leprosy, we performed two-colour immunofluorescence labelling using a monoclonal antibody that detected mature B cells followed by confocal laser scanning microscopy. Double immunofluorescence labelling showed that cells containing IgM in L-lep lesions were plasma cells (Fig. 6b).
Figure 6.
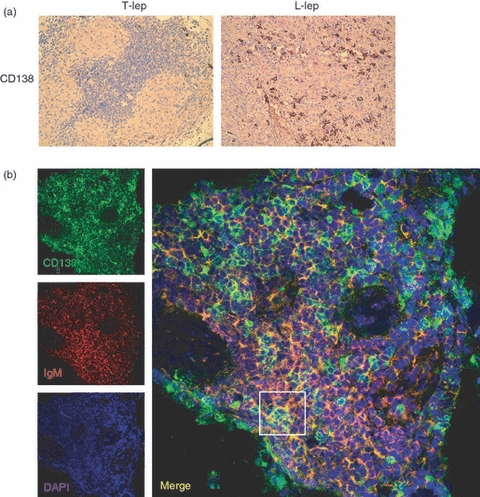
Plasma cells (CD138) are more frequent in lepromatous (L-lep) than in tuberculoid (T-lep) leprosy lesions and co-localize with immunoglobulin M (IgM). (a) Immunoperoxidase staining of sections demonstrates plasma cells in the dermis of lepromatous patients. In contrast, CD138-positive cells were infrequent in the tuberculoid patients. (b) IgM-expressing cells were characterized for cell lineage using two-colour immunofluorescence confocal laser microscopy in leprosy tissue. Double-immunofluorescence labelling with IgM (left, red panel) and CD138 (left, green panel) demonstrate co-localization of IgM with CD138-positive plasma cells (right panel). Original magnification × 630.
Effect of IL-5 on M. leprae activation of B cells
We hypothesized that increased IL-5 in addition to the mycobacteria at the site of disease may play a role in increasing the production of antibodies by B cells. B cells were purified from healthy donors and stimulated with M. leprae sonicate in the presence or absence of IL-5. Neither individually nor in combination did these stimuli enhance the production of total IgM, IgG or IgA. However, when added to PBMC cultures, M. leprae-stimulated cells produced almost 20 times more IgM in the presence of IL-5 whereas there was no significant difference in IgA or IgG production (Fig. 7). While PBMC with added IL-5 showed a trend toward increased IgA and IgG, these increases were not statistically significant. These studies suggest a role for IL-5 and T cells in the ability of M. leprae to stimulate IgM production from B cells.
Figure 7.
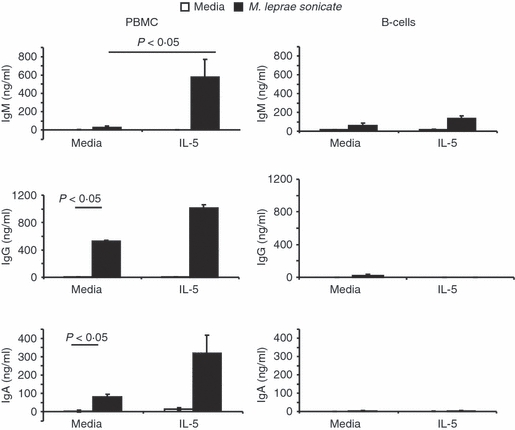
Interleukin-5 (IL-5) and Mycobacterium leprae sonicate synergistically enhance production of total immunoglobulin M (IgM) but not IgA or IgG. Peripheral blood mononuclear cells (left) or purified B lymphocytes (right) from normal healthy subjects were cultured in triplicate with media or IL-5 (50 ng/ml) in the presence or absence of M. leprae sonicate (10 mg/ml) for 10 days. Total immunoglobulin was measured by enzyme-linked immunosorbent assay. Averages ± SEM of triplicate cultured wells are shown. Statistical analysis used Student's t-test.
Discussion
To investigate the pathways and functional gene sets that are differentially expressed across the spectrum of leprosy, we performed pathways analysis of gene expression profiles comparing leprosy lesions from patients with progressive (L-lep) versus self-limited (T-lep) infections.10 Using analysis of canonical pathways and functional groups, we found that B-cell pathways recurred in the top gene sets (P < 0·005) in the progressive L-lep form of the disease where antibody levels, including those of IgM, are high. Pathways analysis of IgM production at the site of disease suggested a role for IL-5. These data together with our in vitro findings indicate a local inflammatory mechanism linking IL-5, M. leprae, T cells and B cells to the relatively increased IgM observed in L-lep lesions.
The expression of IL-5 and B-cell markers and of functional genes in L-lep lesions is consistent with the overall T helper type 2 cytokine pattern in L-lep lesions compared with T-lep lesions,3 as well as the elevated systemic humoral response that is prominent in L-lep patients.13,14 The polar L-lep and T-lep clinical presentations correlate with the level of cell-mediated immunity against M. leprae, as well as the cytokine patterns in the skin lesions, with Th2 cytokines (IL-4, IL-5 and IL-10) expressed in L-lep lesions and Th1 cytokines (IL-2 and IFN-γ) in T-lep lesions [2–4]. In fact, type 2 cytokines such as IL-4 and IL-10 have negative immunoregulatory roles in the context of infection [5, 6], and antibody responses are greater in lepromatous patients, suggesting that humoral immunity is not protective. Linking the gene expression data at the site of disease,3,10 our in vitro data suggest that the effects of IL-5 on increased IgM secretion from B cells requires the presence of T cells, because only PBMC, but not purified B cells, resulted in increased IgM in response to IL-5 (Fig. 7). Although several in vitro studies have shown that IL-5 enhances IgA production by activated B cells either alone or with transforming growth factor-β, we did not observe any statistically significant enhancement of IgA production in cultures supplemented with IL-5.15–18 However, TGF-newb1 gene expression is increased in L-lep versus T-lep lesions (fold change 1.9, P < 0.005), which may provide a mechanism for the comparatively increased IgA detected in the L-lep lesions. In addition, Mizoguchi et al.19 showed that IL-5 can elicit the maturation of CD40-activated B cells to IgM-secreting cells in LPS-activated B cells. Lastly, Bertolini et al. showed that IL-5 can augment Staphylococcal A Cowan I strain-stimulated purified human B lymphocytes to produce IgM, but not IgA or IgG, and our result suggesting a T-cell requirement is consistent with their finding that IL-5 effects are enhanced in co-operation with IL-2.20,21
The presence of B cells in leprosy tissue was initially described by Ridley.22 Subsequently, B cells were identified by the expression of CD20 (cell surface marker for immature and mature circulating B cells), CD79 (associates with the B-cell receptor complex), and CD138 (cell surface marker for plasma cells) in active lesions from L-lep patients.23 Consistent with our gene expression data, we found that B cells, and specifically plasma cells, are expressed at the site of infection in leprosy and are 15% more abundant in L-lep lesions than in T-lep lesions. We were able to demonstrate by immunolabelling that surface IgM and IgA were consistently expressed within L-lep lesions. By confocal microscopy we showed that CD138+ plasma cells co-localize with IgM+ cells, indicating production of IgM antibodies by mature B cells at the site of disease.
The elevated levels of serum antibodies in patients with L-lep or disseminated disease, compared with the levels found in patients with the T-lep self-limited form,13,14 and the antibodies shown in this study at the site of disease may contribute to host defence or immunopathology. The correlation of antibodies with the progressive infection suggests that they play no role in protection but some suggest an early role in leprosy and other mycobacterial infections.24,25 The production of antibodies at the site of disease demonstrated in this study may also contribute to immunopathology and tissue injury in leprosy. Polyclonal activation of B cells has been well described in leprosy. In fact, studies of leprosy sera have identified a wide spectrum of autoantibodies such as anticardiolipin (aCL), rheumatoid factor and antiphospholipid antibodies. Autoantibodies such as aCL have been reported to be raised in 37–98% of the patients with lepromatous leprosy, providing a mechanism for autoimmunity.26–28 Furthermore, up to 50% of L-lep patients receiving antimicrobial therapy develop acute inflammatory reactions such as ENL, characterized by the eruption of erythematous painful nodules and other systemic manifestations of tissue injury.7,29–31 The pathogenesis of ENL is attributed to antibodies and immune complex deposition, as evidenced by granular deposits of immunoglobulin and complement in a perivascular8 and extravascular distribution,9 detection of immune complexes in vessel walls and evidence of damaged endothelial cells.7
An interesting finding is the differential expression of IgA in L-lep versus T-lep lesions. Anti-M. leprae IgA has been previously reported in salivary secretions of leprosy patients,32 and the presence of IgA as well as IgG and IgM has previously been identified from induced blisters over skin lesions from patients with L-lep and ENL.33 Here, we found a correlation of both the messenger RNA and protein levels of IgA, with L-lep versus T-lep directly in skin lesions, suggesting a role for antibodies including promoting progressive infection. Immunoglobulin A has been described as playing a central role in mucosal immunity, classically as neutralizing microbial pathogens and preventing their attachment to mucosal tissue. However, its role in systemic and cutaneous immunity is not well-studied. The immunoregulatory effects of IgA are mediated by the human IgA Fc receptor (FcαRI, CD89). FcαRI is expressed on cells of the myeloid lineage including neutrophils, monocytes, tissue macrophages, eosinophils and subpopulations of dendritic cells. A number of studies have suggested an anti-inflammatory function for IgA and FcαRI by suppressing neutrophil chemotaxis, down-regulating the generation of reactive oxygen species, neutralizating lipopolysaccharide, and inducing the IL-1 receptor antagonist, which correlates with the permissive environment at the site of disease in L-lep patients.34–36 Despite these anti-inflammatory properties of IgA, its deposition in the skin is observed in inflammatory dermatoses such as blistering diseases and Henoch–Schönlein purpura and is associated with neutrophil infiltration and tissue injury. The IgA-induced pro-inflammatory properties include promoting the release of pro-IL-1β and FcαRI cross-linking can induce tumour necrosis factor-α and IL-6 from PBMC.37,38 Therefore, the presence of IgA in L-lep skin lesions may also promote the acute inflammation observed in patients developing ENL from L-lep. In fact, single nucleotide polymorphisms of the FcαRI promoting inflammation have been described in patients with systemic lupus erythematosus.39 The balance of anti- and pro-inflammatory effects of IgA, as well as the ability to respond to IgA based on allelic differences among patients, may determine whether patients develop acute inflammatory reactions such as ENL in leprosy.
The mechanisms by which B cells accumulate and differentiate in leprosy lesions are unresolved. Our data suggest a role for T-cell production of IL-5 in L-lep lesions in the presence of M. leprae to promote B-cell production of IgM. Although antibodies may be key in early responses for protection, the presence of B cells and their mediators in chronic infection may contribute to immunopathology. Insight into the mechanisms of antibody production may provide targets for monitoring and intervention in the treatment of tissue injury.
Acknowledgments
We thank Dr Matthew Schibler and the Advanced Light Microscopy core facility at the UCLA California Nanosystem Institute for use of the confocal laser microscope and the UCLA Flow Cytometry core laboratories for use of the flow cytometer. We acknowledge the financial support received from the National Institutes of Health (AI022553 to R.L.M. and AR053104 to D.J.L.).
Disclosures
The authors have no conflicts of interests to declare.
References
- 1.Ridley DS, Jopling WH. Classification of leprosy according to immunity A five-group system. Int J Lepr. 1966;34:255–73. [PubMed] [Google Scholar]
- 2.Cooper CL, Mueller C, Sinchaisri T-A, et al. Analysis of naturally occurring delayed-type hypersensitivity reactions in leprosy by in situ hybridization. J Exp Med. 1989;169:1565–81. doi: 10.1084/jem.169.5.1565. [DOI] [PMC free article] [PubMed] [Google Scholar]
- 3.Yamamura M, Uyemura K, Deans RJ, et al. Defining protective responses to pathogens: cytokine profiles in leprosy lesions. Science. 1991;254:277–9. doi: 10.1126/science.254.5029.277. [DOI] [PubMed] [Google Scholar]
- 4.Yamamura M, Wang X-H, Ohmen JD, et al. Cytokine patterns of immunologically mediated tissue damage. J Immunol. 1992;149:1470–5. [PubMed] [Google Scholar]
- 5.Sieling PA, Abrams JS, Yamamura M, et al. Immunosuppressive roles for interleukin-10 and interleukin-4 in human infection: in vitro modulation of T cell responses in leprosy. J Immunol. 1993;150:5501–10. [PubMed] [Google Scholar]
- 6.Libraty DH, Airan LE, Uyemura K, et al. Interferon-γ differentially regulates interleukin-12 and interleukin-10 production in leprosy. J Clin Invest. 1997;99:336–41. doi: 10.1172/JCI119162. [DOI] [PMC free article] [PubMed] [Google Scholar]
- 7.Murphy GF, Sanchez NP, Flynn TC, Sanchez JL, Mihm MC, Jr, Soter NA. Erythema nodosum leprosum: nature and extent of the cutaneous microvascular alterations. J Am Acad Dermatol. 1986;14:59–69. doi: 10.1016/s0190-9622(86)70008-x. [DOI] [PubMed] [Google Scholar]
- 8.Wemambu SNC, Turk JL, Waters MFR, Rees RJW. Erythema nodosum leprosum: a clinical manifestation of the Arthus phenomenon. Lancet. 1969;2:933–5. doi: 10.1016/s0140-6736(69)90592-3. [DOI] [PubMed] [Google Scholar]
- 9.Ridley MJ, Ridley DS. The immunopathology of erythema nodosum leprosum: the role of extravascular complexes. Lepr Rev. 1983;54:95–107. doi: 10.5935/0305-7518.19830015. [DOI] [PubMed] [Google Scholar]
- 10.Bleharski JR, Li H, Meinken C, et al. Use of genetic profiling in leprosy to discriminate clinical forms of the disease. Science. 2003;301:1527–30. doi: 10.1126/science.1087785. [DOI] [PubMed] [Google Scholar]
- 11.Modlin RL, Hofman FM, Horwitz DA, et al. In situ identification of cells in human leprosy granulomas with monoclonal antibodies to interleukin 2 and its receptor. J Immunol. 1984;132:3085–90. [PubMed] [Google Scholar]
- 12.Ochoa MT, Stenger S, Sieling PA, et al. T-cell release of granulysin contributes to host defense in leprosy. Nat Med. 2001;7:174–9. doi: 10.1038/84620. [DOI] [PubMed] [Google Scholar]
- 13.Hussain R, Lucas SB, Kifayet A, et al. Clinical and histological discrepancies in diagnosis of ENL reactions classified by assessment of acute phase proteins SAA and CRP. Int J Lepr. 1995;63:222–30. [PubMed] [Google Scholar]
- 14.Hussain R, Dockrell HM, Chiang TJ. Dominant recognition of a cross-reactive B-cell epitope in Mycobacterium leprae 10K antigen by immunoglobulin G1 antibodies across the disease spectrum in leprosy 6. Immunology. 1999;96:620–7. doi: 10.1046/j.1365-2567.1999.00740.x. [DOI] [PMC free article] [PubMed] [Google Scholar]
- 15.Matsumoto R, Matsumoto M, Mita S, et al. Interleukin-5 induces maturation but not class switching of surface IgA-positive B cells into IgA-secreting cells. Immunology. 1989;66:32–8. [PMC free article] [PubMed] [Google Scholar]
- 16.McIntyre TM, Kehry MR, Snapper CM. Novel in vitro model for high-rate IgA class switching. J Immunol. 1995;154:3156–61. [PubMed] [Google Scholar]
- 17.Coffman RL, Lebman DA, Shrader B. Transforming growth factor β specifically enhances IgA production by lipopolysaccharide-stimulated murine B lymphocytes. J Exp Med. 1989;170:1039–44. doi: 10.1084/jem.170.3.1039. [DOI] [PMC free article] [PubMed] [Google Scholar]
- 18.Sonoda E, Matsumoto R, Hitoshi Y, et al. Transforming growth factor β induces IgA production and acts additively with interleukin 5 for IgA production. J Exp Med. 1989;170:1415–20. doi: 10.1084/jem.170.4.1415. [DOI] [PMC free article] [PubMed] [Google Scholar]
- 19.Mizoguchi C, Uehara S, Akira S, Takatsu K. IL-5 induces IgG1 isotype switch recombination in mouse CD38-activated sIgD-positive B lymphocytes. J Immunol. 1999;162:2812–19. [PubMed] [Google Scholar]
- 20.Bertolini JN, Sanderson CJ, Benson EM. Human interleukin-5 induces staphylococcal A Cowan 1 strain-activated human B cells to secrete IgM. Eur J Immunol. 1993;23:398–402. doi: 10.1002/eji.1830230215. [DOI] [PubMed] [Google Scholar]
- 21.Morikawa K, Oseko F, Morikawa S, Imai K, Sawada M. Recombinant human IL-5 augments immunoglobulin generation by human B lymphocytes in the presence of IL-2. Cell Immunol. 1993;149:390–401. doi: 10.1006/cimm.1993.1164. [DOI] [PubMed] [Google Scholar]
- 22.Ridley DS. Histological classification and the immunological spectrum of leprosy. Bull World Health Organ. 1974;51:451–65. [PMC free article] [PubMed] [Google Scholar]
- 23.Iyer AM, Mohanty KK, van ED, et al. Leprosy-specific B-cells within cellular infiltrates in active leprosy lesions. Hum Pathol. 2007;38:1065–73. doi: 10.1016/j.humpath.2006.12.017. [DOI] [PubMed] [Google Scholar]
- 24.Casadevall A. Antibody-mediated immunity against intracellular pathogens: two-dimensional thinking comes full circle. Infect Immun. 2003;71:4225–8. doi: 10.1128/IAI.71.8.4225-4228.2003. [DOI] [PMC free article] [PubMed] [Google Scholar]
- 25.Vordermeier HM, Venkataprasad N, Harris DP, Ivanyi J. Increase of tuberculous infection in the organs of B cell-deficient mice. Clin Exp Immunol. 1996;106:312–16. doi: 10.1046/j.1365-2249.1996.d01-845.x. [DOI] [PMC free article] [PubMed] [Google Scholar]
- 26.Loizou S, Singh S, Wypkema E, Asherson RA. Anticardiolipin, anti-β(2)-glycoprotein I and antiprothrombin antibodies in black South African patients with infectious disease. Ann Rheum Dis. 2003;62:1106–11. doi: 10.1136/ard.62.11.1106. [DOI] [PMC free article] [PubMed] [Google Scholar]
- 27.Guedes Barbosa LS, Gilbrut B, Shoenfeld Y, Scheinberg MA. Autoantibodies in leprosy sera. Clin Rheumatol. 1996;15:26–8. doi: 10.1007/BF02231680. [DOI] [PubMed] [Google Scholar]
- 28.de Larranaga GF, Forastiero RR, Martinuzzo ME, et al. High prevalence of antiphospholipid antibodies in leprosy: evaluation of antigen reactivity. Lupus. 2000;9:594–600. doi: 10.1191/096120300678828712. [DOI] [PubMed] [Google Scholar]
- 29.Vengadakrishnan K, Saraswat PK, Mathur PC. A study of rheumatological manifestations of leprosy. Indian J Dermatol Venereol Leprol. 2004;70:76–8. [PubMed] [Google Scholar]
- 30.Anthony J, Vaidya MC, Dasgupta A. Ultrastructure of skin in erythema nodosum leprosum. Cytobios. 1983;36:17–23. [PubMed] [Google Scholar]
- 31.Waters MF, Rees RJ, Sutherland I. Chemotherapeutic trials in leprosy. 5 A study of methods used in clinical trials in lepromatous leprosy. Int J Lepr Other Mycobact Dis. 1967;35:311–35. [PubMed] [Google Scholar]
- 32.Nagao-Dias AT, Almeida TL, Oliveira MF, Santos RC, Lima AL, Brasil M. Salivary anti-PGL IgM and IgA titers and serum antibody IgG titers and avidities in leprosy patients and their correlation with time of infection and antigen exposure. Braz J Infect Dis. 2007;11:215–19. doi: 10.1590/s1413-86702007000200009. [DOI] [PubMed] [Google Scholar]
- 33.Scollard DM, Bhoopat L, Kestens L, Vanham G, Douglas JT, Moad J. Immune complexes and antibody levels in blisters over human leprosy skin lesions with or without erythema nodosum leprosum. Clin Immunol Immunopathol. 1992;63:230–6. doi: 10.1016/0090-1229(92)90227-f. [DOI] [PubMed] [Google Scholar]
- 34.Van Epps DE, Williams RC., Jr Suppression of leukocyte chemotaxis by human IgA myeloma components. J Exp Med. 1976;144:1227–42. doi: 10.1084/jem.144.5.1227. [DOI] [PMC free article] [PubMed] [Google Scholar]
- 35.Wolf HM, Hauber I, Gulle H, et al. Anti-inflammatory properties of human serum IgA: induction of IL-1 receptor antagonist and Fc α R (CD89)-mediated down-regulation of tumour necrosis factor-α (TNF-α) and IL-6 in human monocytes. Clin Exp Immunol. 1996;105:537–43. doi: 10.1046/j.1365-2249.1996.d01-793.x. [DOI] [PMC free article] [PubMed] [Google Scholar]
- 36.Fernandez MI, Pedron T, Tournebize R, Olivo-Marin JC, Sansonetti PJ, Phalipon A. Anti-inflammatory role for intracellular dimeric immunoglobulin A by neutralization of lipopolysaccharide in epithelial cells. Immunity. 2003;18:739–49. doi: 10.1016/s1074-7613(03)00122-5. [DOI] [PubMed] [Google Scholar]
- 37.Olas K, Butterweck H, Teschner W, Schwarz HP, Reipert B. Immunomodulatory properties of human serum immunoglobulin A: anti-inflammatory and pro-inflammatory activities in human monocytes and peripheral blood mononuclear cells. Clin Exp Immunol. 2005;140:478–90. doi: 10.1111/j.1365-2249.2005.02779.x. [DOI] [PMC free article] [PubMed] [Google Scholar]
- 38.Patry C, Herbelin A, Lehuen A, Bach JF, Monteiro RC. Fc α receptors mediate release of tumour necrosis factor-α and interleukin-6 by human monocytes following receptor aggregation. Immunology. 1995;86:1–5. [PMC free article] [PubMed] [Google Scholar]
- 39.Wu J, Ji C, Xie F, et al. FcαRI (CD89) alleles determine the proinflammatory potential of serum IgA. J Immunol. 2007;178:3973–82. doi: 10.4049/jimmunol.178.6.3973. [DOI] [PubMed] [Google Scholar]


