

Abstract
Type 1 diabetes (T1D) is an autoimmune disease caused by the T cell-mediated destruction of the pancreatic insulin-producing beta cells. Currently there are no widely accepted and standardized assays available to analyse the function of autoreactive T cells involved in T1D. The development of such an assay would greatly aid efforts to understand the pathogenesis of T1D and is also urgently required to guide the development of antigen-based therapies intended to prevent, or cure, T1D. Here we describe some of the assays used currently to detect autoreactive T cells in human blood and review critically their strengths and weaknesses. The challenges and future prospects for the T cell assays are discussed.
Keywords: CFSE, ELISPOT, immunoblot, T cell assays, tetramer, type 1 diabetes
Type 1 diabetes
Type 1 diabetes (T1D) is a tissue-specific autoimmune disease caused by T cell-mediated destruction of the insulin-producing pancreatic beta cells [1]. Beta cells are found in clusters of cells known as islets of Langerhans in the pancreas, where their primary function is to produce the insulin required to maintain glucose homeostasis. It is clear that both CD4+ and CD8+ T cells contribute to beta-cell destruction in the non-obese diabetic (NOD) mouse [2,3]. The data available also indicate that T cells play a central role in the pathogenesis of human T1D [4]. Treatment with a monoclonal antibody specific for CD3, the hallmark of a T cell, delays the decline in beta-cell function in recently diagnosed subjects [5]. Histological examinations have shown that T cells infiltrate the islets of people who have recently developed T1D [6]. The association between particular human leucocyte antigen (HLA) alleles and risk of developing T1D supports a role for CD4+ T cells in the pathogenesis of T1D. The HLA class II region has the strongest association with T1D, as more than 90% of Caucasians with T1D carry the DR3–DQ2 (HLA DRB1*0301–DQB1*0201) or DR4–DQ8 (HLA DRB1*0401–DQB1*0302) haplotypes [7]. The role of CD4+ T cells in human T1D is underscored by the observation that some HLA alleles, for example HLA DQB1*0602 and HLA DRB1*1501, confer a significantly reduced risk of T1D [8,9].
The development of clinical T1D, requiring exogenous insulin, is preceded by the development of autoantibodies. While healthy individuals harbour autoantigen-specific T cells, the changes in frequency and function of these cells that lead to T1D have not been defined. Antibodies to insulin were the first to be associated with T1D [10], but since then antibodies specific for glutamic acid decarboxylase [11], the tyrosine phosphatase IA-2 [12] and more recently the zinc transporter ZnT8 [13] have been identified in patients who eventually develop T1D. The more autoantibody specificities harboured by an individual, the greater his/her risk of developing T1D [14,15]. More than 90% of all patients with T1D are positive for at least one autoantibody. However, while autoantibodies are not believed to be directly pathogenic, they are currently the gold standard for identifying individuals at risk of developing T1D and can be measured in standardized assays. However, measuring islet antigen-specific antibodies gives little insight into the changes in islet antigen-specific T cell function.
Why we need to measure T cell responses
T cells play a central role in controlling the adaptive immune response and a central role in the pathogenesis of T1D [16,17]. The challenge currently facing the field is to gain an insight into islet antigen-specific T cell function from a sample of human blood [18]. An assay to measure changes in islet antigen-specific T cell numbers and function as T1D develops would provide valuable insights into the immunological events that lead to autoimmune beta-cell destruction in humans. However, the most urgent application of a T cell assay is to monitor changes in human T cell function that may be induced by candidate immune therapies intended to prevent, or cure, T1D. Currently, changes in insulin, C-peptide and glucose metabolism are the only parameters that can be measured to assess the efficacy of experimental immune therapies. These metabolic changes are only evident once the autoimmune beta-cell destruction is well advanced.
Islet antigen-specific autoantibodies have proved unsuitable for monitoring intervention trials in T1D. Their titres did not change following several immune intervention trials (for example, anti-CD3 [5,19]), or did so in response to antigen administration [for example, glutamic acid decarboxylase 65 (GAD65) [20]]. Preventing clinical T1D is the final, indisputable measure of the success of any therapy, but it takes many (5–10) years before a large enough sample of participants have progressed, or not, to T1D before a conclusion can be reached. However, a robust measure of islet antigen-specific T cell function would allow changes in T cell function to be measured during the trial, assuming that the immune response(s) measured in vitro reflect faithfully the pathogenic or induced protective immune responses in vivo. In this way, T cell assays may provide immune surrogate marker(s) of clinical efficacy and provide evidence that the treatment had impacted upon the subject's immune system. This would confirm that the route and dose chosen was sufficient to stimulate changes in immune function. Importantly, if the trial did not identify an effective therapy, knowledge of changes in T cell function, or the failure to induce them, would guide the development of future therapeutic approaches.
The features of a useful human T cell assay for islet antigen-specific T cell function
The ideal T cell assay would require a small amount of blood (<5 ml), be technically very simple, have very low intra- and inter-assay variability, be specific for the appropriate islet antigens, work equally well with fresh and cryopreserved peripheral blood mononuclear cells (PBMCs) and give a quantitative measure of islet antigen-specific effector and regulatory T cell responses. Although this ideal may not become a reality, this list highlights the technical challenges to be overcome if an informative assay is to be developed. None the less, an assay that achieved some, if not all, the criteria listed above would still be very useful.
What has prevented the development of T cell assays for islet antigen-specific T cell responses? The major problem is that the frequency of islet antigen-specific T cells is very low in the blood. The frequency of proinsulin76–90-specific CD4+ T cells has been estimated to be ∼1 in 300 000 [21]. The frequency of flu matrix 58–66-specific CD8+ T cells has been estimated to be ∼1 in 200 cells [22], and the frequency of self-reactive proINS- (proINS34–42, proINS101–109) or GAD65 (GAD65536–545, GAD65114–123)-specific CD8+ T cells has been assessed on ∼1 in 1000 cells and ∼1 in 2500 cells, respectively [23–25] (and James and Durinovic-Belló, unpublished observation). In almost all cases, peripheral venous blood is the only tissue available for routine analysis in humans. Another hurdle is that autoreactive T cells are not only rare but are also of low functional avidity, making it more difficult to detect them. This feature stems from the fact that most high-avidity autoreactive T cells are deleted in the thymus, so that the repertoire of T cells reaching periphery becomes skewed towards lower-avidity T cell receptors. The third challenge is to determine which antigens are the targets of the pathogenic autoimmune response and hence the most appropriate for stimulating T cell responses in vitro. Several formats of antigen have been used. Brooks-Worrell et al. [26] have used protein extracts from human islets, separated by electrophoresis and transferred to nitrocellulose, to measure T cell responses. The use of islet protein extracts avoids the need to choose a single protein or epitope. However, others have used recombinant proteins [27] and synthetic peptides have become increasingly popular, as their production at high purity becomes cheaper and more T1D-related T cell epitopes have been identified [23,28,29].
The choice of antigen format impacts upon the frequency of responding T cells. An islet extract comprises the full spectrum of islet antigens, whereas at the other extreme synthetic peptides comprise one, sometimes two, epitopes [30,31]. Hence, one would expect responses to islet lysates to be detected more readily because a larger pool of potentially responsive T cells is present in the blood. However, tissue extracts are susceptible to protease digestion and other modifications that may alter the immunogenicity of the tissue. Furthermore, the composition of tissue extracts cannot be defined in the same ways as peptides or recombinant proteins. Recombinant protein preparations can vary in quality and purity, and these changes can impact upon T cell responses [32]. Synthetic peptides have also been reported to give misleading results. Attempts to detect CD8+ T cell responses to proinsulin-derived peptides lead to CD4+ T cell responses against a minor (<5%) peptide contaminant [33]. Responses to other peptide contaminants have been described in attempts to detect T cell responses to other autoimmune diseases [34]. Given the low frequency of antigen-specific T cells, assays designed to measure islet autoantigen-specific T cell function are particularly susceptible to the technical problems outlined above. The solution is to use the appropriate controls to demonstrate the islet antigen specificity of the T cell responses being measured, and thorough testing with samples from individuals with and without T1D, to demonstrate disease specificity.
Current approaches to measuring islet antigen-specific T cell responses
Broadly, current assays for measuring islet antigen-specific T cell responses measure cytokine production, T cell proliferation or the frequency of epitope-specific T cells using HLA-peptide multimers with or without in vitro expansion. Examples of each type of assay, their strengths and weaknesses, are discussed below. While we have highlighted published assays with which the authors have direct experience, it should be noted that there are many variations on each assay format. Furthermore, description of an assay here does not imply that it is, in some way, endorsed by the Immunology of Diabetes Society (IDS). At this point ‘head-to-head’ comparisons of the different assays are beginning to be published, but it is not clear [35] which assay, if any, is the ‘best’ assay. Indeed, the most appropriate assay may differ depending upon the aim of the analysis. For example, the best assays for detecting islet antigen-specific T cell responses in the blood of people at risk of T1D may not be the most appropriate assay for monitoring changes in epitope-specific T cell function following antigen-based therapy. Clearly, much work is required before there is sufficient evidence to promote one assay above any other.
Cytokine assays
CD8+ T cell enzyme-linked immunospot (ELISPOT) assays: the ISL8SPOT
Background
The ISL8SPOT [islet-specific CD8+ T cell interferon (IFN)-γ ELISPOT] assay takes advantage of an IFN-γ ELISPOT format and of a panel of nine immunodominant HLA-A2-restricted β cell epitopes to detect islet-specific CD8+ T cell responses [23,24]. An optimized stimulation protocol performed in serum-free AIM-V medium in the presence of low-dose interleukin (IL)-7 further increases detection sensitivity [36].
Advantages
The ISL8SPOT assay is performed on unfractionated PBMCs directly ex vivo, without any preliminary in vitro expansion, using either fresh or frozen samples. Only 10 ml of blood is required. It displays good intra- and inter-assay variability (14% and 4–9%, respectively). It is a quantitative assay, as T cell frequencies can be calculated based upon numbers of spot-forming cells. It is endowed with very high sensitivity: epitope-specific T cells are detected within a range of 0·0008–0·08% of total PBMCs (i.e. 0·8–80 T cells/100 000 PBMCs).
Disadvantages
Only IFN-γ-producing T cells are detected. The assay is limited so far to a panel of HLA-A2-restricted T cell epitopes, so that only HLA-A2+ individuals (∼40% of the Caucasian population) can be studied.
Protocol
Draw blood into a heparin-containing tube.
Separate PBMCs by density gradient centrifugation and lyse contaminating red blood cells before final wash.
Meanwhile, prepare an IFN-γ polyvinylidene difluoride (PVDF) ELISPOT plate (Millipore MSIP, Saint Quentin en Yvelines, France) by blocking it with RPMI + 10% human serum for 1 h at 37°C. This plate has been coated previously overnight with an IFN-γ antibody (U-CyTech, Utrecht, the Netherlands), according to the manufacturer's instructions.
Once blocked, decant blocking solution and fill each well with 100 µl of AIM-V medium (Invitrogen, Cergy Pontoise, France) containing 1 ng/ml recombinant human IL-7 (R&D, Lille, France). Note that the final volume will be 200 µl, so the final IL-7 concentration will be 0·5 ng/ml.
- Add the following peptides to triplicate wells at a 10 µm concentration in a 20 µl volume (concentration referred to the 200 µl final volume):
- Preproinsulin (PPI)2–10: ALWMRLLPL
- Proinsulin (PI)B10–18 (PPI34–42): HLVEALYLV
- PIB18–27 (PPI42–51): VCGERGFFYT
- PIA12–20 (PPI101–109): SLYQLENYC
- GAD65114–123: VMNILLQYVV
- GAD65536–545: RMMEYGTTMV
- Insulinoma-associated (IA)-2206–214: VIVMLTPLV
- Islet-specific glucose-6-phosphatase catalytic subunit-related protein (IGRP)228–236: LNIDLLWSV
- IGRP265–273: VLFGLGFAI
- Viral mix: flu matrix protein (MP)58–66 (GILGFVFTL), cytomegalovirus (CMV) pp65495–503 (NLVPMVATV), Epstein–Barr virus (EBV)
- BMLF1280–288 (GLCTLVAML); each peptide at 10 µm
- Pyruvate dehydrogenase (PD)5–13: KLSEGDLLA (negative control peptide)
- Dimethylsulphoxide (DMSO) diluent (negative control)
- Phytohaemagglutinin (PHA), 1 µg/ml final concentration; one well is enough
Finally, add PBMCs at 300 000 cells/80 µl/well.
Incubate the plate for 20–24 h in a 37°C and 5% CO2 incubator.
On the following day: discard cells and wash wells five times with phosphate-buffered saline (PBS) using a squirt bottle. Add detection biotinylated anti-IFN-γ monoclonal antibody (mAb) (U-CyTech) in PBS containing 10% fetal bovine serum, according to the manufacturer's instructions. Incubate for 2 h at room temperature.
Wash both sides of the membrane five times with PBS. Add a previously titrated amount of ExtrAvidin-alkaline phosphatase (Sigma, Lyon, France; optimal dilution is between 1:5000 and 1:20 000) to each well, diluted in PBS containing 0·5% fetal bovine serum. Incubate for 1 h at room temperature.
Wash both sides of the membrane using nitro blue tetrazolium–5-bromo-4-chloro-3-indolyl phosphate (NBT-BCIP) reagent (SigmaFast tablets; Sigma): dilute one tablet in 10 ml deionized water and dispense immediately into wells. Incubate for 10 min at room temperature.
Stop reaction by rinsing both sides of the membrane extensively under tap water. Ensure that the membrane is dried well before acquiring plate on an ELISPOT reader. Acquisition parameters need to be optimized depending upon the equipment used.
CD4+ T cell ELISPOT
Background
Several different ELISPOT formats exist addressing single cell cytokine release of in vitro antigen or mitogen-stimulated T cells (for reviews see [37,38]). While these assays vary in the details of their protocols they all make use of peripheral fresh or frozen PBMC stimulated with whole protein or peptide. Read-out is obtained by an automated reader and results are expressed as either stimulation indices (SI) or as antigen-reactive response subtracted by background responses (expressed as the number of spots). This assay uses detection for both IFN-γ and IL-10 producing autoantigen-reactive CD4+ T cells, which is important as it has been noted that control subjects may respond to islet autoantigens [19]. However, the quality of the responses are different; HLA-DR4-positive patients produce more IFN-γ responses, whereas control subjects produce more IL-10 responses. An example of a CD4+ T cell ELISPOT assay is shown in Fig. 1.
Fig. 1.
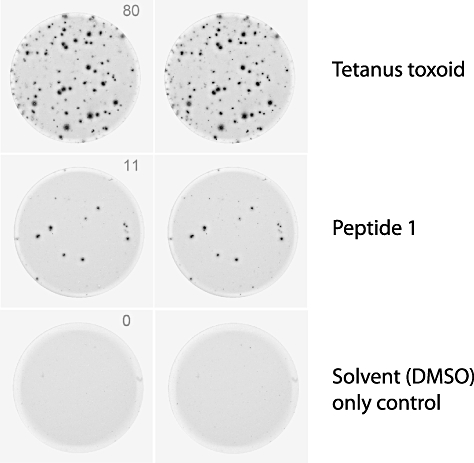
Examples of wells from an enzyme-linked immunospot (ELISPOT) assay. Spots indicate cells, or groups of cells, that have produced interferon-γ after stimulation with either: tetanus toxoid, a recall antigen used as a positive control, an islet antigen-derived peptide or dimethylsulphoxide (peptide solvent), which serves as a negative control. The number of spots in each well are counted to determine the frequency of responding cells. A response is considered to be positive when it is significantly greater than the peptide solvent control (cut-off determined for each ELISPOT format).
Advantages
The major advantage of CD4+ T cell ELISPOT compared to proliferation assays and determination of cytokine secretion into the culture supernatant is that this assay allows enumeration of the antigen-reactive cytokine response. This assay has the further advantage that whole protein can be used to stimulate T cell responses, which allows responses to be detected from donors regardless of their HLA type, in contrast to peptide-based assays such as tetramer staining, which must use donors with the appropriate HLA allele(s).
Disadvantages
The number of positive cells in type 1 diabetes detected using these ELISPOT formats are low and the assay is somewhat blood- and labour-intensive.
Protocol
PBMCs are isolated from fresh blood samples within 4 h of blood collection by gradient density centrifugation.
The PBMCs are cultured in 48-well plates at a density of 2 × 10⁶ in 0·5 ml RPMI-1640 medium (Gibco, Invitrogen, UK) with antibiotics (antibiotic–anti-mycotic, Gibco) and 10% human AB serum (Harlan Sera-Lab, Leicestershire, UK) together with 10–20 µmol/l peptide and incubated at 37°C, 5% CO2 with the culture plates tilted at 5°. Control wells contain culture medium together with an equivalent amount of peptide diluent (DMSO) as a negative assay control or 0·16 IU of tetanus toxoid (TT; Diftavax, Aventis Pasteur MSD, Maidenhead, UK) as a positive assay control.
The next day (day 1), 0·5 ml of prewarmed medium with 10% AB serum is added.
On day 2, non-adherent cells are resuspended using prewarmed medium with 2% AB serum, washed and made up to a concentration of 106/300 µl. Then 100 µl of cells are placed in triplicate into wells of 96-well enzyme-linked immunosorbent assay (ELISA) plates (Nunc Maxisorp; Merck, Poole, UK) preblocked with 1% bovine serum albumin (BSA) in PBS and precoated with anti-IFN-γ or anti-IL-10 capture antibody (U-Cytech, Utrecht, the Netherlands).
After incubation at 37°C, 5% CO2 for 18 h, the ELISA plates are washed manually three times in PBS followed by washing eight times in PBS/Tween 20 using an automated plate washer, and spots developed according to the manufacturer's instructions (U-Cytech).
The plates are dried and spots of 80–120 µm diameter are counted in a BioReader 4000 (BioSys, Karben, Germany).
Analysis of antigen-specific T cells by cytokine secretion assay (CSA)
Background
The cytokine secretion assay (CSA) (Miltenyi Biotec, Bergisch Gladbach, Germany) can detect very-low-frequency antigen-specific T cells by staining the secreted cytokine(s) on the surface of individual antigen-reactive T cells. The CSA was developed originally by Manz et al. in 1995 and is based on the generation of a cell surface affinity matrix for the cytokine of interest [39]. The affinity matrix is generated using dual mAbs (catch reagent), constructed by covalently binding anti-CD45 mAb to an anti-cytokine mAb (i.e IL-2, IL-10, IFN-γ). The dual mAbs bind to CD45 on the cell surface of lymphocytes. After a short culture period the cells are ‘stained’ with the dual mAb that binds to the cell surface and captures the secreted cytokine. The antigen-reactive cell population can be defined using mAbs specific for cell lineage markers and flow cytometry. Whole blood or purified PBMC can be used in the assay. Incubation for 16 h is required to detect responses to intact antigen, whereas 6–8 h is optimal for peptides. Responses with and without islet antigens (for example, hrGAD65, insulin and proinsulin) are compared.
Advantages
First, a small amount of whole blood is needed to perform the assay (250 µl/cytokine, 1–2 ml total). Secondly, the short stimulation time decreases the risk of expanding selected clones or bystander cells rendering the calculation of precursor frequencies more reliable. Thirdly, the CSA permits further phenotype antigen-specific T cells (e.g. activation markers, memory/naive, regulatory markers). Lastly, the CSA offers the possibility to isolate live antigen-specific T cells.
Disadvantages
If not combined with the use of tetramers, CSA fails to detect autoantigen-specific T cells that did not respond to stimulation by secreting the cytokine of interest. This could be important when using the assay to monitor trials of immune therapy, making it difficult to distinguish between clonal deletion and functional anergy.
Protocol (modified from Miltenyi Biotec protocol)
Collect venous blood into heparin-containing tubes.
Dispense 250 µl whole blood into 15-ml polypropylene tubes.
Add selected antigens to each tube and leave one sample unstimulated, mix gently.
Incubate for 6–8 h (peptides) or 16–18 h (intact protein) at 37°C and 5% CO2.
Add 5 ml of freshly prepared 1:10 CSA lysing buffer to each tube (1·55 m NH4Cl, 100 mm KHCO3, 0·5 m ethylenediamine tetraacetic acid (EDTA) in distilled water, pH 7·2–7·4). Mix well.
Incubate for 10 min at room temperature (RT).
Centrifuge at 300 g for 10 min and decant the supernatant.
Loosen the pellet by flicking the tube, do not vortex. Put on ice. Add 10 ml cold staining-buffer (0·5 M EDTA, 0·5 % BSA in PBS).
Centrifuge at 300 g for 10 min then decant the supernatant.
Tap the tubes against a paper towel. Loosen the pellet by flicking and adjust the volume to 90–100 µl per tube.
Transfer the cell suspension to 15 ml polystyrene tubes and add 10 µl of catch reagent (dual antibody) to each tube and incubate for 15–20 min on ice.
Add 5 ml of pre-warmed (37°C) complete medium RPMI-1640 with 5% human AB serum to each tube, mix well.
Incubate at 37°C for 45 min. Turn the tubes upside-down gently every 5–7 min or use a mechanical rotator.
Add 10 ml cold media and centrifuge at 300 g for 10 min, cold. Decant the supernatant and tap the tubes against a paper towel.
Transfer the pellets onto a 96-well plate. Centrifuge the plate at 320 g for 2 min. Decant the supernatant by flipping and resuspend the cells by gently vortexing the plate.
Add 200 µl staining-buffer and centrifuge the plate at 320 g for 2 min. Decant the supernatant by flipping and wipe the plate against a paper towel.
Resuspend the pellet by gently vortexing the plate and add 25 µl detection reagent and the desired cell surface markers mix (i.e. CD3, CD4, CD8) to each well.
Incubate on ice for 15–20 min.
Add 175 µl cold staining-buffer to each well.
Repeat step 17 twice.
Transfer the cell suspension into fluorescence activated cell sorter (FACS) tubes and analyse the samples by flow cytometry within 4 h.
Add 0·5 µl propidium iodide (1 mg/ml), or equivalent dead cell markers (can vary based on the different fluorochrome combinations) just before acquisition to exclude dead cells.
Set the forward scatter (FSC) versus side-scatter (SSC) gate on lymphocytes and thereafter exclude propidium iodide or equivalent cell dead marker against the detected cytokine and acquire at least 50 000 events in the live gate.
For analysis, calculate the percentage of cytokine-positive cells expressing the surface markers of interest and subtract the percentage of cytokine-positive cells obtained in the unstimulated sample. Absolute numbers and frequencies can be calculated using the total blood count obtained by haemocytometer.
Lymphocyte proliferation assays
Cellular immunoblot
Background
Cellular immunoblotting allows for the full array of islet antigens to be used to test for the presence of islet-reactive T cells [26]. This technique eliminates the guesswork of which proteins to use. Islet antigen is prepared by subjecting human islets to polyacrylamide gel electrophoresis (PAGE), electroblotting the proteins to nitrocellulose and using the nitrocellulose particles to stimulate PBMC from patients. Cellular immunoblotting has been validated multiple times to be able to distinguish type 1 diabetes patients from controls in blinded trials with excellent sensitivity and specificity [35,40]. PBMC reactivity to the islet cell proteins has also been demonstrated to have clinical relevance in identifying autoimmune diabetes patients with more severe loss of beta-cell function [41]. PBMCs from patients with T1D respond to between four and 18 molecular weight regions containing islet proteins, whereas normal control subjects respond to between zero and three molecular weight regions [42].
Disadvantages
Human islets are needed to prepare the islet antigens. Twenty ml of blood is needed per patient. The antigen specificity of the T cell responses is not defined.
Protocol
Normal human islet cells are placed into sodium dodecyl sulphate (SDS) sample buffer, boiled and then subjected to preparative one-dimensional 10% SDS-PAGE [43].
SDS-PAGE gels are electroblotted onto nitrocellulose overnight at 30 mA then 70 mA for 1 h. A portion of the nitrocellulose containing the molecular weight markers is stained and dried for future reference.
The nitrocellulose is then cut into 18 equal pieces corresponding to molecular weight regions.
The nitrocellulose is dissolved using DMSO dropwise with continual vortexing and then reprecipitated using carbonate/biocarbonate buffers (dropwise with continual vortexing to equal volume of DMSO).
The particles are washed twice in RPMI and resuspended in 12 ml of RPMI and frozen at −20°C until needed for assays.
The nitrocellulose particles are then diluted and each blot section is added to a flat-bottomed 96-well tissue culture plate with 3·5 × 105 cells/well. The cultures are placed at 37°C with 5% CO2 for 5 days, after which 1 µCi/well of [3H]-thymidine is added per well and the cultures incubated for another 18 h.
Positive responses are determined to be T cell proliferative responses to ≥4 blot sections with a stimulation index of each molecular weight blot section to be calculated as SI = counts per minute of experimental wells/counts per minute of control wells. An SI > 2·0 is considered positive. Control wells contain nitrocellulose particles without antigen.
5,6-carboxyfluorescein diacetate succinimidyl ester (CFSE)-proliferation assay
Background
CFSE is a non-toxic fluorescent dye that is distributed evenly between daughter cells when a cell divides [44]. This dye can be used to determine the number of cells that have proliferated, in the presence or absence of antigen, by flow cytometry (see Fig. 2).
Fig. 2.
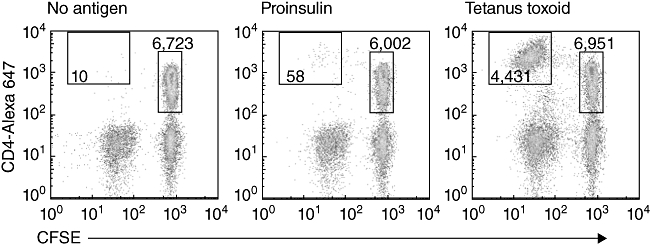
Flow cytometry plots of 5,6-carboxylfluorescein diacetate succinimidyl ester (CFSE) and CD4-labelled human peripheral blood mononuclear cells after 7 days' culture with either: no antigen, recombinant proinsulin or tetanus toxoid. The number of cells that proliferated (CFSEdim events, in the top left box) in each treatment is determined. The magnitude of the response is expressed as a ratio of the number of CFSEdim cells with antigen: CFSEdim cells without antigen, per 5000 CFSEbright, CD4+ cells. Cells shown are gated to exclude dead, propidium iodide-positive, cells.
Advantages
This assay is more sensitive than [3H]-thymidine incorporation and the proliferation of different lineages of cells can be determined directly by flow cytometry, making it well suited to measuring islet antigen-specific T cell responses to autoantigens [27]. Multi-colour flow cytometry can be used to gain further information on the phenotype of the cells that have proliferated, such as their capacity to produce cytokines after a brief stimulation with anti-CD3 mAb. Alternatively, the proliferation of different cell lineages [B cells and natural killer (NK) cells, for example] can be measured in the same sample. Finally, the CFSE-based proliferation assay can be used to isolate T cell clones [45], allowing their specificity to be determined in detail [30,31].
Disadvantages
Each sample must be analysed individually by flow cytometry. Because of the low precursor frequency of peptide and recombinant islet protein-specific T cells their responses can be variable between replicates. This assay measures only cells capable of proliferating in vitro.
Protocol
Draw blood into a heparin-containing tube (note: heparin is the recommended anti-coagulant because it does not interfere with immune function).
Separate PBMC over Ficoll/Hypaque and wash three times in PBS.
Count viable cells using Trypan blue exclusion on a haemocytometer.
Dilute the PBMC in PBS to ∼10 × 106 PBMC/ml.
Remove 1–2 × 10⁶ PBMC (100–200 µl) and put these cells into a new sterile tube. These cells will not be stained with CFSE and be used to determine the optimal settings when the cells are analysed by flow cytometry (note: unstained cells are cultured with tetanus to increase the viability of these cells during the 7-day culture).
Transfer the remaining cells into a 50-ml conical-bottomed tube. Add CFSE to a final concentration of 0·1 µm (note: high concentrations of CFSE inhibit antigen processing and presentation. Batches of CFSE may vary and should be titrated to determine the optimal concentration for staining PBMC in an antigen-driven proliferation assay).
Incubate the cells for 5 min at 37°C.
To stop staining add 5 ml serum containing culture media, wash [note: always use human serum. Exposure to xeno-antigens, such as fetal calf serum (FCS) can stimulate responses against these antigens, resulting in an increase in background proliferation and reduced sensitivity of the assay].
Resuspend the cells to 2·0 × 106 PBMC/ml in culture medium.
Add 1·5 to 4·5 ml of cells suspension to 10-ml tubes. Prepare a separate tube for each antigen to be tested, including ‘no antigen control’. These suspensions are then added to sterile Kahn tubes for culture.
Add 500–1000 µl of cell suspension, with or without antigen, to a sterile 5 ml Kahn tube, with a lid (note: the assay works well in 5-ml tubes, hence the cultures, staining and FACS analysis can all be performed in the same tube).
Incubate for 7 days in a 37°C 5%CO2incubator.
Spin tubes, discard supernatant then add fluorochrome-labelled monoclonal antibody against human CD4 [or desired cell lineage(s)]. Gently resuspend the cells in the residual buffer.
Incubate on ice for 15–25 min, then wash cells once in 1 ml 0·1% BSA/PBS (note: FCS can be used at the end of the assay).
Keep a sample of CFSE-labelled cells unstained with any other fluorochrome to use for setting the compensation (note: the fluorescent signal from CFSE ‘leaks’ into adjacent channels on the flow cytometer. A sample stained with only CFSE is used to adjust the compensation so the fluorescent signal is not detected in any other channels).
Wash 1 × 1 ml 0·1% BSA/PBS, resuspend in 400 µl 0·1% BSA/PBS.
Add 1 µl of propidium iodide (0·1 mg/ml in PBS) to all tubes before analysis.
Analyse viable (propidium iodide-negative) lymphocytes gated on CD4-PE versus CFSE.
Collect a fixed number (usually 5000 events) of CD4+ve CFSEbright undivided cells for each tube.
The magnitude of the response can be expressed as the number of cells that have proliferated (diluted their CFSE) for each treatment, or expressed as the ratio of the number of cells that have proliferated in response to antigen: the number of cells that have proliferated in the absence of antigen for the same number of CFSEbright CD4+ T cells.
Tetramer assays
Overview
Background
Individual HLA–T cell receptor (TCR) contacts are low-affinity interactions [46]. However, cross-linking of multiple HLA/peptide complexes increases the avidity of the interaction allowing HLA/peptide multimers, such as tetramers and pentamers, to be used to stain antigen-specific T cells [47].
HLA class I tetramers were the first to be developed [22]. The single-chain HLA class I molecule can be refolded efficiently in the presence of antigenic peptides to yield a stable β2-microglobulin-associated class I monomer [48,49]. After biotinylation, tetramers are formed by mixing the biotinylated peptide–HLA complex with fluorophore-labelled avidin [22,46]. The traditional avidin-based tetramers have been superseded by complexes of five HLA/peptides, known as pentamers.
HLA class II tetramers have been more difficult to produce because the peptide complexes are less stable than HLA class I and interactions with the TCR are weaker than HLA class I/ CD8+ T cell interactions [46]. None the less, recombinant class II molecules that incorporate ‘leucine zipper’ motifs can be produced in stably transfected Drosophila cells and purified by affinity chromatography [50]. Because of the very low frequencies of CD4+ T cells specific for self-antigens, this assay often utilizes an in vitro amplification step to increase the threshold of detection [51].
Loading tetramers with modified agonist peptides can increase the tetramer's binding affinity and allow low-avidity T cell populations to be detected [52,53]. Parallel sorting of tetramer-positive cells, followed by RNA transcription profiling, enables extensive determination of their functional phenotypes [54].
The recently developed fluorescent quantum dots have been used to label HLA class I tetramers. Quantum dots have narrow emission spectra, making them ideal for multiplexed tetramer staining [55]. Quantum dots may also prove useful for labelling HLA class II reagents.
Advantages
Tetramers and pentamers are unique reagents because they can identify antigen-specific T cells directly. This property makes them very useful for validating epitopes identified by other means. Ex-vivo tetramer staining (class I and class II) enables direct estimation of the frequency of antigen-specific T cells [56].
Disadvantages
Class II tetramers are not suitable for use in routine clinical monitoring to detect biomarkers of disease. In vitro expansion of the antigen-specific T cells is required to increase their frequency to detectable levels and may lead to over- or under-estimation of the cell populations depending upon their capacity to proliferate in vitro. Furthermore, large volumes (∼50 ml) of blood are required to isolate the required numbers of PBMC. One possible limitation of both class I and class II tetramer assays is that low-affinity TCR-bearing cells may not be detected. Therefore, tetramer staining combined with proliferation and/or cytokine secretion assay may yield more information than either assay alone [57].
Analysis of antigen-specific CD8+ T cells using class I pentamers
HLA-A*0201 pentamers (ProImmune, Oxford, UK) loaded with the autoantigenic epitopes of choice, positive control viral epitope(s) and negative control epitope.
Materials required
Cell sample, e.g. blood sample (RBC-depleted), PBMCs or T cell line.
Pro5® recombinant MHC pentamer conjugated to the fluorescent label of choice (note: ensure that the stock pentamer is stored consistently at 4°C in the dark, with the lid tightly closed).
Fluorochrome-labelled anti-CD8 and anti-CD19 antibodies.
Wash buffer (0·1% sodium azide, 0·1% BSA in PBS).
Fix solution (1% fetal calf serum, 2·5% formaldehyde in PBS).
Standard staining protocol
Spin Pro5® pentamer in a chilled microcentrifuge at 14 000 g for 3 min. This will remove protein aggregates that contribute to non-specific staining. Maintain reagents on ice, shielded from light, until required. Do not aspirate any part of the aggregated protein that forms a pellet at the bottom of the tube when taking a sample for staining.
Allocate 1–2 × 10⁶ lymphoid cells (PBMC or splenocytes) per staining condition (note: this ensures that there is a sufficient number of cells to collect up to 500 000 events during flow cytometry. Allocate only 2–5 × 10⁵ cells per staining condition when using T cell clones or lines because of the high frequency of antigen-specific T cells).
Wash cells with wash buffer and resuspend in the residual volume (∼ 50 µl) (note: to wash cells, dispense 1·0 ml wash buffer per tube and spin at 500 g for 5 min in a chilled centrifuge at 4°C. Check for presence of a cell pellet before discarding the supernatant. Keep tubes chilled on ice for all subsequent steps, except where indicated otherwise).
Add (10 µl) fluorochrome-labelled pentamer to the cells and mix by pipetting.
Incubate at room temperature (22°C) for 10 min, shielded from light.
Wash cells with 2·0 ml wash buffer per tube and resuspend in residual liquid (∼ 50 µl).
Add an optimal amount of anti-CD8 and anti-CD19 antibodies (and any other secondary antibodies) and mix by pipetting (note: if staining control samples with other primary antibodies, at this stage add an optimal amount to the cells in their respective tubes).
Incubate samples on ice for 20 min, shielded from light.
Wash cells twice with 2·0 ml wash buffer per tube.
Add 200 µl of fix solution. Vortex tubes (note: it is important to vortex well when adding fixative so that cells do not clump. Store tubes in the dark in the refrigerator until ready for data acquisition. The morphology of the cell changes after fixing, so it is advisable to leave the samples for 3 h before proceeding with data acquisition. Samples can be stored for up to 2 days).
The pentamer-positive cells are analysed most conveniently by first gating on live, CD19-negative lymphoid cells, and then analysing on a two-colour plot showing CD8 on the x-axis and pentamer on the y-axis.
Class I tetramer protocol
HLA-A*0201 tetramers are loaded with the autoantigenic epitope of choice. The control tetramer flu MP58-66 (# T01011, GILGFVFTL) may be obtained from Beckman Coulter (Miami, FL, USA).
Material
Freshly prepared PBMCs (∼7 × 10⁶).
FACS buffer (PBS + 0·5% FBS + 0·1% NaN3).
96-well V-bottomed plate.
PE-labelled HLA-A*0201 tetramers (TMrs) of choice. Stock solutions are at 0·5 mg/ml and are used 1:100 (i.e. 5 µg/ml final concentration).
Monoclonal antibodies – pretitrated: CD14-FITC, CD19-FITC, CD8-allophycocyanin (APC) [CD8-peridinin chlorophyll (PerCP) can also be used].
Note: some anti-CD8 mAb clones will interfere with TMr staining. Here is a list of tested mAb clones that work in our hands: OKT8, MEM-31, BW135/80, LT8, RPA-T8, SK-1.
Procedure
Sample tube panel for FACS acquisition.
Staining controls
Unlabelled cells.
FITC only (CD14/CD19-FITC).
PE only (e.g. CD3-PE).
APC only (CD8-APC).
-
Fluorescence minus one: CD14/19-FITC, CD8-APC; no TMr.
Test tubes: CD14/CD19-FITC and CD8-APC in all, plus:
PD 5–13 (negative control).
Flu MP 58–66 (positive control).
PPI 34–42.
PPI 101–109.
GAD 114–122.
- GAD 536–545.
- Resuspend PBMCs at 1 × 10⁶/25 µl FACS buffer in a 96-well V-bottomed plate. For control tubes, 0·2 × 106/25 µl are sufficient.
- Prepare a 1:50 working dilution of each tetramer (TMr) by adding 0·5 µl of stock to 25 µl FACS buffer (note: this is sufficient for one tube; multiply accordingly if staining more than one tube).
- Add this 25 µl working dilution to corresponding wells. Mix. Incubate 45 min at 4°C in the dark.
- Wash once: add 150 µl FACS buffer and spin down at 800 g for 1 min, aspirate the supernatant without disturbing the cell pellet.
- Prepare a mix of titrated co-staining mAbs and add to wells: CD8-APC, CD14-FITC and CD19-FITC.
- Incubate for 15 min at 4°C in the dark.
- Wash once: add 200 µl FACS buffer and spin down at 800 g for1 min. Aspirate supernatant without disturbing the cell pellet.
- Fix cells by adding 3·2% paraformaldehyde (PFA) solution (less than 3 weeks old), 50 µl/well. Incubate for 20 min at room temperature, in the dark. Wash as above.
- Transfer to FACS tubes by resuspending in 500 µl FACS buffer (250 µl for staining controls).
- Acquisition and analysis template: acquire 50 000 total events for staining controls; 500 000 total events for test tubes. Gate first on live cells, then on CD14- CD19- cells using a fluorescein isothiocyanate (FITC) histogram.
- Make a dot plot of CD8-APC by TMr-PE staining.
- Run staining controls first and setup compensation. Set negative with tube #5 (fluorescence minus 1). Set negative control TMr (tube #6) at ≤0·005% of TMr+ events. Calculate frequencies of test tubes according to this gate. The cut-off for positive staining can be set subsequently at three, four or five times the negative cut-off, as determined by receiver operating characteristic (ROC) analysis.
Analysis of antigen-specific CD4+ T cells
HLA-DRB1*0401 tetramers are loaded with the autoantigenic epitope of choice: PE-labelled DRB1*0401 tetramers (TMrs): PPI 76–90, PPI 76-90S88, GAD 555–567, GAD 270–283, haemagglutinin (HA) 306–318 (positive control) and outer surface protein A (OspA) 163–175 (negative control) [51].
1. Peripheral blood mononuclear cell (PBMC) isolation (note: blood should be collected in syringes or blood tubes containing heparin. Expect a yield of about 1 × 10⁶ PBMC/ml of blood – about 40% of which will be CD4-positive (CD4+) T cells).
2. CD4+ T cell separation, using magnetic beads according to the manufacturer's instructions [note: alternatively, magnetic affinity cell sorting (MACS) columns and beads (Miltenyi Biotec), the AutoMACS cell separator (Miltenyi Biotec, Auburn, CA, USA) or Robosep cell separator (Stem Cell Technologies, Vancouver, BC, Canada) can be used according to the manufacturer's instructions].
3. In vitro expansion culture
Aspirate liquid from the CD4+ and CD4- cell pellets and, based on the cell counts, add culture media (note: 3 million CD4+ cells/ml and 10 million CD4- cells/ml works well for setting up the culture. The expansion culture requires 3–5 million CD4- cells per well and 2–3 million CD4+ cells per well in a total volume of 1·0 ml of culture media in a 48-well plate. The CD4+ cells are usually the limiting population).
Aliquot CD4- cells into the appropriate number of wells on a 48-well plate by adding 300–500 µl to each. Place the plate in a 37°C incubator for 1 h.
Remove the plate from the incubator. Wash the wells by adding 500 µl of fresh media and gently pipetting up and down 12–20 times using a transfer pipette and removing all of the liquid [note: the adherent CD4– cells will serve as antigen-presenting cells in the expansion culture. The CD4- cells can be irradiated (5000 rads, if required)].
When the washing is complete, add just enough media to wet the bottom of each well (roughly 100 µl) (note: this prevents the adherent cells from drying).
Add 2–3 million CD4+ cells to each well. If necessary, add additional media to bring the total volume in each well up to 1·0 ml.
Add the desired peptide to each well (note: the typical final concentration for stimulation is 10 µg/ml).
Incubate the cells at 37°C for 7 days.
After 7 days, add 50 µl of Hemogen IL-2 (note: equivalent, such as recombinant IL-2, 10 IU/ml also works well) to each well.
On each subsequent day, monitor cell growth using a microscope. Feed wells that are not yet confluent by removing half the media, adding fresh media and 50 µl of IL-2. Split confluent wells by resuspending the cells, moving half the cells to an empty well, adding fresh media and 50 µl of IL-2. Return cells to incubator.
The expanding cells will be ready for tetramer after 13–15 days of culture.
4. Visualizing T cells by tetramer staining.
Purchase or assemble tetramers to match the peptide/MHC combinations that match the stimulated CD4+ T cells (note: tetramers should be ∼0·5 mg/ml solution).
Remove plate from incubator and carefully draw off half of the media from each well.
Transfer an aliquot of cells from each well (usually 75 µl, or about 50 000 cells) into a 5-ml polystyrene FACS tube.
Add tetramer – typically 1 µl per 50 µl total volume – and place in a 37°C incubator for 1–2 h (note: it is advisable to stain a second aliquot of cells from each well with a mismatched tetramer as a negative control).
Label cells with anti-CD3, anti-CD4 and anti-CD25 antibodies by adding 3–10 µl of each antibody (note: additional or alternative antibody markers can be used. However, do not use PE-labelled antibodies as this channel must be reserved for the tetramers). At this time, also label single-colour or isotype controls using extra cells.
Incubate antibody-labelled cells for 15–30 min on ice or at 4°C.
Wash each tube with 0·5–2 ml running buffer and centrifuge at 230 g for 10 min.
Carefully decant the supernatant from FACS tubes. Store all tubes in a covered container (preferably on ice) for subsequent FACS analysis.
5. Flow cytometer acquisition and analysis.
Calibrate the flow cytometer using reference beads.
Verify instrument settings.
Using unstained control cells or isotype controls, adjust the location of the viable lymphocyte gate (FSC versus SSC). Remove autofluorescence from all channels by centring the population (by changing the gain settings) below the first decade on each axis.
Using single-colour control tubes, centre events within the correct quadrants for each single colour (by changing the compensation settings).
Carry out a fine adjustment of the instrument settings using a tube stained with an irrelevant tetramer. In particular, settings for the PE channel may need adjustment because tetramers often stain brighter than the antibody control. The irrelevant tetramer should stain <0·5% of the CD4+ cells.
Acquire data for each tube.
Collect events for each sample tube and negative control tube.
Acquire and save at least 20 000 events for analysis.
Analyse data.
Import data files into FACS analysis software (e.g. CellQuest software, WinMDI or FlowJo). Begin analysis using a tube stained using an irrelevant tetramer.
Plot FSC versus SSC and draw a gate around the live lymphocytes (Fig. 1, top left panel).
Plot CD4 versus CD3 (gated to show live lymphocytes only) and draw gates around the CD3+ and CD4+ populations.
Plot CD4 versus tetramer (gated to show CD3+ lymphocytes only) and set the quadrant boundaries so that the CD4+tetramer+ population is less than 0·5%.
Plot CD25 versus tetramer (gated to show CD4+ lymphocytes only) and set the quadrant boundaries so that the CD25+tetramer+ population is less than 0·5%.
Analyse all the sample tubes without changing the gates.
Looking to the future
Technological advances have led to the development of many approaches to the problem of measuring islet antigen-specific T cell function in human blood. The challenge remains to optimize the existing assays to reduce the volume of blood required and increase the antigen and disease specificity and sensitivity.
Head-to-head comparisons of the different assays have been reported [35,40] and are essential to determine which assay(s) are most suitable for monitoring trials of immune therapies. In future, the ability of other groups to perform assays developed in other laboratories needs to be addressed; an assay is of little value if it cannot be performed by scientists worldwide.
Combinations of the different approaches described here also deserve testing. For example, it may be that stimulating cells with nitrocellulose-bound islet antigens followed by tetramer analysis of the responding population, detected by CFSE dilution, will be more informative than any of these assays alone. The ability to measure mRNA transcripts readily from antigen-stimulated PBMCs adds another weapon to the arsenal. Molecular approaches are well suited to broad screening of many transcripts, potentially giving a detailed picture of how cells are responding to islet and control antigens. Again, these approaches may be combined with current assays such as ELISPOT to confirm that induction of a transcript correlates with protein secretion.
Currently, none of the methods can measure directly the activation and function of islet-antigen specific regulatory T cells. ELISPOT assays for IL-10 have been used successfully to detect IL-10 secretion following in vitro stimulation with islet antigen-derived peptides [28,58]. While IL-10 is clearly secreted by some human regulatory T cells [59,60], it is not the only cytokine or cellular pathway used by regulatory T cells [61]. Hence, a more direct measure of regulatory T cell function would be a useful tool. T cell responses measured by an in vitro assay are the outcome of complex interactions between antigen-presenting cells, effector and regulatory T cell subsets, antigen and components of the innate immune system. Many of these components are yet to be delineated clearly, but measuring the outcome of these interactions will help to dissect the contributing events.
Despite the challenges inherent in the detection and analysis of human islet autoantigen-specific T cells, several methods have been developed. The assays on this ‘short-list’ are currently being tested and optimized and will aid greatly in the development of immune therapies for T1D and other immune-based diseases.
Acknowledgments
The T-cell Workshop Committee of the Immunology of Diabetes Society (IDS) is generously supported by the Juvenile Diabetes Research Foundation (JDRF grant no. 5-2009-413). We thank members of the IDS Council for critical reading of the manuscript.
Appendix
Members of the T-Cell Workshop Committee of the Immunology of Diabetes Society: Barbara M. Brooks-Worrell, Veterans Affairs Puget Sound Health Care System, University of Washington, Seattle, WA, USA; Corrado M. Cilio, Lund University, Department. of Clinical Sciences, Cellular Autoimmunity Unit, Malmö, Sweden; Ivana Durinovic-Bellò, Benaroya Research Institute, Seattle, WA, USA; Peter A. Gottlieb, Barbara Davis Center for Childhood Diabetes, University of Colorado Denver, School of Medicine, Aurora, CO, USA; Roberto Mallone, INSERM, U986, DeAR Lab Avenir, Saint Vincent de Paul Hospital, Paris, France; Stuart I. Mannering, St Vincent's Institute of Medical Research, Fitzroy, Vic, Australia; Nanette C. Schloot, Institute for Clinical Diabetology, German Diabetes Center, Leibniz Institute for Diabetes Research at Heinrich-Heine-University and Department for Metabolic Diseases at University Hospital, Düsseldorf, Germany; Tim I. Tree, King's College London, Department of Immunobiology, London, UK; F. Susan Wong, University of Bristol, Department of Cellular and Molecular Medicine, Bristol, UK.
Disclosure
The authors have no conflicts of interest to declare.
References
- Atkinson MA, Maclaren NK. The pathogenesis of insulin-dependent diabetes mellitus. N Engl J Med. 1994;331:1428–36. doi: 10.1056/NEJM199411243312107. [DOI] [PubMed] [Google Scholar]
- 2.Anderson B, Park BJ, Verdaguer J, Amrani A, Santamaria P. Prevalent CD8(+) T cell response against one peptide/MHC complex in autoimmune diabetes. Proc Natl Acad Sci USA. 1999;96:9311–6. doi: 10.1073/pnas.96.16.9311. [DOI] [PMC free article] [PubMed] [Google Scholar]
- 3.Santamaria P, Utsugi T, Park BJ, Averill N, Kawazu S, Yoon JW. Beta-cell-cytotoxic CD8+ T cells from nonobese diabetic mice use highly homologous T cell receptor alpha-chain CDR3 sequences. J Immunol. 1995;154:2494–503. [PubMed] [Google Scholar]
- 4.Pinkse GG, Tysma OH, Bergen CA, et al. Autoreactive CD8 T cells associated with beta cell destruction in type 1 diabetes. Proc Natl Acad Sci USA. 2005;102:18425–30. doi: 10.1073/pnas.0508621102. [DOI] [PMC free article] [PubMed] [Google Scholar]
- 5.Keymeulen B, Vandemeulebroucke E, Ziegler AG, et al. Insulin needs after CD3-antibody therapy in new-onset type 1 diabetes. N Engl J Med. 2005;352:2598–608. doi: 10.1056/NEJMoa043980. [DOI] [PubMed] [Google Scholar]
- 6.Willcox A, Richardson SJ, Bone AJ, Foulis AK, Morgan NG. Analysis of islet inflammation in human type 1 diabetes. Clin Exp Immunol. 2009;155:173–81. doi: 10.1111/j.1365-2249.2008.03860.x. [DOI] [PMC free article] [PubMed] [Google Scholar]
- 7.Pugliese A, Eisenbarth GS. Human type 1 diabetes mellitus: genetic susceptiblity and resistance. In: Eisenbarth GS, Lafferty KJ, editors. Type 1 diabetes molecular, cellular, and clinical immunology. New York, Oxford: Oxford University Press; 1996. pp. 134–52. [Google Scholar]
- 8.Noble JA, Valdes AM, Cook M, Klitz W, Thomson G, Erlich HA. The role of HLA class II genes in insulin-dependent diabetes mellitus: molecular analysis of 180 Caucasian, multiplex families. Am J Hum Genet. 1996;59:1134–48. [PMC free article] [PubMed] [Google Scholar]
- 9.Onengut-Gumuscu S, Concannon P. Mapping genes for autoimmunity in humans: type 1 diabetes as a model. Immunol Rev. 2002;190:182–94. doi: 10.1034/j.1600-065x.2002.19014.x. [DOI] [PubMed] [Google Scholar]
- 10.Palmer JP, Asplin CM, Clemons P, et al. Insulin antibodies in insulin-dependent diabetics before insulin treatment. Science (NY) 1983;222:1337–9. doi: 10.1126/science.6362005. [DOI] [PubMed] [Google Scholar]
- 11.Solimena M, Folli F, Denis-Donini S, et al. Autoantibodies to glutamic acid decarboxylase in a patient with stiff-man syndrome, epilepsy, and type I diabetes mellitus. N Engl J Med. 1988;318:1012–20. doi: 10.1056/NEJM198804213181602. [DOI] [PubMed] [Google Scholar]
- 12.Rabin DU, Pleasic SM, Shapiro JA, et al. Islet cell antigen 512 is a diabetes-specific islet autoantigen related to protein tyrosine phosphatases. J Immunol. 1994;152:3183–8. [PubMed] [Google Scholar]
- 13.Wenzlau JM, Juhl K, Yu L, et al. The cation efflux transporter ZnT8 (Slc30A8) is a major autoantigen in human type 1 diabetes. Proc Natl Acad Sci USA. 2007;104:17040–5. doi: 10.1073/pnas.0705894104. [DOI] [PMC free article] [PubMed] [Google Scholar]
- 14.Bingley PJ, Christie M, Bonifacio E, et al. Combined analysis of autoantibodies improves prediction of IDDM in islet cell antibody-positive relatives. Diabetes. 1994;43:1304–10. doi: 10.2337/diab.43.11.1304. [DOI] [PubMed] [Google Scholar]
- 15.Verge CF, Stenger D, Bonifacio E, et al. Combined use of autoantibodies (IA-2 autoantibody, GAD autoantibody, insulin autoantibody, cytoplasmic islet cell antibodies) in type 1 diabetes: Combinatorial Islet Autoantibody Workshop. Diabetes. 1998;47:1857–66. doi: 10.2337/diabetes.47.12.1857. [DOI] [PubMed] [Google Scholar]
- 16.MacLeod MK, Clambey ET, Kappler JW, Marrack P. CD4 memory T cells: what are they and what can they do? Semin Immunol. 2009;21:53–61. doi: 10.1016/j.smim.2009.02.006. [DOI] [PMC free article] [PubMed] [Google Scholar]
- 17.Mannering SI, Brodnicki TC. CD4+ T-cell specificity and function in type 1 diabetes. Expert Rev Clin Immunol. 2007;3:557–64. doi: 10.1586/1744666X.3.4.557. [DOI] [PubMed] [Google Scholar]
- 18.Roep BO, Peakman M. Surrogate end points in the design of immunotherapy trials: emerging lessons from type 1 diabetes. Nat Rev Immunol. 2010;10:145–52. doi: 10.1038/nri2705. [DOI] [PubMed] [Google Scholar]
- 19.Herold KC, Hagopian W, Auger JA, et al. Anti-CD3 monoclonal antibody in new-onset type 1 diabetes mellitus. N Engl J Med. 2002;346:1692–8. doi: 10.1056/NEJMoa012864. [DOI] [PubMed] [Google Scholar]
- 20.Ludvigsson J, Faresjo M, Hjorth M, et al. GAD treatment and insulin secretion in recent-onset type 1 diabetes. N Engl J Med. 2008;359:1909–20. doi: 10.1056/NEJMoa0804328. [DOI] [PubMed] [Google Scholar]
- 21.Durinovic-Bello I, Rosinger S, Olson JA, et al. DRB1*0401-restricted human T cell clone specific for the major proinsulin73-90 epitope expresses a down-regulatory T helper 2 phenotype. Proc Natl Acad Sci USA. 2006;103:11683–8. doi: 10.1073/pnas.0603682103. [DOI] [PMC free article] [PubMed] [Google Scholar]
- 22.Altman JD, Moss PA, Goulder PJ, et al. Phenotypic analysis of antigen-specific T lymphocytes. Science (NY) 1996;274:94–6. doi: 10.1126/science.274.5284.94. [DOI] [PubMed] [Google Scholar]
- 23.Mallone R, Martinuzzi E, Blancou P, et al. CD8+ T-cell responses identify {beta}-cell autoimmunity in human type 1 diabetes. Diabetes. 2007;56:613–21. doi: 10.2337/db06-1419. [DOI] [PubMed] [Google Scholar]
- 24.Martinuzzi E, Novelli G, Scotto M, et al. The frequency and immunodominance of islet-specific CD8+ T-cell responses change after type 1 diabetes diagnosis and treatment. Diabetes. 2008;57:1312–20. doi: 10.2337/db07-1594. [DOI] [PubMed] [Google Scholar]
- 25.Martinuzzi E, Lemonnier FA, Boitard C, Mallone R. Measurement of CD8 T cell responses in human type 1 diabetes. Ann NY Acad Sci. 2008;1150:61–7. doi: 10.1196/annals.1447.015. [DOI] [PubMed] [Google Scholar]
- 26.Brooks-Worrell BM, Starkebaum GA, Greenbaum C, Palmer JP. Peripheral blood mononuclear cells of insulin-dependent diabetic patients respond to multiple islet cell proteins. J Immunol. 1996;157:5668–74. [PubMed] [Google Scholar]
- 27.Mannering SI, Morris JS, Jensen KP, et al. A sensitive method for detecting proliferation of rare autoantigen-specific human T cells. J Immunol Methods. 2003;283:173–83. doi: 10.1016/j.jim.2003.09.004. [DOI] [PubMed] [Google Scholar]
- 28.Arif S, Tree TI, Astill TP, et al. Autoreactive T cell responses show proinflammatory polarization in diabetes but a regulatory phenotype in health. J Clin Invest. 2004;113:451–63. doi: 10.1172/JCI19585. [DOI] [PMC free article] [PubMed] [Google Scholar]
- 29.Di Lorenzo TP, Peakman M, Roep BO, Mini-Review T. Series on type 1 diabetes: systematic analysis of T cell epitopes in autoimmune diabetes. Clin Exp Immunol. 2007;148:1–16. doi: 10.1111/j.1365-2249.2006.03244.x. [DOI] [PMC free article] [PubMed] [Google Scholar]
- 30.Mannering SI, Harrison LC, Williamson NA, et al. The insulin A-chain epitope recognized by human T cells is posttranslationally modified. J Exp Med. 2005;202:1191–7. doi: 10.1084/jem.20051251. [DOI] [PMC free article] [PubMed] [Google Scholar]
- 31.Mannering SI, Pang SH, Williamson NA, et al. The A-chain of insulin is a hot-spot for CD4+ T cell epitopes in human type 1 diabetes. Clin Exp Immunol. 2009;156:226–31. doi: 10.1111/j.1365-2249.2009.03907.x. [DOI] [PMC free article] [PubMed] [Google Scholar]
- 32.Peakman M, Tree TI, Endl J, van Endert P, Atkinson MA, Roep BO. Characterization of preparations of GAD65, proinsulin, and the islet tyrosine phosphatase IA-2 for use in detection of autoreactive T-cells in type 1 diabetes: report of phase II of the Second International Immunology of Diabetes Society Workshop for Standardization of T-cell assays in type 1 diabetes. Diabetes. 2001;50:1749–54. doi: 10.2337/diabetes.50.8.1749. [DOI] [PubMed] [Google Scholar]
- 33.Mannering SI, Purcell AW, Honeyman MC, McCluskey J, Harrison LC. Human T-cells recognise N-terminally Fmoc-modified peptide. Vaccine. 2003;21:3638–46. doi: 10.1016/s0264-410x(03)00402-x. [DOI] [PubMed] [Google Scholar]
- 34.Matsuo H, Batocchi AP, Hawke S, et al. Peptide-selected T cell lines from myasthenia gravis patients and controls recognize epitopes that are not processed from whole acetylcholine receptor. J Immunol. 1995;155:3683–92. [PubMed] [Google Scholar]
- 35.Herold KC, Brooks-Worrell B, Palmer J, et al. Validity and reproducibility of measurement of islet autoreactivity by T-cell assays in subjects with early type 1 diabetes. Diabetes. 2009;58:2588–95. doi: 10.2337/db09-0249. [DOI] [PMC free article] [PubMed] [Google Scholar]
- 36.Martinuzzi E, Scotto M, Enee E, et al. Serum-free culture medium and IL-7 costimulation increase the sensitivity of ELISpot detection. J Immunol Methods. 2008;333:61–70. doi: 10.1016/j.jim.2008.01.003. [DOI] [PubMed] [Google Scholar]
- 37.Meierhoff G, Ott PA, Lehmann PV, Schloot NC. Cytokine detection by ELISPOT: relevance for immunological studies in type 1 diabetes. Diabetes Metab Res Rev. 2002;18:367–80. doi: 10.1002/dmrr.320. [DOI] [PubMed] [Google Scholar]
- 38.Schloot NC, Meierhoff G, Karlsson Faresjo M, et al. Comparison of cytokine ELISpot assay formats for the detection of islet antigen autoreactive T cells. Report of the third Immunology of Diabetes Society T-Cell Workshop. J Autoimmun. 2003;21:365–76. doi: 10.1016/s0896-8411(03)00111-2. [DOI] [PubMed] [Google Scholar]
- 39.Manz R, Assenmacher M, Pfluger E, Miltenyi S, Radbruch A. Analysis and sorting of live cells according to secreted molecules, relocated to a cell–surface affinity matrix. Proc Natl Acad Sci USA. 1995;92:1921–5. doi: 10.1073/pnas.92.6.1921. [DOI] [PMC free article] [PubMed] [Google Scholar]
- 40.Seyfert-Margolis V, Gisler TD, Asare AL, et al. Analysis of T-cell assays to measure autoimmune responses in subjects with type 1 diabetes: results of a blinded controlled study. Diabetes. 2006;55:2588–94. doi: 10.2337/db05-1378. [DOI] [PubMed] [Google Scholar]
- 41.Goel A, Chiu H, Felton J, Palmer JP, Brooks-Worrell B. T-cell responses to islet antigens improves detection of autoimmune diabetes and identifies patients with more severe beta-cell lesions in phenotypic type 2 diabetes. Diabetes. 2007;56:2110–5. doi: 10.2337/db06-0552. [DOI] [PubMed] [Google Scholar]
- 42.Brooks-Worrell B, Gersuk VH, Greenbaum C, Palmer JP. Intermolecular antigen spreading occurs during the preclinical period of human type 1 diabetes. J Immunol. 2001;166:5265–70. doi: 10.4049/jimmunol.166.8.5265. [DOI] [PubMed] [Google Scholar]
- 43.Laemmli UK. Cleavage of structural proteins during the assembly of the head of bacteriophage T4. Nature. 1970;227:680–5. doi: 10.1038/227680a0. [DOI] [PubMed] [Google Scholar]
- 44.Lyons AB, Parish CR. Determination of lymphocyte division by flow cytometry. J Immunol Methods. 1994;171:131–7. doi: 10.1016/0022-1759(94)90236-4. [DOI] [PubMed] [Google Scholar]
- 45.Mannering SI, Dromey JA, Morris JS, Thearle DJ, Jensen KP, Harrison LC. An efficient method for cloning human autoantigen-specific T cells. J Immunol Methods. 2005;298:83–92. doi: 10.1016/j.jim.2005.01.001. [DOI] [PubMed] [Google Scholar]
- 46.Davis MM, Boniface JJ, Reich Z, et al. Ligand recognition by alpha beta T cell receptors. Annu Rev Immunol. 1998;16:523–44. doi: 10.1146/annurev.immunol.16.1.523. [DOI] [PubMed] [Google Scholar]
- 47.Nepom GT, Buckner JH, Novak EJ, et al. HLA class II tetramers: tools for direct analysis of antigen-specific CD4+ T cells. Arthritis Rheum. 2002;46:5–12. doi: 10.1002/1529-0131(200201)46:1<5::AID-ART10063>3.0.CO;2-S. [DOI] [PubMed] [Google Scholar]
- 48.Denkberg G, Cohen CJ, Segal D, Kirkin AF, Reiter Y. Recombinant human single-chain MHC–peptide complexes made from E. coli by in vitro refolding: functional single-chain MHC–peptide complexes and tetramers with tumor associated antigens. Eur J Immunol. 2000;30:3522–32. doi: 10.1002/1521-4141(2000012)30:12<3522::AID-IMMU3522>3.0.CO;2-D. [DOI] [PubMed] [Google Scholar]
- 49.Garboczi DN, Hung DT, Wiley DC. HLA-A2-peptide complexes: refolding and crystallization of molecules expressed in Escherichia coli and complexed with single antigenic peptides. Proc Natl Acad Sci USA. 1992;89:3429–33. doi: 10.1073/pnas.89.8.3429. [DOI] [PMC free article] [PubMed] [Google Scholar]
- 50.Novak EJ, Liu AW, Nepom GT, Kwok WW. MHC class II tetramers identify peptide-specific human CD4(+) T cells proliferating in response to influenza A antigen. J Clin Invest. 1999;104:R63–7. doi: 10.1172/JCI8476. [DOI] [PMC free article] [PubMed] [Google Scholar]
- 51.James EA, LaFond R, Durinovic-Bello I, Kwok W. Visualizing antigen specific CD4+ T cells using MHC class II tetramers. J Vis Exp. 2009 doi: 10.3791/1167. pii: 1167. doi: 10.3791/1167. [DOI] [PMC free article] [PubMed] [Google Scholar]
- 52.Yang J, Danke N, Roti M, et al. CD4+ T cells from type 1 diabetic and healthy subjects exhibit different thresholds of activation to a naturally processed proinsulin epitope. J Autoimmun. 2008;31:30–41. doi: 10.1016/j.jaut.2008.02.001. [DOI] [PubMed] [Google Scholar]
- 53.Casalegno-Garduno R, Schmitt A, Yao J, et al. Multimer technologies for detection and adoptive transfer of antigen-specific T cells. Cancer Immunol Immunother. 2009;59:195–202. doi: 10.1007/s00262-009-0778-4. [DOI] [PMC free article] [PubMed] [Google Scholar]
- 54.Durinovic-Bello I, Wu RP, Gersuk VH, Sanda S, Shilling HG, Nepom GT. Insulin gene VNTR genotype associates with frequency and phenotype of the autoimmune response to proinsulin. Genes Immun. 2010;11:188–93. doi: 10.1038/gene.2009.108. [DOI] [PMC free article] [PubMed] [Google Scholar]
- 55.Anikeeva N, Lebedeva T, Clapp AR, et al. Quantum dot/peptide-MHC biosensors reveal strong CD8-dependent cooperation between self and viral antigens that augment the T cell response. Proc Natl Acad Sci USA. 2006;103:16846–51. doi: 10.1073/pnas.0607771103. [DOI] [PMC free article] [PubMed] [Google Scholar]
- 56.Scriba TJ, Purbhoo M, Day CL, et al. Ultrasensitive detection and phenotyping of CD4+ T cells with optimized HLA class II tetramer staining. J Immunol. 2005;175:6334–43. doi: 10.4049/jimmunol.175.10.6334. [DOI] [PubMed] [Google Scholar]
- 57.Mallone R, Kochik SA, Reijonen H, et al. Functional avidity directs T-cell fate in autoreactive CD4+ T cells. Blood. 2005;106:2798–805. doi: 10.1182/blood-2004-12-4848. [DOI] [PMC free article] [PubMed] [Google Scholar]
- 58.Pfleger C, Meierhoff G, Kolb H, Schloot NC. Association of T-cell reactivity with beta-cell function in recent onset type 1 diabetes patients. J Autoimmun. 2010;34:127–35. doi: 10.1016/j.jaut.2009.08.004. [DOI] [PubMed] [Google Scholar]
- 59.Jonuleit H, Schmitt E, Schuler G, Knop J, Enk AH. Induction of interleukin 10-producing, nonproliferating CD4(+) T cells with regulatory properties by repetitive stimulation with allogeneic immature human dendritic cells. J Exp Med. 2000;192:1213–22. doi: 10.1084/jem.192.9.1213. [DOI] [PMC free article] [PubMed] [Google Scholar]
- 60.Tree TI, Lawson J, Edwards H, et al. Naturally arising human CD4 T cells that recognize islet autoantigens and secrete IL-10 regulate pro-inflammatory T cell responses via linked suppression. Diabetes. 2010;59:1451–60. doi: 10.2337/db09-0503. [DOI] [PMC free article] [PubMed] [Google Scholar]
- 61.Levings MK, Sangregorio R, Sartirana C, et al. Human CD25+CD4+ T suppressor cell clones produce transforming growth factor beta, but not interleukin 10, and are distinct from type 1 T regulatory cells. J Exp Med. 2002;196:1335–46. doi: 10.1084/jem.20021139. [DOI] [PMC free article] [PubMed] [Google Scholar]