

Abstract
Inflammatory bowel disease (IBD) is associated with imbalances of the local intestinal immune responses, with dysregulated CD4+ T cells contributing to the chronic inflammation. Having demonstrated altered T cell maturation in the thymus in two different mouse models of colitis, we set out to investigate whether abnormalities in T cell maturation is present in patients with ulcerative colitis (UC) or Crohn's disease (CD). Specimens were obtained from peripheral blood (CD; n = 14, UC; n = 22), colon and small intestinal specimens (CD; n = 6, UC; n = 13). As controls, peripheral blood specimens were obtained from healthy volunteers, patients with adenocarcinomas (n = 18) and colonic specimens from patients with adenocarcinomas (n = 14). Recent thymic emigrants were estimated by analysis of the normalized ratio of T cell receptor excision circles (TRECs) by real-time polymerase chain reaction (PCR). The frequency of naive- and proliferating T lymphocytes and markers of extrathymic T cell maturation in the mucosa was analyzed by flow cytometry and real time-PCR. TREC levels in peripheral blood T lymphocytes were similar between IBD patients and controls. In contrast, UC patients demonstrated significantly increased levels of TRECs both in intraepithelial and lamina propria lymphocytes from the colonic mucosa compared to patients with adenocarcinomas and CD. However, markers for extrathymic T cell maturation in the mucosa were not different between controls and IBD patients. The increased TREC levels in mucosal but not peripheral blood lymphocytes in UC patients in the absence of increased extrathymic maturation in situ in the mucosa together demonstrate that recent thymic emigrants are recruited rapidly to the inflamed mucosa of these patients.
Keywords: Crohn's disease, real-time PCR, T cell receptor excision circles, ulcerative colitis
Introduction
It is generally appreciated that alterations in T cell subsets may lead to an inflammatory bowel disease (IBD)-like syndrome: reconstitution of immunodeficient severe combined immunodeficient (SCID) mice with CD4+CD45RBhigh T cells [1,2], tgε26 mice transgenic for the human CD3ε gene displaying a lack of normal thymic microenvironment [3], interleukin (IL)-2-deficient mice challenged in vivo with trinitrophenyl-keyhole limpet haemocyanin (TNP-KLH) exhibiting a thymocyte maturation defect [4] and T cell receptor (TCR)-α chain-deficient mice [5] all develop colitis. In humans remission of Crohn's disease patients was observed after human immunodeficiency virus (HIV) infection [6] and thymectomy was demonstrated to prevent relapse in ulcerative colitis (UC) patients [7]. In addition, a case study described cure of UC by excision of an invasive thymoma [8].
T lymphocytes are generated from haematopoietic stem cells in the bone marrow and become immunocompetent through a maturation process in the thymus, during which they are termed thymocytes. In the thymus they undergo negative selection, deleting self-reactive thymocytes by apoptosis, thereby generating central tolerance.
Our previous studies on the Gαi2-deficient mouse model of colitis, as well as mice with dextran sodium sulphate (DSS)-induced colitis, demonstrated aberrant thymocyte development with reduced frequencies of immature and increased frequencies of mature thymocytes before and during onset of colitis, as well as reduced migration towards intrathymic chemokines [9,10]. We therefore hypothesized that similar abnormalities might also be present in human IBD. Due to the very limited access of thymic tissue from IBD patients, we used the technique of T cell receptor excision circle (TREC) analysis to investigate the relative abundance of recent thymic emigrants (RTE) in the periphery.
Upon entrance into the thymus the thymocytes undergo rearrangement of their TCR genes, along with intense proliferation. T lymphocytes have four sets of TCR genes that will form either of two types of heterodimers: αβTCRs which are expressed by the majority of peripheral T cells, or γδTCRs, expressed by a subset of T cells mainly in the skin and intestinal epithelium [11]. The great diversity in the antigen-recognizing domains of the TCR molecules are generated by random combinations of multiple variable (V), diversity (D) and joining (J) gene segments (TCR δ and β chains), or V and J gene segments (TCR γ and α chains). V(D)J recombination is initiated by the recognition of recombination signal sequences (RSSs) that flank the coding segments, and during this process the DNA located between the two RSS regions is circularized, forming an extrachromosomal circular excision product containing the two ligated RSS regions [11]. These so-called TRECs are stable and are not duplicated during mitosis, and are thus diluted-out with each cell division [12]. The levels of TRECs in naive T cells in peripheral blood are therefore a good measurement of thymic output. The method has been used extensively to study T cell reconstitution in highly active antiretroviral therapy (HAART)-treated HIV-patients [13] as well as after bone marrow transplantation following, e.g. myeloablative therapy for leukaemia [14].
In the present study we investigated the TREC levels in peripheral blood lymphocytes as well as in intraepithelial lymphocytes (IEL) and lamina propia lymphocytes (LPL) from the colon and small intestine of IBD patients, and compared that to healthy volunteers and patients undergoing therapeutic colectomy due to adenocarcinomas of the colon.
Materials and methods
Patients
Peripheral blood and colon or small intestinal specimens were obtained from IBD patients undergoing small intestinal resection or subtotal colectomy. The rectal specimens were obtained from patients undergoing proctectomy prior to the construction of a pelvic pouch. The patients were either in remission or in a chronic phase of the disease, the former undergoing different forms of reconstructive surgery while the latter were undergoing surgery with curative intent due to active disease. The diagnosis for each patient was determined on the basis of past and present clinical parameters and histopathological criteria post-surgery. The control group consisted of healthy volunteers (peripheral blood) and patients undergoing therapeutic bowel resection for adenocarcinomas (peripheral blood and colonic specimens). For the specimens from the adenocarcinoma patients only tissue from uninvolved colon was used. The data on the participating individuals are shown in Table 1.
Table 1.
Demographic data, specimen donation and experimental participation in the study.
| Peripheral blood |
Intestinal mucosa |
||||||||||||||||||
|---|---|---|---|---|---|---|---|---|---|---|---|---|---|---|---|---|---|---|---|
| TRECs analysis |
FACS analysis |
TRECs analysis |
FACS analysis |
Real-time PCR |
|||||||||||||||
| Patient | Diagnose | Disease activity | Sex | Age | Donation | Medication | PBMC | Integrin β7 | CD45RA | CD62L | Ki-67 | IEL1 | IEL2 | IEL3 | LPL | CD45RA | CD62L | ETMC | Rag1 and pre-TCR-α |
| 1 | UC | Active | M | 22 | Blood | No | x | ||||||||||||
| 2 | UC | Active | M | 26 | Blood | Steroids | x | x | |||||||||||
| 3 | UC | Active | M | 28 | Blood | Asacol, Steroids | x | x | x | ||||||||||
| 4 | UC | Active | F | 34 | Colon | 5-ASA | x | x | x | x | |||||||||
| 5 | UC | Active | M | 37 | Blood/colon | Asacol, Colazid | x | x | x | x | x | x | x | x | x | x | |||
| 6 | UC | Active | M | 39 | Blood/colon | No | x | x | x | x | |||||||||
| 7 | UC | Active | M | 45 | Blood/colon | Asacol | x | x | x | x | x | x | x | ||||||
| 8 | UC | Active | M | 45 | Blood/colon | Salazpyrin | x | x | x | x | x | x | |||||||
| 9 | UC | Active | M | 57 | Blood/rectum | 5-ASA | x | x | x | x | x | x | x | ||||||
| 10 | UC | Active | M | 61 | Blood | Asacol | x | ||||||||||||
| 11 | UC | Active | F | 63 | Blood | No | x | x | x | x | |||||||||
| 12 | UC | Active | M | 64 | Colon | No | x | x | x | x | |||||||||
| 13 | UC | Active | M | 65 | Blood/rectum | Steroids | x | x | x | x | x | x | x | x | x | x | x | x | |
| 14 | UC | No | F | 28 | Blood | Azathioprine | x | x | x | ||||||||||
| 15 | UC | No | F | 28 | Blood/colon | Azathioprine | x | x | x | x | |||||||||
| 16 | UC | No | M | 28 | Blood/rectum | Steroids, 5-ASA | x | x | x | x | x | x | x | x | x | x | x | ||
| 17 | UC | No | M | 28 | Blood/colon | No | x | x | x | x | x | x | x | x | x | x | x | ||
| 18 | UC | No | M | 31 | Blood | No | x | x | x | ||||||||||
| 19 | UC | No | M | 35 | Blood | No | x | ||||||||||||
| 20 | UC | No | M | 36 | Blood | No | x | x | x | x | |||||||||
| 21 | UC | No | M | 43 | Blood | 5-ASA | x | x | x | ||||||||||
| 22 | UC | No | F | 45 | Blood/colon | Steroids | x | x | x | x | x | x | x | x | |||||
| 23 | UC | No | M | 58 | Blood/rectum | No | x | x | x | x | x | x | x | x | x | x | x | x | |
| 24 | UC | No | M | 63 | Blood | No | x | ||||||||||||
| 1 | CD | Active | F | 19 | Blood/SI | Enterocort | x | x | x | x | x | x | x | x | |||||
| 2 | CD | Active | M | 29 | Blood/colon | No | x | x | x | x | x | x | x | x | |||||
| 3 | CD | Active | F | 35 | Blood/SI | No | x | x | x | x | x | x | x | x | |||||
| 4 | CD | Active | F | 38 | Blood | No | x | x | x | x | |||||||||
| 5 | CD | Active | F | 38 | Blood | No data | x | x | x | ||||||||||
| 6 | CD | Active | F | 40 | Blood/SI | Enterocort, Remicade, 5-ASA, | x | x | x | x | x | x | x | ||||||
| 7 | CD | Active | M | 42 | Blood/SI | Steroids | x | x | x | x | x | x | x | x | x | x | |||
| 8 | CD | Active | F | 49 | Blood | Enterocort | x | x | |||||||||||
| 9 | CD | Active | F | 56 | Blood | Azathioprine | x | x | x | x | x | ||||||||
| 10 | CD | Active | M | 62 | Blood | No | x | ||||||||||||
| 11 | CD | Active | F | 78 | Blood/SI | No | x | x | x | ||||||||||
| 12 | CD | Active | F | unk | Blood | No | x | ||||||||||||
| 13 | CD | No | M | 63 | Blood | Azathioprine | x | x | x | x | |||||||||
| 14 | CD | No | M | 32 | Blood | No | x | x | x | ||||||||||
| 1 | Ctr | No | M | 27 | Blood | x | x | x | |||||||||||
| 2 | Ctr | No | F | 29 | Blood | x | x | x | |||||||||||
| 3 | Ctr | No | F | 42 | Blood | x | x | x | |||||||||||
| 4 | Ctr | No | F | 42 | Blood | x | x | x | |||||||||||
| 5 | Ctr | No | M | 50 | Colon | x | x | x | x | x | x | x | |||||||
| 6 | Ctr | No | M | 54 | Blood/colon | x | x | x | x | x | x | x | x | x | |||||
| 7 | Ctr | No | F | 55 | Blood | x | x | x | |||||||||||
| 8 | Ctr | No | M | 57 | Blood | x | x | x | |||||||||||
| 9 | Ctr | No | M | 79 | Blood/colon | x | x | x | x | x | x | x | x | x | x | ||||
| 10 | Ctr | No | F | 59 | Blood/rectum | x | x | x | x | x | x | x | |||||||
| 11 | Ctr | No | M | 61 | Blood/colon | x | x | x | x | x | x | x | |||||||
| 12 | Ctr | No | F | 62 | Blood | x | x | x | |||||||||||
| 13 | Ctr | No | F | 70 | Rectum | x | x | x | x | ||||||||||
| 14 | Ctr | No | F | 66 | Colon | x | x | x | x | x | x | x | x | ||||||
| 15 | Ctr | No | M | 71 | Blood/rectum | x | x | x | x | x | x | x | |||||||
| 16 | Ctr | No | F | 73 | Blood/colon | x | x | x | x | x | |||||||||
| 17 | Ctr | No | F | 75 | Colon | x | x | x | x | x | x | x | |||||||
| 18 | Ctr | No | F | 76 | Colon | x | x | x | x | x | x | x | |||||||
| 19 | Ctr | No | F | 80 | Colon | x | x | x | x | x | x | ||||||||
| 20 | Ctr | No | M | unk | Blood | x | |||||||||||||
| 21 | Ctr | No | F | unk | Colon | x | x | ||||||||||||
| 22 | Ctr | No | F | unk | Rectum | x | |||||||||||||
| BC1 | Ctr | No | – | – | Blood (buffy coat) | x | x | x | x | ||||||||||
| BC2 | Ctr | No | – | – | Blood (buffy coat) | x | x | x | x | ||||||||||
| BC3 | Ctr | No | – | – | Blood (buffy coat) | x | x | x | x | ||||||||||
| BC4 | Ctr | No | – | – | Blood (buffy coat) | x | x | x | x | ||||||||||
Demographic data of all specimens donated from patients with ulcerative colitis, Crohn's disease and adenocarcinomas and buffy coats as well as healthy volunteers. x indicates that an experiment has been performed. FACS: fluorescence activated cell sorter; IEL: intraepithelial lymphocytes; LPL: lamina propia lymphocytes; PCR: polymerase chain reaction; TCR: T cell receptor; M: male; F: female.
Cell preparation
Peripheral blood mononuclear cells (PBMCs) were isolated by Ficoll/Hypaque (Amersham Biosciences AB, Uppsala, Sweden) density gradient centrifugation. When indicated, cells were stained with anti-integrin β7 allophycocyanin (APC) (clone FIB504; Miltenyi Biotec GmbH, Bergisch Gladbach, Germany), incubated with anti-APC-conjugated magnetic beads and separated once on the positive selection program on an Auto-MACS (Miltenyi Biotec GmbH). The positively selected lymphocytes were 91 ± 9% integrin β7-positive, whereas the remaining lymphocyte population contained 36 ± 12% integrin β7+ lymphocytes as judged by fluorescence activated cell sorter (FACS) analysis. The frequency of integrin β7+ lymphocytes in the unseparated cell population was 56 ± 12%. The mucosal layers of the intestinal specimens were separated mechanically from underlying fat and muscle tissue with scissors and cut into small pieces. The mucosal fragments were incubated 4 × 15 min at 37°C on a magnetic stirrer in RPMI-1640 medium containing 10% AB-serum, 1 mM ethylenediamine tetraacetic acid (EDTA) (Sigma-Aldrich Chemie GmbH, Stienheim, Germany) and 1 mM DL-dithiothreitol (Sigma-Aldrich). Supernatants from the three first incubations, containing IEL, were poured over a nylon mesh, washed twice and kept on ice until further analysis. The remaining mucosal pieces were washed twice with Hanks' balanced salt solution (HBSS) and were then incubated at 37°C on a magnetic stirrer in RPMI-1640 medium containing 5% AB-serum, 0·1 mg/ml DNAse 1 (D-5025; Sigma-Aldrich) and 100 U/ml collagenase (C-7657; Sigma-Aldrich) for 1·5–2 h. Cells released into the supernatant, containing LPL, were separated from mucosal pieces by 100-µm pore size cell strainers (BD Bioscience, Bedford, MA, USA) and were then washed in phosphate-buffered saline (PBS), and put on ice. IEL, LPL or peripheral blood lymphocytes (1–5 × 10⁶) were each diluted in 200 µl PBS containing 0·6 mM/ml Proteinase K (Sigma-Aldrich) and 200 µl lysis buffer AL (QIAamp DNA Blood Mini kit, Qiagen, Hilden, Germany), incubated for 10 min at 56°C and then stored at room temperature in lysis buffer AL until further use. IEL, LPL or intestinal mucosal biopsies (2 × 10⁶) were also incubated in RNAlater (Ambion, Austin, TX, USA) at 4°C overnight and then stored at −80°C.
Flow cytometry
Peripheral blood and mucosal lymphocytes (1 × 10⁶) in a volume of 30 µl were incubated at 4°C for 20 min with a cocktail of the following antibodies: anti-CD4-APC, anti-CD3-peridinin chlorophyll (PerCP), anti-CD62L-phycoerythrin (PE) and anti-CD45RA-fluorescein isothiocyanate (FITC) (BD multi-test for naive CD4+ T cells; BD Biosciences, San Jose, CA, USA). For analysis of extrathymic maturation of T lymphocytes in the intestinal mucosa, 1 × 10⁶ LPL in a volume of 30 µl were stained with the following mouse anti-human antibodies CD2-PECy5, CD3-Pacific-blue (clone: UCHT1), CD5-APC (clone: L1712), CD7-FITC, CD16-PE and CD19-PE (all from BD Biosciences). Isotype controls were mouse immunoglobulin (Ig)G1-PE, mouse IgG2a-FITC, mouse IgG1-PECy5, mouse IgG2a-APC (clone: G155-178) and mouse IgG1-Pacific blue (clone: MOPC-21) (all from BD Biosciences). For analysis of the frequency of proliferating T lymphocytes in peripheral blood the cells were prestained with anti-CD3 Pacific-blue, permeabilized and fixed with 100 µl fixation and permeabilization buffer (Nordic BioSite, Täby, Sweden), incubated at 4°C overnight and stained with Ki-67-PE or isotype control IgG1κ (Ki-67 PE-conjugated reagent set; BD Biosciences Pharmingen) in 50 µl permeabilization buffer (Nordic BioSite). Flow cytometry was performed by acquisition of at least 20 000 lymphocytes, based on forward- and side light-scatter characteristics, on a BD LSR II (BD Biosciences) and subsequent analysis was performed using FlowJo software (Tree Star Inc., San Carlo, CA, USA).
Genomic DNA extraction and reverse transcription–polymerase chain reaction (RT–PCR) for TRECs
Genomic DNA from peripheral blood or mucosal lymphocytes was purified by the QIAamp DNA Blood Mini kit (Qiagen) according to the manufacturer's instructions. Prior to the PCR, the DNA concentrations in all samples were determined by ultraviolet spectrophotometry at 260 and 280 nm wavelengths and adjusted to a concentration of 30 ng/µl.
The amount of TRECs relative to the amount of the reference DNA sequence, originating from the glyceraldehyde-3-phosphate dehydrogenase (GAPDH), was determined by quantitative real-time PCR (LightCycler 1·2; Roche Diagnostics GmbH, Roche Applied Science, Mannheim, Germany), using specific primers and the fluorescent dye SybrGreen I for detection of the specific products. The PCR primers were purchased from Scandinavian Gene Synthesis AB (Köping, Sweden). The sequences were as follows: TREC forward: 5′-CAT CCC TTT CAA CCA TGC TGA CAC CTC T-3′ and reverse: 5′-CGT GAG AAC GGT GAA TGA AGA GCA GAC A-3′; GAPDH forward: 5′-CAG CCC CTT CAT ACC CTC A-3′ and reverse 5′-GGA CCA TAT TGA GGG ACA CA-3′, generating specific products of 142 base pairs (bp) for TREC and of 240 bp for GAPDH.
Each 20 µl PCR reaction contained 2 µl of DNA and 18 µl of mastermix containing FastStart DNA Master SybrGreen I, 4 mM MgCl2(both from Roche), 0·5 µM of each primer and sterile dH2O.
The PCR was performed as follows: one cycle of denaturation at 95°C for 10 min, 45 cycles of amplification consisting of denaturation at 95°C for 10 s, primer annealing at 72–62°C for 5 s (0·5°C drop in each cycle for 20 cycles) and extension at 72°C for 6 s, followed by melting at 95°C for 0 s, 62°C for 10 s and 95° for 0 s (0·1°C/s temperature increase) and ending by cooling at 40°C for 30 s.
RNA extraction
Frozen mucosal tissue, preincubated in RNAlater, as well as frozen thymic tissue obtained from human infants undergoing cardiac surgery, was homogenized with a mortar and pestle in liquid nitrogen and then added to RLT buffer (RNeasy mini kit, Qiagen). Frozen cells, preincubated in RNAlater, were placed in RLT buffer directly and both tissues and cells were homogenized by passing the lysate through a blunt 20-gauge needle. RNA was purified by the RNeasy mini kit (Qiagen) according to the manufacturer's instructions. The RNA concentrations in all samples were determined by ultraviolet spectrophotometry at 260 and 280 nm and the purity and integrity of extracted RNA was confirmed by electrophoresis in a 1% agarose gel. Fifty ng/µl RNA was reverse-transcribed to cDNA using QuantiTect reverse transcription kit (Qiagen) according to the manufacturer's instructions and then stored at −20°C.
Detection of recombination activation gene (RAG1) and pre-TCR-α transcripts
The amount of RAG1 and pre-TCR-α mRNA relative to the amount of the reference gene CD3γ mRNA was determined by real-time PCR (LightCycler480; Roche Diagnostics GmbH), using specific primers and human universal probes as specified below for detection of specific products. The PCR primers were purchased from Invitrogen, Paisley, UK. The sequences were as follows: RAG1 forward: 5′-ATT GCA GAC ATC TCA ACA CTT TG-3′ and reverse: 5′-GAA AGA GGC TGC CAT GCT-3′; pre-TCR-α forward: 5′-TCC TGC CTC CTT CCG AGT-3′ and reverse: 5′-CCA GAG AAG GAA AGG GTG TG-3′; CD3γ forward: 5′-TTG GGG TCT ACT TCA TTG CTG-3′ and reverse: 5′-AAC AGA GTC TGC TTG TCT GAA GC-3′. These primers generated specific products of 74, 111 and 70 bp, respectively. Each 15 µl PCR reaction contained 80 ng of cDNA in a volume of 5 µl, 5 µl LightCycler480 Probes Master and 0·2 µl human universal probe number; 27 (RAG1-primer), 2 (pre-TCR-α-primer) or 58 (CD3γ-primer), 0·2 µl (20 µM) of each primer and 4·4 µl RNase free dH20. The PCR was performed as follows: denaturation at 95°C for 10 min, 45 cycles of amplification at 95°C for 10 s, annealing at 60°C for 30 s and extension at 72°C for 1 s, before the samples were cooled at 40°C for 30 s. All mastermixes and probes were purchased from Roche.
Calibrator-normalized relative quantification of TREC, RAG1 and pre-TCR-α including efficiency correction
To calibrate TREC levels in our samples, DNA from umbilical cord blood mononuclear cells, known previously to contain high levels of TRECs, was used as calibrator as well as the reference gene GAPDH. For calibration of RAG1 and pre-TCR-α levels, cDNA from human infant thymi was used as calibrator as well as the reference gene CD3γ. Calibrator and samples were run in triplicate and a mean was calculated. For each sample and calibrator the relative amount of the target and reference gene was determined by the calculation of the crossing point (Cp) values and results of normalized ratios of TREC were calculated by the following equation: (TRECsample/GAPDHsample)/(TRECcalibrator/GAPDHcalibrator). Normalized ratios of RAG1 or pre-TCR-α were calculated by similar equations: (RAG1sample or pre-TCR-αsample/CD3γsample)/(RAG1calibrator or pre-TCR-αcalibrator/CD3γcalibrator). The normalized ratio corrects for sample inhomogeneities and detection-caused variations. The efficiency-corrected quantification was performed automatically by the Relative Quantification (RQ) Software and the Light Cycler480 analysis program (Roche Diagnostics, GmbH) for TREC and RAG1/pre-TCR-α, respectively, and was based on relative standard curves describing the PCR efficiencies of the target and reference genes.
Statistical analysis
Data are shown as mean ± standard deviation (s.d.) in the text, or as values for individual specimens in the figures. The Mann–Whitney non-parametric test was used for determination of significances. For correlation analysis between TREC content and age, Pearson's correlation (r) was used. Values of P ≤ 0·05 were considered to be significant.
Ethical considerations
The study protocol was approved by the Ethical Committee of Sahlgrenska University Hospital and informed consent was obtained from all participating IBD patients and healthy controls before entering this study.
Results
Equal amounts of TRECs in peripheral blood lymphocytes from IBD patients and healthy controls
To analyse the production and output of newly matured T lymphocytes from the thymus during chronic intestinal inflammation, we first analysed the relative amount of TRECs in peripheral blood lymphocytes from IBD patients compared to healthy controls. The TREC levels in peripheral blood T lymphocytes from IBD patients was not significantly different between UC (9·5% ± 11·9%) and CD (15·6% ± 14·6%) patients and healthy controls (15·3% ± 13·2%), although a trend towards reduced TREC levels in the UC patients was seen (Fig. 1). As lymphocytes en route to the intestinal mucosa express the homing receptor integrin α4β7, the PBMCs were separated into one subpopulation enriched for integrin β7-positive lymphocytes and one subpopulation with the remaining cells. Sorted integrin β7+ lymphocytes demonstrated decreased TREC levels in both UC (9·8% ± 9·4%) and CD (9·8% ± 11·3%) patients (Fig. 1), compared to healthy controls (21·9% ± 22·4%), even though no statistically significant difference was found. In fact, four of 11 of the UC patients showed undetectable levels of TRECs compared to only one of nine in the control group. A similar trend was seen in the remaining cell population (data not shown). Collectively, these results demonstrate a thymic output in IBD patients comparable to what is found in healthy individuals.
Fig. 1.
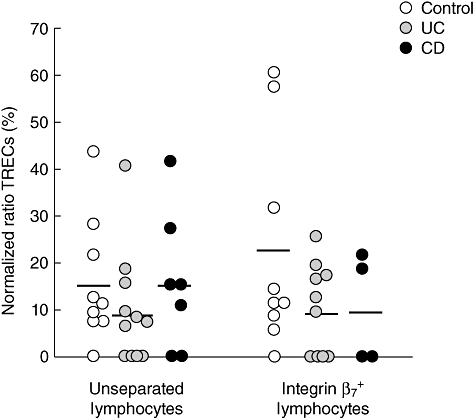
Comparable levels of T cell receptor excision circles (TRECs) in peripheral blood in inflammatory bowel disease (IBD) patients and healthy controls. Relative amounts of TRECs in unseparated and positively selected integrin β7+ peripheral blood mononuclear cells (PBMC) populations, respectively, from healthy controls and colon cancer patients (n = 9, white circles), ulcerative colitis patients (n = 10–11, grey circles) and Crohn's disease patients (n = 4–7, black circles). Results are expressed as normalized ratios between relative amounts of TRECs and the reference gene glyceraldehyde-3-phosphate-dehydrogenase (GAPDH) as % of a highly positive standard (cord blood = 100%). Each dot represents a single individual and horizontal bars indicate mean value within the group.
As TREC levels are reduced with increased cell division within the T cell population, we examined the frequency of proliferating cells within the CD3+ T lymphocyte population in peripheral blood from IBD patients and healthy controls by investigating the expression of the proliferation marker Ki-67. The frequency of Ki-67+ CD3+ T lymphocytes in peripheral blood was not different between IBD patients and healthy controls [mean value; 2·0 ± 1·3% in UC (n = 10), 2·6 ± 1·6% in CD (n = 8) and 1·8 ± 0·9% in Ctr (n = 6)]. In addition, CD4+ T lymphocytes were analysed for their expression of the naive cell surface markers CD45RA and CD62L in peripheral blood. No significant difference was found between IBD patients and healthy individuals [mean values CD45RA; 25 ± 26% in UC (n = 13), 14 ± 10% in CD (n = 10) and 21 ± 16% in Ctr (n = 14), mean values CD62L; 79 ± 20% in UC (n = 12), 75 ± 13% in CD (n = 10) and 77 ± 12% in Ctr (n = 14)]. Thus, the low/undetectable TREC levels in peripheral blood in a number of IBD patients cannot be explained by increased proliferation of T lymphocytes or reduced frequencies of naive T cells.
Increased frequencies of CD62L+ T lymphocytes in the lamina propria in UC patients
To investigate whether recent thymic emigrants are recruited rapidly to the intestinal mucosa in IBD patients and reside for only a short time in peripheral blood, we first examined the frequency of mucosal T lymphocytes from IBD patients displaying a naive phenotype, compared to uninflamed controls. The frequency of CD4+ lamina propria T cells expressing CD62L, a marker for naive lymphocytes and/or lymphocytes homing to lymph nodes via binding to peripheral node addressins (PNAds) on high endothelial venules (HEV) or to the intestine via binding to the carbohydrate moiety of MAdCAM-1, was increased significantly in UC patients compared to controls and CD patients (Fig. 2a). As expected, the frequencies of CD4+CD45RA+ T lymphocytes were very low in the lamina propria, ranging from zero to 6%. We were not able to detect any statistically significant differences between the groups, but the mean frequencies of CD4+CD45RA+ T lymphocytes were 2% and 2·1% in the UC and CD groups, respectively, compared to 0·9% in the control group (Fig. 2b).
Fig. 2.
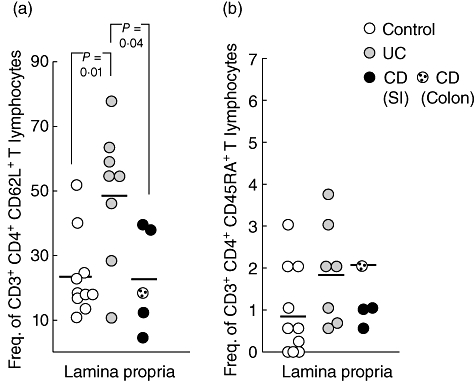
Increased frequency of CD62L+ T lymphocytes in the lamina propria of ulcerative colitis (UC) patients. Lamina propria lymphocytes from uninflamed control patients (n = 10, white circles), UC patients (n = 7–8, grey circles) and Crohn's disease patients (n = 4–5, black circles) were stained with anti-CD3-peridinin chlorophyll (PerCP), anti-CD4-allophycocyanin (APC), anti-CD45RA-fluorescein isothiocyanate (FITC) and anti-CD62L-phycoerythrin (PE). Symbols represent frequencies of (a) CD3+CD4+CD62L+ lymphocytes and (b) CD3+CD4+CD45RA+ lymphocytes from individual specimens and horizontal bars indicate mean value within the group. Statistical analysis was performed using the Mann–Whitney non-parametric test.
Increased levels of TRECs in the intestinal mucosa of UC patients
A more direct measurement of the amount of recent thymic emigrants (RTE) in the intestinal mucosa is the quantification of the relative amounts of TRECs in situ in the gut. The relative TREC levels were estimated in LPL as well as IEL. During the isolation of IEL three fractions of lymphocytes are obtained based on the duration of the incubation of the tissue in EDTA, and the three fractions were analysed separately.
The mean normalized TREC ratio in the intestinal mucosa was reduced dramatically compared to peripheral blood, especially in CD patients and uninflamed controls, due most probably to the fact that mucosal lymphocytes are, in the vast majority, activated/memory lymphocytes [15,16]. Interestingly, however, the amount of TRECs were significantly higher in all three IEL fractions from UC patients, compared to controls (Fig. 3). In fact, all but one of the uninflamed controls had undetectable TREC levels in all three IEL fractions. The increased TREC levels were seen only in UC patients and not in CD patients. Significantly increased TREC levels were also seen in LPL from UC patients compared to uninflamed controls. Again, no increased TREC levels were found in LPL from CD patients. Thus, UC patients have a high influx of RTE into the colonic mucosa.
Fig. 3.
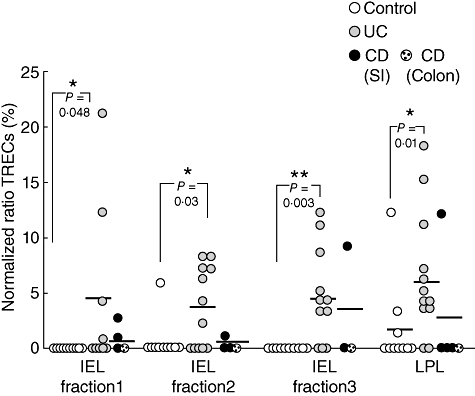
Increased T cell receptor excision circles (TREC) levels in the intestinal mucosa of ulcerative colitis (UC) patients. TREC levels in intraepithelial lymphocytes (IEL) fractions 1–3 and lamina propia lymphocytes (LPL), isolated from uninflamed patients (n = 10, white circles), UC patients (n = 9–12, grey circles) and Crohn's disease patients (n = 3–5, black circles). Results are expressed as normalized ratios of relative amounts of TREC and the reference gene glyceraldehyde-3-phosphate-dehydrogenase (GAPDH) as % of a highly positive standard (cord blood = 100%). Symbols represent values for individual specimens, and horizontal bars indicate mean within the group. Statistical analysis was performed using the Mann–Whitney non-parametric test.
Equal levels of TRECs in UC patients with active and inactive disease
To evaluate further the high influx of RTE into the colonic mucosa in UC patients, we next examined the TREC levels in UC patients with active compared to inactive disease. No statistically significant differences in TREC levels could be demonstrated: [active versus inactive: IEL1; 4·4 ± 9·3% (n = 5) versus 4·0 ± 5·7% (n = 4), IEL2; 2·9 ± 3·2% (n = 7) versus 4·4 ± 4·1% (n = 5), IEL3; 2·9 ± 3·1% (n = 7) versus 7·5 ± 4·7% (n = 4) and LPL; 5·9 ± 5·2% (n = 7) versus 7·0 ± 6·7% (n = 5), respectively]. These results indicate that RTE are recruited to the intestinal mucosa in UC patients, irrespective of disease activity.
TREC levels in the intestinal mucosa of UC patients are not influenced by age
Thymus size, activity and output are highest early in life. By increasing age, this process decreases and results in limited production of newly produced naive T cells. To exclude the possibility that the high TREC levels seen in the intestinal mucosa in UC patients is only a natural result of high thymic output within the patient group due a younger mean age, 40·6 (19–65) years, compared to the control group consisting of colon cancer patients with a mean age of 67·8 (50–80) years, a correlation analysis was carried out between age and the TREC levels.
TREC levels in peripheral blood from IBD patients (both UC and CD) with active and inactive disease and healthy individuals were plotted against age and analysed with Pearson's correlation test. Peripheral blood lymphocytes demonstrated a trend towards decreased TREC levels with increasing age but did not reach statistical significance (r = −0·42, P = 0·053, data not shown). Moreover, a correlation analysis on TREC data from IBD patients alone showed no significant correlation between TREC levels and age (r = −0·26, P = 0·56, data not shown), nor did analysis of IBD patients with active and inactive inflammation separately improve the correlation (r = −0·21, P = 0·56 and r = −0·33, P = 0·89, respectively, data not shown).
To analyse if the increased TREC levels seen in the intestinal mucosa of UC patients were dependent upon age, a similar correlation analysis was performed with the TREC data from lamina propria lymphocytes from IBD patients and uninflamed controls. The results from the uninflamed controls are very homogeneous; high age spans with negative TREC levels, while the results from the IBD patients had a generally lower age span with both positive- and negative TREC levels. To be able to judge if there is a correlation between age and TREC levels in LPL, all results with undetectable TREC levels from both uninflamed controls and IBD patients were excluded and only those with a positive TREC value were included in the correlation analysis, irrespective of diagnosis. Similar to peripheral blood, no significant correlation was found between TREC levels in LPL and age of the individual (r = 0·084, P = 0·78, data not shown).
Thus, the levels of TREC containing lymphocytes in the intestinal mucosa are independent of the activity of the intestinal inflammation and increasing age has no or low influence on the levels of TRECs in IBD patients either in peripheral blood or in the intestinal mucosa (data not shown). These correlation analyses demonstrate that the elevated TREC levels seen in UC patients in the intestinal mucosa are not a result of age difference between IBD patients and the uninflamed controls.
Increased TREC levels in the intestinal mucosa of UC patients is not due to extrathymic maturation of T cells in situ in the mucosa
There are several lines of evidence demonstrating that T lymphocytes can develop in situ in the intestine [17,18]. As TRECs are formed during TCR gene rearrangement, the possibility that the high levels of TRECs seen in the inflamed mucosa in UC patients was due to extrathymic maturation could not be excluded. To establish that the increased levels of TRECs seen in the intestinal mucosa of UC patients stem from T cells of thymic origin and not from progenitor T lymphocytes recruited from the bone marrow directly to the inflamed intestinal mucosa, we analysed the intestinal T lymphocytes for subpopulations of early lineage T cells, being CD16-CD19-CD2+CD5+CD7+CD3- using five-colour flow cytometry. The staining is restricted to LPL as the limited numbers of IEL retrieved in the isolation procedure was not sufficient to perform this analysis. A representative dot plot demonstrating the gating on CD16-CD19-CD2+ lymphocytes and subsequently on CD5+CD7+ and CD3low/− lymphocytes is shown (Fig. 4a). Figure 4b summarizes the data from LPL from uninflamed controls and IBD patients and demonstrate that the frequency of early T cell progenitors is similar in the two groups.
Fig. 4.
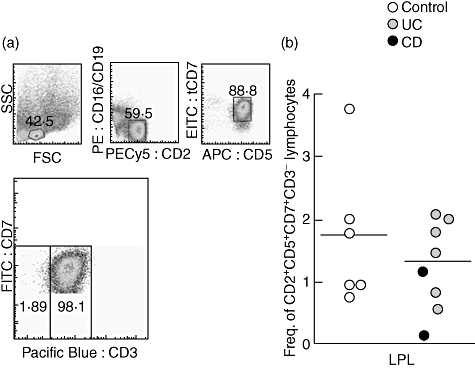
Similar levels of extrathymic maturation in inflammatory bowel disease (IBD) patients and controls. (a) Representative flow cytometric analysis of lamina propria lymphocytes staining negative for CD16-phycoerythrin (PE), CD19-PE and CD3-Pacific blue and positive for CD2-PE-Cy5, CD5-allophycocyanin (APC) and CD7-fluorescein isothiocyanate (FITC). The CD16-CD19-CD2+CD5+CD7+CD3- cells were considered to be extrathymically maturing T cell precursors. The gating was based on three control stainings on the same population in the same patients, (i) unstained cells; (ii) isotype controls for each antibody; and (iii) gating on CD16-CD19-CD2+CD5+CD7+ lymphocytes without CD3 Pacific blue staining. (b) Frequency of CD16-CD19-CD3-2+5+7+ lamina propria lymphocytes in IBD patients (ulcerative colitis patients n = 6, Crohn's disease patients n = 2) and uninflamed controls (n = 6). Symbols represent values for individual specimens, and horizontal bars indicate mean within the group. Statistical analysis was performed using the Mann–Whitney non-parametric test.
To further exclude enhanced extrathymic maturation in IBD patients we also analysed the expression of mRNA encoding one of two subunits of the heterodimeric RAG protein participating in the initial process of TCR gene rearrangement, RAG1, as well as the expression of pre-TCR-α mRNA, a surrogate, invariant TCR-α chain pairing with the rearranged TCR-β chain during T cell maturation. Both these genes are expressed transiently during T cell development, but not in mature T lymphocytes. RAG1 and pre-TCR-α mRNA levels were quantified by real-time PCR in intestinal mucosal biopsies, which includes mRNA from both IEL and LPL. The results demonstrated equally low or undetectable levels in both IBD patients (UC; n = 5, CD; n = 1) and controls (n = 7) (data not shown).
Collectively, these data suggest strongly that the increased TREC levels seen in UC patients is not a result of increased extrathymic maturation in the intestinal mucosa of IBD patients.
Discussion
This is, to our knowledge, the first study investigating TREC levels in IBD patients. Here we demonstrate equal levels of TRECs in peripheral blood between IBD patients and healthy controls but increased levels of TRECs in the intestinal mucosa of UC patients, but not CD patients, compared to uninflamed controls. In addition to the increased TREC levels in the colon of UC patients, these patients also demonstrated high frequencies of CD3+CD4+ T cells expressing the adhesion molecule L-selectin (CD62L+) but with low expression of CD45RA. We also demonstrated that age has a low impact on the levels of TRECs in the intestinal mucosa and that disease activity did not affect TREC levels in either peripheral blood or the intestinal mucosa. As no increased extrathymic maturation was found in the intestinal mucosa, this strongly suggests that the increased levels of TRECs in the intestinal mucosa of UC patients reflect recent thymic emigrants (RTE) being recruited directly to the mucosa.
Substantial efforts have been devoted to identify a phenotype for RTE and candidate T cell surface markers exist for chicken (chT1) [19,20] and rats (Thy-1, RT6) [21]. For humans, two markers have recently been proposed: CD31 and CD103, both being present on thymocytes at a late stage of development but being lost quickly after T cell entrance into the periphery. However, although the amount of CD31+ T cells are reduced with increasing age [22–24], the TREC levels within the CD31+ T cell population are also declined [23], suggesting a certain degree of in vivo turnover of CD31+ T cells with ageing. Thus, we believe that TREC content is at present the most reliable marker for recent thymic emigrants, at least when investigating both CD4+ and CD8+ T lymphocytes in the gut mucosa.
TREC quantification has been used to monitor T lymphocyte ontogeny in patients with multiple sclerosis (MS) [25] and rheumatoid arthritis (RA) [26,27]. In line with our findings in UC patients, both studies reported decreased levels of TREC in peripheral blood lymphocytes from patients, compared to healthy controls [25,27]. However, neither study evaluated TREC levels in the affected tissue, the central nervous system (CNS) and joints, respectively. TREC levels in the intestinal mucosa were generally much lower than in peripheral blood in control subjects. This is consistent with the fact that the gut mucosa predominantly contains memory/effector T lymphocyte populations, in which the TRECs will be diluted due to extensive previous proliferation.
When comparing TREC content in the three different IEL fractions obtained during the isolation procedure, we found that the number of individuals with positive TREC levels increased from the first to the third fraction in UC patients. Although we do not know the exact reason for this, it is likely that the T lymphocytes in the first fraction represent cells having migrated up along the villus–crypt axis, which have probably undergone more cycles of proliferation compared to their crypt counterparts, and will thus contain lower levels of TRECs.
Because TRECs are stable within the original T cell and do not duplicate during mitosis they are diluted out in the periphery with antigen-driven or homeostatic cell division [28]. However, in healthy individuals, only homeostatic proliferation of naive T cells is likely to affect peripheral T cell TREC content significantly, as antigen-induced T cell proliferation will, to the most extent, affect memory/antigen-primed T cells with very minute amounts of TRECs, and thus not the population of RTE. Nevertheless, to exclude that the reduced TREC concentrations in peripheral blood lymphocytes from several UC patients, as well as CD patients, were caused by an increased peripheral T cell turnover we determined the frequencies of proliferating T lymphocytes, detected as Ki67+CD3+ T lymphocytes, and found the prevalence to be equivalent in IBD patients and healthy individuals. Supporting the notion that the reduced TREC levels in peripheral blood T cells in several IBD patients are not caused by extensive proliferation was also the finding of comparable frequencies of CD45RA+ as well as CD62L+ T lymphocytes in peripheral blood from IBD patients and healthy individuals. Thus, a likely explanation to the reduced TREC levels in peripheral blood from IBD patients could be enhanced migration of RTE from the blood to the inflamed mucosa, purging the peripheral blood of this population. The purpose of separating the integrin β7+ lymphocytes in peripheral blood was to analyse if there was a direct recruitment of gut homing T cells from the thymus. The fact that the integrin β7+ population did not differ from unseparated lymphocytes regarding TREC content indicate that the majority of peripheral blood lymphocytes have divided, irrespective of integrin of β7+ expression. Although the frequency of proliferating T lymphocytes was not estimated in the intestinal mucosa, the proliferation rate in UC patients would be increased rather than decreased compared to controls, due to the chronic inflammation. Thus, if anything, we are underestimating the amount of TRECs in mucosal lymphocytes of IBD patients by not expressing it relative to the proliferation rate of the T lymphocytes. Splitting the patient group into those with active disease versus those with inactive disease demonstrated that this recruitment was not limited to the actively inflamed mucosa, indicating a constant influx of RTE to the intestinal mucosa in UC patients also during remission. It would be very interesting to investigate the role of these RTE for the disease course, e.g. by prospectively analysing TREC levels in a larger cohort, to investigate whether higher TREC levels are associated with a more aggressive disease course, in line with the ongoing substratification of UC and especially CD.
The increased TREC levels in the intestinal mucosa could, theoretically, represent T lymphocytes that have matured in situ in the intestinal mucosa, as the intestinal mucosa can act as a site for extrathymic maturation of both IEL and LPL T lymphocytes in human infants [17], and developing T cells that are rearranging their TCR genes are found in the small intestine in human adults [18]. In addition, immunocompromized mice, i.e. major histocompatibility complex (MHC) class I-deficient and TCR-αβ-deficient mice, of which the latter spontaneously develop colitis [5,29], also have evidence of extrathymic maturation. Thus, it is possible that T cell progenitors in the bone marrow receive signals from the inflamed intestine to go directly to the intestinal mucosa for further maturation. However, we employed flow cytometric analysis using previously established phenotypic characteristics of T cell progenitors in the gut, identified as CD19-CD16-CD3-CD2+CD5+CD7+ lymphocytes [17,18][30], and found no differences in frequencies of this population between IBD patients and non-inflamed controls. As only the LPL population was investigated, due to limited amounts of IEL, it could be argued that extrathymic maturation could be increased, specifically in the IEL compartment. However, as quantitative RT–PCR analysis of pre-TCR-α and RAG1 mRNA expression [18,30,31] was performed in mucosal biopsies containing both IEL and LPL, and revealed no increased expression in IBD patients compared to controls, this is highly unlikely.
Corroborating our findings of significantly increased frequencies of mucosal T cells expressing CD62L/L-selectin in UC but not CD patients is a report that HEV-like vessels expressing PNAd, one of the ligands for CD62L, were induced preferentially in active UC [32]. In addition, serum concentrations of soluble L-selectin have been shown to be correlated positively to disease activity in UC but not CD [33]. In mice, CD62L+ expressing CD4+ T cells [34], as well as CD4+CD45RBhi[1,2,35], can induce colitis upon transfer into immunodeficient recipient mice. However, in humans CD62L is expressed by both CD45RA+ and CD45RA- T lymphocytes, of which naive T cells express both, while the CD62L+CD45RA- T lymphocytes have been shown previously to be central memory T cells [36]. Although we did not analyse this population for expression of the chemokine receptor CCR7, this suggests that the increased frequency of CD4+CD62L+CD45RA- lymphocytes found in the intestinal mucosa of UC patients represents CD62L+CD45RA-CCR7+ central memory T lymphocytes, found predominantly in lymphoid tissue [37].
Although the present study investigated a limited number of patients, we demonstrate that UC patients, and not CD patients, display an increased recruitment of RTE to the colonic mucosa, possibly before acquiring immunoregulatory properties in the periphery. The increased levels of TREC+ T cells in the intestinal mucosa in UC patients warrant further investigations. For example, analysis of TREC content in different subpopulations of mucosal lymphocytes would probably shed more light on the immunopathogenesis of IBD. The current method chosen for TREC analysis is limited to show whether the TREC levels are increased or decreased in IBD patients, and do not show the actual frequency of TREC-positive T cells in the population.
Recently, several mathematical models have been developed to determine thymic output, with equations that consider parameters that influence directly the measurement of TRECs (cell death, proliferation, age, etc.). It would thus be of great interest to apply mathematical modelling for analysis of RTE in patients with IBD and also other inflammatory conditions in comparison to uninflamed controls. Such studies are currently under way in our research group using the Gαi2-deficient mouse model of colitis.
Acknowledgments
This study was supported by grants from the Swedish Research Council Medicine and Health, the Swedish Cancer Society, Nanna Svartz Foundation, the Health and Medical Care Committee of Regional Executive Board Region Västra Götaland (LUA-ALF) and the Bengt Ihre's foundation. The authors thank Dr Solveig Oskarsdottir, Department of Pediatrics, Institute of Clinical Sciences, Sahlgrenska University Hospital, Göteborg, for providing thymic tissue samples from human infants.
Disclosure
The authors declare no conflicts of interest.
References
- 1.Morrissey PJ, Charrier K, Braddy S, Liggitt D, Watson JD. CD4+ T cells that express high levels of CD45RB induce wasting disease when transferred into congenic severe combined immunodeficient mice. Disease development is prevented by cotransfer of purified CD4+ T cells. J Exp Med. 1993;178:237–44. doi: 10.1084/jem.178.1.237. [DOI] [PMC free article] [PubMed] [Google Scholar]
- 2.Powrie F, Leach MW, Mauze S, Menon S, Caddle LB, Coffman RL. Inhibition of Th1 responses prevents inflammatory bowel disease in scid mice reconstituted with CD45RBhi CD4+ T cells. Immunity. 1994;1:553–62. doi: 10.1016/1074-7613(94)90045-0. [DOI] [PubMed] [Google Scholar]
- 3.Hollander GA, Simpson SJ, Mizoguchi E, et al. Severe colitis in mice with aberrant thymic selection. Immunity. 1995;3:27–38. doi: 10.1016/1074-7613(95)90156-6. [DOI] [PubMed] [Google Scholar]
- 4.Ludviksson BR, Gray B, Strober W, Ehrhardt RO. Dysregulated intrathymic development in the IL-2-deficient mouse leads to colitis-inducing thymocytes. J Immunol. 1997;158:104–11. [PubMed] [Google Scholar]
- 5.Mombaerts P, Mizoguchi E, Grusby MJ, Glimcher LH, Bhan AK, Tonegawa S. Spontaneous development of inflammatory bowel disease in T cell receptor mutant mice. Cell. 1993;75:274–82. doi: 10.1016/0092-8674(93)80069-q. [DOI] [PubMed] [Google Scholar]
- 6.James SP. Remission of Crohn's disease after human immunodeficiency virus infection. Gastroenterology. 1988;95:1667–9. doi: 10.1016/s0016-5085(88)80094-5. [DOI] [PubMed] [Google Scholar]
- 7.Tsuchiya M, Hibi T, Watanabe M, et al. Thymectomy in ulcerative colitis: a report of cases over a 13 year period. Thymus. 1991;17:67–73. [PubMed] [Google Scholar]
- 8.Okubo K, Kondo N, Okamoto T, Isobe J, Ueno Y. Excision of an invasive thymoma: a cure for ulcerative colitis? Ann Thorac Surg. 2001;71:2013–15. doi: 10.1016/s0003-4975(00)02501-7. [DOI] [PubMed] [Google Scholar]
- 9.Fritsch Fredin M, Elgbratt K, Svensson D, Jansson L, Melgar S, Hultgren Hornquist E. Dextran sulfate sodium-induced colitis generates a transient thymic involution – impact on thymocyte subsets. Scand J Immunol. 2007;65:421–9. doi: 10.1111/j.1365-3083.2007.01923.x. [DOI] [PubMed] [Google Scholar]
- 10.Elgbratt K, Bjursten M, Willen R, Bland PW, Hornquist EH. Aberrant T-cell ontogeny and defective thymocyte and colonic T-cell chemotactic migration in colitis-prone Galphai2-deficient mice. Immunology. 2007;122:199–209. doi: 10.1111/j.1365-2567.2007.02629.x. [DOI] [PMC free article] [PubMed] [Google Scholar]
- 11.Geenen V, Poulin JF, Dion ML, et al. Quantification of T cell receptor rearrangement excision circles to estimate thymic function: an important new tool for endocrine-immune physiology. J Endocrinol. 2003;176:305–11. doi: 10.1677/joe.0.1760305. [DOI] [PubMed] [Google Scholar]
- 12.Hazenberg MD, Verschuren MC, Hamann D, Miedema F, van Dongen JJ. T cell receptor excision circles as markers for recent thymic emigrants: basic aspects, technical approach, and guidelines for interpretation. J Mol Med. 2001;79:631–40. doi: 10.1007/s001090100271. [DOI] [PubMed] [Google Scholar]
- 13.Hazenberg MD, Otto SA, Cohen Stuart JW, et al. Increased cell division but not thymic dysfunction rapidly affects the T-cell receptor excision circle content of the naive T cell population in HIV-1 infection. Nat Med. 2000;6:1036–42. doi: 10.1038/79549. [DOI] [PubMed] [Google Scholar]
- 14.Hochberg EP, Chillemi AC, Wu CJ, et al. Quantitation of T-cell neogenesis in vivo after allogeneic bone marrow transplantation in adults. Blood. 2001;98:1116–21. doi: 10.1182/blood.v98.4.1116. [DOI] [PubMed] [Google Scholar]
- 15.Schreiber S, MacDermott RP, Raedler A, Pinnau R, Bertovich MJ, Nash GS. Increased activation of isolated intestinal lamina propria mononuclear cells in inflammatory bowel disease. Gastroenterology. 1991;101:1020–30. doi: 10.1016/0016-5085(91)90729-5. [DOI] [PubMed] [Google Scholar]
- 16.Voiglio E, Salle B, Lemaitre D, Cloix P, Bancel B, Cozon G. [Activation of T-lymphocytes in Crohn disease and in ulcerative hemorrhagic rectocolitis. Therapeutic implications] Pathol Biol (Paris) 1996;44:287–92. [PubMed] [Google Scholar]
- 17.Williams AM, Bland PW, Phillips AC, et al. Intestinal alpha beta T cells differentiate and rearrange antigen receptor genes in situ in the human infant. J Immunol. 2004;173:7190–9. doi: 10.4049/jimmunol.173.12.7190. [DOI] [PubMed] [Google Scholar]
- 18.Bas A, Hammarstrom SG, Hammarstrom ML. Extrathymic TCR gene rearrangement in human small intestine: identification of new splice forms of recombination activating gene-1 mRNA with selective tissue expression. J Immunol. 2003;171:3359–71. doi: 10.4049/jimmunol.171.7.3359. [DOI] [PubMed] [Google Scholar]
- 19.Kong F, Chen CH, Cooper MD. Thymic function can be accurately monitored by the level of recent T cell emigrants in the circulation. Immunity. 1998;8:97–104. doi: 10.1016/s1074-7613(00)80462-8. [DOI] [PubMed] [Google Scholar]
- 20.Kong FK, Chen CL, Six A, Hockett RD, Cooper MD. T cell receptor gene deletion circles identify recent thymic emigrants in the peripheral T cell pool. Proc Natl Acad Sci USA. 1999;96:1536–40. doi: 10.1073/pnas.96.4.1536. [DOI] [PMC free article] [PubMed] [Google Scholar]
- 21.Hosseinzadeh H, Goldschneider I. Recent thymic emigrants in the rat express a unique antigenic phenotype and undergo post-thymic maturation in peripheral lymphoid tissues. J Immunol. 1993;150:1670–9. [PubMed] [Google Scholar]
- 22.Kimmig S, Przybylski GK, Schmidt CA, et al. Two subsets of naive T helper cells with distinct T cell receptor excision circle content in human adult peripheral blood. J Exp Med. 2002;195:789–94. doi: 10.1084/jem.20011756. [DOI] [PMC free article] [PubMed] [Google Scholar]
- 23.Kilpatrick RD, Rickabaugh T, Hultin LE, et al. Homeostasis of the naive CD4+ T cell compartment during aging. J Immunol. 2008;180:1499–507. doi: 10.4049/jimmunol.180.3.1499. [DOI] [PMC free article] [PubMed] [Google Scholar]
- 24.Junge S, Kloeckener-Gruissem B, Zufferey R, et al. Correlation between recent thymic emigrants and CD31+ (PECAM-1) CD4+ T cells in normal individuals during aging and in lymphopenic children. Eur J Immunol. 2007;37:3270–80. doi: 10.1002/eji.200636976. [DOI] [PubMed] [Google Scholar]
- 25.Hug A, Korporal M, Schroder I, et al. Thymic export function and T cell homeostasis in patients with relapsing remitting multiple sclerosis. J Immunol. 2003;171:432–7. doi: 10.4049/jimmunol.171.1.432. [DOI] [PubMed] [Google Scholar]
- 26.Koetz K, Bryl E, Spickschen K, O'Fallon WM, Goronzy JJ, Weyand CM. T cell homeostasis in patients with rheumatoid arthritis. Proc Natl Acad Sci USA. 2000;97:9203–8. doi: 10.1073/pnas.97.16.9203. [DOI] [PMC free article] [PubMed] [Google Scholar]
- 27.Ponchel F, Morgan AW, Bingham SJ, et al. Dysregulated lymphocyte proliferation and differentiation in patients with rheumatoid arthritis. Blood. 2002;100:4550–6. doi: 10.1182/blood-2002-03-0671. [DOI] [PubMed] [Google Scholar]
- 28.Livak F, Schatz DG. T-cell receptor alpha locus V(D)J recombination by-products are abundant in thymocytes and mature T cells. Mol Cell Biol. 1996;16:609–18. doi: 10.1128/mcb.16.2.609. [DOI] [PMC free article] [PubMed] [Google Scholar]
- 29.Tsukada C, Miyaji C, Kawamura H, et al. Characterization of extrathymic CD8 alpha beta T cells in the liver and intestine in TAP-1 deficient mice. Immunology. 2003;109:343–50. doi: 10.1046/j.1365-2567.2003.01654.x. [DOI] [PMC free article] [PubMed] [Google Scholar]
- 30.Howie D, Spencer J, DeLord D, et al. Extrathymic T cell differentiation in the human intestine early in life. J Immunol. 1998;161:5862–72. [PubMed] [Google Scholar]
- 31.Lynch S, Kelleher D, McManus R, O'Farrelly C. RAG1 and RAG2 expression in human intestinal epithelium: evidence of extrathymic T cell differentiation. Eur J Immunol. 1995;25:1143–7. doi: 10.1002/eji.1830250502. [DOI] [PubMed] [Google Scholar]
- 32.Suzawa K, Kobayashi M, Sakai Y, et al. Preferential induction of peripheral lymph node addressin on high endothelial venule-like vessels in the active phase of ulcerative colitis. Am J Gastroenterol. 2007;102:1499–509. doi: 10.1111/j.1572-0241.2007.01189.x. [DOI] [PubMed] [Google Scholar]
- 33.Seidelin JB, Vainer B, Horn T, Nielsen OH. Circulating L-selectin levels and endothelial CD34 expression in inflammatory bowel disease. Am J Gastroenterol. 1998;93:1854–9. doi: 10.1111/j.1572-0241.1998.538_f.x. [DOI] [PubMed] [Google Scholar]
- 34.Deguchi Y, Andoh A, Yagi Y, et al. The S1P receptor modulator FTY720 prevents the development of experimental colitis in mice. Oncol Rep. 2006;16:699–703. [PubMed] [Google Scholar]
- 35.Kanai T, Kawamura T, Dohi T, et al. TH1/TH2-mediated colitis induced by adoptive transfer of CD4+CD45RBhigh T lymphocytes into nude mice. Inflamm Bowel Dis. 2006;12:89–99. doi: 10.1097/01.MIB.0000197237.21387.mL. [DOI] [PubMed] [Google Scholar]
- 36.Foster AE, Marangolo M, Sartor MM, et al. Human CD62L- memory T cells are less responsive to alloantigen stimulation than CD62L+ naive T cells: potential for adoptive immunotherapy and allodepletion. Blood. 2004;104:2403–9. doi: 10.1182/blood-2003-12-4431. [DOI] [PubMed] [Google Scholar]
- 37.Lanzavecchia A, Sallusto F. Dynamics of T lymphocyte responses: intermediates, effectors, and memory cells. Science. 2000;290:92–7. doi: 10.1126/science.290.5489.92. [DOI] [PubMed] [Google Scholar]