Abstract
Human colonic epithelial cells express T helper type 1 (Th1)-associated chemoattractants, yet little is known about the production of Th2-associated chemoattractants. CCL11/eotaxin-1, CCL24/eotaxin-2 and CCL26/eotaxin-3 are known to attract CCR3-expressing, Th2-polarized lymphocytes. We studied constitutive and inflammation-induced expression and production of CCR3 together with its ligands in the colon and peripheral blood of patients with inflammatory bowel disease (IBD) by flow cytometry, reverse transcription–polymerase chain reaction (RT–PCR) and enzyme-linked immunosorbent assay (ELISA). We further defined the regulated expression of these chemokines by RT–PCR and ELISA using cultured human epithelial cell lines. A higher fraction of peripheral T lymphocytes were found to be positive for CCR3 in patients with ulcerative colitis (UC) compared to Crohn's disease (CD), while almost no CCR3+ T cells were found in normal controls (NC). Similarly, higher and more frequent expression of CCR3 was observed in colonic biopsies from patients with UC, regardless of the disease activity, when compared to CD or NCs. Serum CCL11/eotaxin-1 was increased significantly in UC (306 ± 87 pg/ml) and less so in CD (257 ± 43 pg/ml), whereas CCL24/eotaxin-2, and CCL26/eotaxin-3 were increased only in UC. Colonic expression of the three chemokines was minimal in NCs but high in inflammatory bowel diseases (especially UC) and was independent of disease activity. Th2, and to a lesser extent Th1, cytokines were able to induce expression and production of all three eotaxins from colonic epithelial cells in culture. CCR3 and ligands over-expression would appear to be a characteristic of UC. The production of CCR3 ligands by human colonic epithelial cells suggests further that epithelium can play a role in modulating pathological T cell-mediated mucosal inflammation.
Keywords: CCR3, chemokines, eotaxins, IBD, Th cells
Introduction
The inflammatory bowel diseases (IBD), namely ulcerative colitis (UC) and Crohn's disease (CD), are chronic inflammatory diseases of the gastrointestinal tract that are believed to arise out of a fundamental dysregulation of the immune system in response to environmental triggers in genetically susceptible individuals [1]. Defects in the ability to properly regulate the immune system in response to enteric microbiota may include alterations in pattern recognition receptors expressed by epithelial cells, diminished barrier integrity and an increased influx of inflammatory cells [2–5].
The enhanced recruitment of leucocytes in mucosal sites requires an intense intercellular communication between infiltrating leucocytes and resident intestinal cells. Intestinal epithelial cells (IEC) seem to play a principle role in the regulation of intestinal inflammation via the constitutive and induced expression of various chemokines, resulting in an interplay between colonic epithelial cells and circulating leucocytes, orchestrated by chemokine–chemokine receptor expression [6,7]. For example, IEC-derived CXCL8/interleukin (IL)-8, CXCL5/epithelial neutrophil-activating peptide 78 (ENA)-78 and CCL2/monocyte chemoattractant protein (MCP)-1 have been found to be up-regulated in the intestinal mucosa of IBD patients resulting in enhanced recruitment of neutrophils, monocytes and immature dendritic cells [8–10].
Activated/effector T cells express a set of chemokine receptors, depending on the stage of their activation and differentiation. Although CXCR3, CCR5, CXCR6 have been suggested as markers of Th1 polarization, and CCR3, CCR4 and CCR8 as markers of Th2 polarization [11,12], there is evidence that CXCR3 and CCR5 receptors are also found in regulatory T CD4+CD25+ cells and in CD8+ cytotoxic T lymphocytes. Their ligands attract regulatory T cells. Currently, inflamed intestinal mucosa has been shown to produce chemokines associated with the recruitment of activated/effector Th1-differentiated T cells. Specifically, CXCR3+ activated T cells have been found in normal and inflamed intestinal mucosa [13] and all CXCR3 ligands such as CXCL10/interferon (IFN)-γ-induced protein 10 (IP)-10, CXCL9/monokine induced by IFN-γ (Mig) and CXCL11/IFN-inducible T cell alpha chemoattractant (I-TAC) have been found to be expressed by IFNγ-stimulated IECs [14]. Furthermore, CCL3/MIP-1α, CCL4/MIP-1β and CCL5/regulated upon activation normal T cell expressed and secreted (RANTES), all of which attract activated T cells through CCR5, are also expressed in inflamed tissue in patients with IBD [15]. However, there is little information concerning the role of other chemokine receptors and their ligands in lymphocyte recruitment in IBD.
The C-C chemokine receptor CCR3 plays a critical role in allergic and other immune-mediated inflammation. It is highly expressed on eosinophils [16], basophils [17], monocyte-derived dendritic cells [18] and a subset of Th2 lymphocytes [19]. CCR3 mediates the potent chemotactic and activating effects of CCL11/eotaxin-1, CCL24/eotaxin-2, CCL26/eotaxin-3, CCL5/RANTES, CCL7/MCP-3 and CCL13/MCP-4. CCR3 plays a critical role in the accumulation of eosinophils as well as T cells during allergic inflammation including asthma and atopic dermatitis [20]. Its potential role in other immune-mediated chronic inflammatory diseases, such as ulcerative colitis has not been explored.
The aim of this study was to compare the expression profile of CCR3 and its ligands in both Th1 (CD) and Th2 (UC)-predominant inflammatory bowel disease and investigate a possible role of cytokine-stimulated intestinal epithelial cells in CCR3-ligand production.
Methods
Materials
Recombinant human (rHu) IL-1a (specificity 5 × 10⁷ U/mg) and TNF-α (specificity 6 × 10⁷ U/mg) were purchased from R&D Systems (Abingdon, UK). rHuIFN-γ (specificity > 2 × 10⁷ U/mg) was purchased from Roche Diagnostics (Lewes, UK). rHuIL-4 (specificity > 5 × 10⁶ U/mg), rHuIL-10 (specificity > 5 × 10⁶ U/mg) and rHuIL-13 (specificity > 1 × 10⁶ U/mg) were purchased from Chemicon International (Temecula, CA, USA). All cell culture reagents and plastics were from Gibco-Invitrogen (Paisley, UK) and Nunc Maxisorp (Hereford, UK), respectively. Oligo(dT) 12–18 primer, Superscript II, RT buffers and deoxyribonucleotide triphosphates (dNTPs) were purchased from Gibco. RNAsin was from Promega (Southampton, UK). PCR buffers, dNTPs and expanded polymerase were purchased from Roche Molecular Biochemicals (Lewes, UK). The magnetic-activated cell sorting (MACS) system and columns were purchased from Miltenyi Biotec (Gladbach, Germany).
Patients
Multiple colonic biopsy specimens were obtained from affected mucosal sites of 22 patients with UC and 20 patients with CD who underwent colonoscopy for clinical purposes at the Gastroenterology Department, University Hospital of Heraklion, Greece. Biopsies were also obtained from 20 control patients (NC) who underwent diagnostic colonoscopy for reasons unrelated to IBD, e.g. abdominal pain, and had a normal examination and histology. Serum and peripheral blood mononuclear cells (PBMCs) were collected from the same patients. Only patients with a confirmed diagnosis of UC or CD according to established criteria [21] were recruited into the study. Disease activity in CD patients was evaluated with the CD activity index score [22]. UC patients were evaluated with the simple clinical colitis activity index [23]. The disease activity was evaluated at the time of the serum and/or biopsy collection. Patients were age-matched with the control group (20 healthy volunteers with a mean age of 38·5 years). The clinical characteristics of the patients are shown in Table 1. Informed consent was obtained from all patients, after the local research ethics committee granted approval for these studies.
Table 1.
Patients' characteristics.
| Ulcerative colitis | Crohn's disease | |
|---|---|---|
| Number (n) | 22 | 20 |
| Gender (male) | 15 | 7 |
| First diagnosis | 6 | 6 |
| Active (mean disease activity) | 16 (7·8) | 16 (243) |
| Mean disease duration (years) | 7 | 7·1 |
| Disease localization | ||
| Left-sided colitis | 16 | |
| Pancolitis | 6 | |
| Colon | 14 | |
| Colon + ileum | 6 | |
| Treatment | ||
| None | 6 | 6 |
| Topical steroids | 10 | 6 |
| Oral steroids | 4 | 8 |
| 5-ASA | 6 | 8 |
| Azathioprine | 6 | 3 |
| Infliximab | 2 | 7 |
5-ASA: 5-aminosalicylic acid.
Isolation of peripheral T lymphocytes
Peripheral blood was diluted immediately 1:1 in Iscove's modified Dulbecco's medium (Gibco), supplemented with 10 IU/ml of heparin (Sigma, St Louis, MO, USA). Diluted peripheral blood was centrifuged on Lymphoprep (Nycomed Pharma, Oslo, Norway) at 400 g for 30 min at room temperature in order to obtain the PBMCs. PBMCs were used to further enrich T lymphocytes based on the expression of CD3 by magnetic separation (MACS-Miltenyi, Gladbach, Germany), according to the manufacturer's protocol. In all experiments, the purity of the isolated cell population was greater than 95% when estimated by flow cytometry.
Flow cytometry
Two-colour flow cytometry was applied for the analysis of lymphocyte subpopulations as described previously [24]. Briefly, 106 isolated cells were incubated with staining reagents [carboxyfluorescein isothiocyanate (FITC)-conjugated monoclonal mouse anti-human CCR3 (clone 61828·111; R&D Systems Inc.) and phycoerythrin (PE)-conjugated mouse anti-human CD3 antibody (Beckman Coulter, Marseille, France)] for 30 min on ice. FITC and PE-conjugated mouse IgG antibodies served as appropriate isotype controls. Analysis was performed using an Epics Elite model flow cytometer (Coulter, Miami, FL, USA).
Cell cultures
The human colonic epithelial carcinoma cell lines HT-29 and Caco-2 were purchased from the European Collection of Animal Cell Cultures. Cells were cultured at 37°C and 5% CO2 as described previously [25]. Growth-arrested cells were treated with the appropriate concentrations of stimuli in medium without serum and incubated as described above. The following stimuli were used in cell cultures: IL-1α (10 ng/ml), TNF-α (50 ng/ml) and IFN-γ (300 U/ml) for Th1-derived cytokines and IL-4 (10 ng/ml), IL-10 (10 ng/ml) and IL-13 (10 ng/ ml) for Th2-derived cytokines. Cells and cell culture supernatants were collected at different time-points. Cell counting and viability were accessed by trypan blue exclusion test at the beginning and the end of each experiment using representative wells and cell viabilities were always greater than 95%.
RT–PCR
Total RNA was extracted from cells and homogenized colonic tissue on ice with a glass homogenizer using 1 ml of RNAzol solution. RNA extraction and multiplex RT–PCR were performed as described previously [26]. Briefly, 100 ng mRNA was denatured in the presence of 5-mM oligo(dT) 12–18 primer. It was then reverse-transcribed in a 10 µl volume with Superscript II (Gibco), 1 µl RT buffer, 1 mM dNTPs, 5 mM DDT and 2·5 U/ml RNAsin (Promega) at 42°C for 60 min. One-ml aliquots of cDNA were PCR-amplified in a 25-µl reaction, containing 1 × PCR buffer and 2 mM MgCl2, 0·2 mM dNTPs, 0·5 mM sense and anti-sense primers for CCR3, CCR8, CCL1, CCL11, CCL24, CCL26, GAPDH and 0·4 U high fidelity expanded polymerase (Roche). PCR products were resolved by electrophoresis on 2% agarose gels and visualized with ethidium bromide staining. An identical parallel PCR reaction was performed on starting material, which had not been reverse-transcribed.
The ratio of the PCR product, measured by densitometry between tested genes and GAPDH internal control at a constant volume of RT product, was used for cross-sample comparison. The oligonucleotide sequence and product size for specific primer pairs used are shown in Table 2.
Table 2.
Primer sequences used for the reverse transcription–polymerase chain reaction studies.
| Gene | Primers | Product size |
|---|---|---|
| CCL1 | Sense: 5′-GGAAGATGTGGACAGCAAGAGC-3′ | 309 |
| Anti-sense: 5′-TGTAGGGCTGGTAGTTTCGG-3′ | ||
| CCR8 | Sense: 5′-AGCTCTCCCTAGGCATTTGT-3′ | 293 |
| Anti-sense: 5′-ATCAGGTTGGTGCTCATTGT-3′ | ||
| CCL11 | Sense: 5′-CCCAACCACCTGCCTGCTTTAACCTG-3′ | 208 |
| Anti-sense: 5′-TGGCTTTGGAGTTGGAGATTTTTGG-3′ | ||
| CCL24 | Sense: 5′-GGAGTGGGTCCAGAGGTACA-3′ | 124 |
| Anti-sense: 5′-TTAGCAGGTGGTTTGGTTGC-3′ | ||
| CCL26 | Sense: 5′-GCCTGATTTGCAGCATCATGATGG-3′ | 320 |
| Anti-sense: 5′-CGGATGACAATTCAGCTGAGTCAC-3′ | ||
| CCR3 | Sense: 5′-TGGCGGTGTTTTTCATTTTC-3′ | 315 |
| Anti-sense: 5′-CCGGCTCTGCTGTGGAT-3′ | ||
| GAPDH | Sense: 5′-CAACGGATTTGGTCGTATTG-3′ | 184 |
| Anti-sense: 5′-GATGACAAGCTTCCCGTTCT-3′ |
GAPDH: glyceraldehyde-3-phosphate-dehydrogenase.
Enzyme-linked immunosorbent assay (ELISA) for chemokines
Extracellular chemokine activity of culture supernatants and serum, obtained from 22 UC, 20 CD patients and 20 NC, was measured using sandwich ELISA, according to the manufacturer's protocol (Duoset ELISA Development System; R&D Systems). Briefly, mouse anti-human CCL11, CCL24 and CCL26 antibodies (2 mg/ml) were used for overnight coating at room temperature. Biotinylated goat anti-human CCL11, CCL24 and CCL26 antibodies were then used for detection. The ELISA was developed by incubation with streptavidin-conjugated horseradish peroxidase followed by the employment of tetramethylbenzidine and H2O2 as the substrate.
Statistical analysis
Reported values represent the mean ± standard error of the mean (s.e.m.) of measurements from at least six independent experiments using cultured epithelial cells. Statistical analysis was performed using spss (version 11; SPSS, Chicago, IL, USA). The Kolmogorov–Smirnov test was used to check the Gaussian distribution of data. Statistical comparisons were performed using the Kruskal–Wallis test with Tukey's post hoc comparisons, as Burtlett's test indicated a significant difference between standard deviations. A resultant P-value of less than 0·05 was considered to be significant.
Results
Expression of CCR3 in peripheral T lymphocytes and colonic tissue
Isolated peripheral T lymphocytes from patients with UC (n = 22) and CD (n = 20) were assessed for expression of the CCR3 chemokine receptor using flow cytometry. Results were compared to 20 NCs. Flow cytometry revealed a small fraction of CD3+ peripheral T lymphocytes to be consistently expressing the CCR3 chemokine receptor in patients with IBD (Fig. 1a,b). Conversely, CD3+CCR3+ cells were hardly detected in the case of NCs (Fig. 1c). Interestingly, peripheral T lymphocytes from UC patients were found to be enriched preferentially in CCR3+ cells (1·10 ± 0·4%) compared to either CD (0·2 ± 0·19%) or NC (0·09 ± 0·07%) (Fig. 1d, UC compared to CD, P = 0·009, NC compared to UC, P = 0·008). We did not detect any differences between patients with active or inactive disease (1·18% for active versus 1·01% CD3+CCR3+ for inactive UC).
Fig. 1.
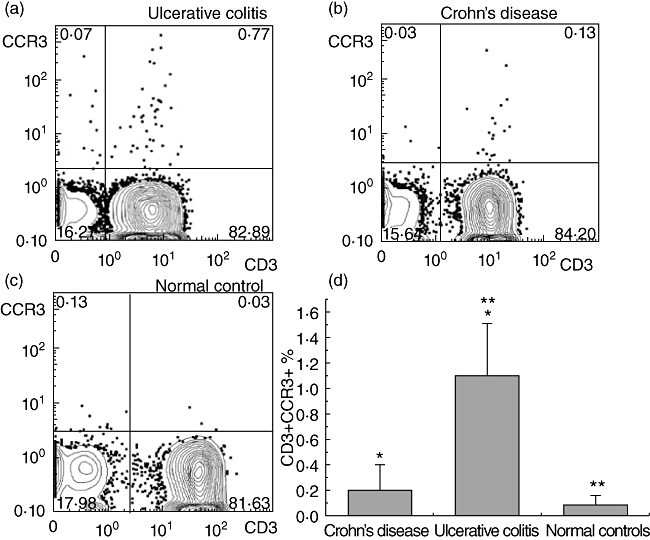
Peripheral T cells from ulcerative colitis (UC) patients are enriched preferentially in CCR3+ cells. The presence of CCR3 was assessed by flow cytometry in peripheral T lymphocytes from ulcerative colitis (UC, n = 20), Crohn's disease (CD, n = 22) and normal controls (NCs, n = 20), isolated from peripheral blood mononuclear cells (PBMCs) via magnetic separation based on CD3 expression. (a–c) Representative fluorescence activated cell sorter (FACS) images (CD3+CCR3+) from patients with UC, CD and NCs. (d) Each column represents the mean value ± standard error of the mean of CD3+ CCR3+ cells of different groups derived from flow cytometry (*P < 0·05 between UC and CD patients and **P < 0·05 between patients with UC and NCs).
Expression of CCR3 mRNA was also assessed by RT–PCR in fresh colonic tissue biopsies obtained endoscopically from 22 patients with UC, 20 patients with CD and 20 NCs. CCR3 mRNA expression was minimal in normal tissue, and we were able to detect some expression of the gene in only 20% (four of 20) of NC (Fig. 2a). However, we found colonic expression of CCR3 mRNA in 86% (19 of 22) of the patients with UC and in a significant proportion 65% (13 of 20) of the patients with CD (Fig. 2a).
Fig. 2.
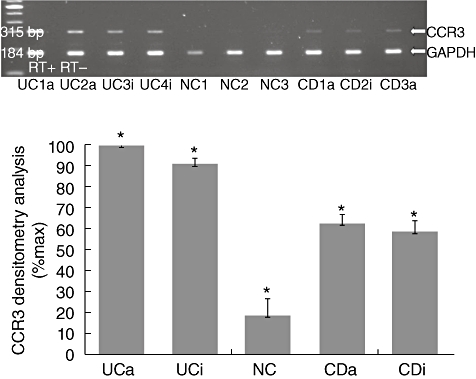
CCR3 is highly expressed in the colon of ulcerative colitis (UC) patients. Total RNA was extracted from colonic biopsies taken from inflammatory bowel disease patients (UC and Crohn's disease (CD)] and normal controls (NCs) and multiplex reverse transcription–polymerase chain reaction (RT–PCR) for CCR3 and glyceraldehyde-3-phosphate-dehydrogenase (GAPDH) was performed. (a) Representative PCR blots of mRNA expression from tissue obtained from Crohn's disease (CD), active (a) and inactive (i) and ulcerative colitis (UC) patients, with active (a) and inactive (i) disease and NCs, probed for CCR3, and GAPDH as internal control. In order to control for genomic contamination each sample has a reverse transcriptase negative control (RT–). The gel shows fluorescence of ethidium bromide-stained PCR products resolved by electrophoresis. (b) Mean densitometry readings for PCR production of receptors are expressed as a percentage of receptor mRNA expression observed in UC patients' samples. Each column represents mean ± standard error of the mean of the different groups. *P < 0·05 between UC and CD, between CD and NCs and between UC and NCs.
Densitometry analysis revealed a statistical significant increase of CCR3 mRNA expression in UC patients compared to CD and NC patients (Fig. 2b, P < 0·003 and P < 0·001, respectively). Interestingly, CCR3 mRNA expression was increased preferentially in UC patients, regardless of the disease activity, the degree of inflammation in colonic mucosa or the medication used by these patients (data not shown). This implies that the differences in colonic expression of CCR3+ observed between UC and CD patients are not generated by differences in the degree of mucosal inflammation.
Collectively, the above findings show that in patients with ulcerative colitis there is a preferential increase of CD3+CCR3+ lymphocytes that might represent circulating activated Th2-differentiated T cells, which is accompanied by a parallel increase of CCR3 chemokine receptor expression in colonic tissue irrespective of the degree of colonic inflammation.
Serum levels and colonic tissue expression of CCR3 ligands
The CCR3 ligands CCL11/eotaxin-1, CCL24/eotaxin-2 and CCL26/eotaxin-3 were assessed in serum from the same patients by ELISA. Increased serum CCL11/eotaxin-1 levels were found in both UC (306 ± 87 pg/ml) and CD (257 ± 43 pg/ml) patients compared to NCs (161 ± 23 pg/ml) (P < 0·05 Fig. 3a). CCL24/eotaxin-2 serum levels were found to be increased significantly only in UC (144 ± 98 pg/ml), whereas in the case of CD (92·6 ± 25 pg/ml) no significant increase was observed from control values (59·7 ± 23 pg/ml) (P < 0·05 and P > 0·05, respectively) (Fig. 3b). CCL26/eotaxin-3 levels were also significantly higher in UC (33·9 ± 12 pg/ml) compared to controls (13·4 ± 3·6 pg/ml) (P = 0·002, Fig. 3c). In a similar manner to CCL24/eotaxin-2, serum levels of CCL26/eotaxin-3 in patients with CD (14·9 ± 7 pg/ml) were not significantly different from control values (P > 0·05, Fig. 3c). Collectively, all CCR3 ligands assessed were found to be increased significantly in the serum of patients suffering from UC when compared to NCs. An increase of circulating CCR3 ligands was observed even for CD patients; however, this increase was not significantly different from the control values.
Fig. 3.
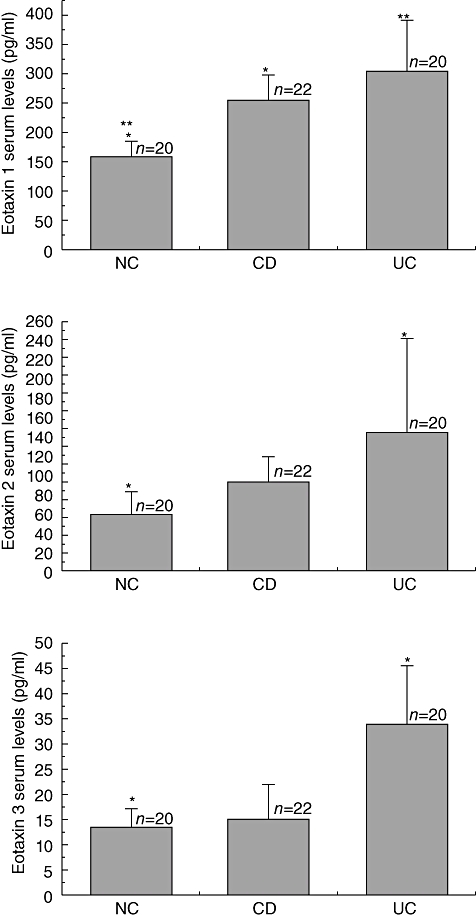
Serum levels of CCL11/eotaxin-1, CCL24/eotaxin-2 and CCL26/eotaxin-3 are increased preferentially in ulcerative colitis (UC) patients. CCR3-binding chemokines were measured by enzyme-linked immunosorbent assay in serum from ulcerative colitis (UC, n = 22), Crohn's disease (CD, n = 20) and normal controls (NCs, n = 20) patients. Each column represents mean ± standard error of the mean (*P < 0·05).
Additionally, samples of colonic tissue obtained from the same patients were used to assess mRNA expression of the selected CCR3 ligands by RT–PCR. A marked mRNA expression of all three CCR3 ligands was detected in inflamed colonic tissue of UC patients showing a parallel increase of the expression of the ligands for the specimens shown previously to over-express the CCR3 receptor. CCL11/eotaxin-1 mRNA expression was present in 82% (18 of 22) of patients with UC, 40% (eight of 20) of patients with CD and only 5% (one of 20) of NC (Fig. 4a, upper panel). CCL24/eotaxin-2 was found to be expressed in 77% (17 of 22) of UC, 60% (1 of 20) of CD and 5% (one of 20) of control patients (Fig. 4a, middle panel). CCL26/eotaxin-3 mRNA expression was detected in 73% (16 of 22) of UC (60%) 12 of 20 of CD and 10% (two of 20) of control patients (Fig. 4a, lower panel). Densitometry analysis revealed a significant increase in the three chemokine mRNA expressions only in UC patients (Fig. 4b).
Fig. 4.
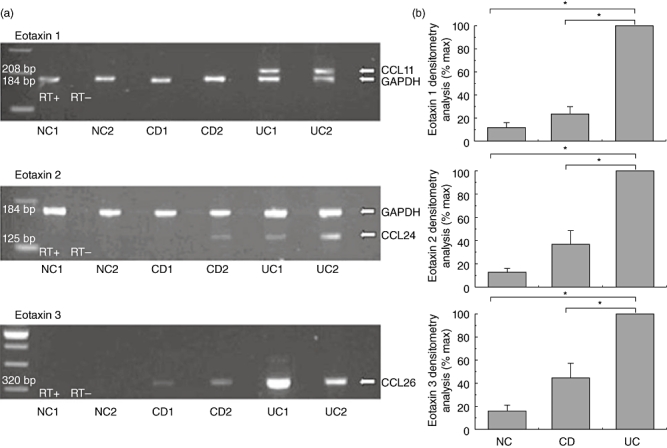
CCR3 binding chemokines are expressed highly in colonic mucosa of ulcerative colitis (UC) patients. Total RNA was extracted from colonic biopsies of ulcerative colitis (UC, n = 20), Crohn's disease (CD, n = 22) and normal control (NC, n = 20) patients and multiplex reverse transcription–polymerase chain reaction (RT–PCR) for chemokines and glyceraldehyde-3-phosphate-dehydrogenase (GAPDH) was performed. (a) Representative PCR blots of mRNA expression from tissue obtained from CD, UC and NC patients, probed for CCL11/eotaxin-1 (upper panel), CCL24/eotaxin-2 (middle panel), CCL26/eotaxin-3 (lower panel) and GAPDH. In order to control for genomic contamination each sample has a reverse transcriptase negative control (RT–). The gel shows fluorescence of ethidium bromide-stained PCR products resolved by electrophoresis. (b) Mean densitometry readings for PCR product of CCL11/eotaxin-1 (upper panel), CCL24/eotaxin-2 (middle panel) and CCL26/eotaxin-3 (lower panel) are expressed as a percentage of chemokine mRNA expression observed in UC patients' samples. Each column represents mean ± standard error of the mean of the different groups. *P < 0·05.
Production of CCR3 ligands by colonic epithelial cells
In order to explore the potential contribution of epithelial cells in the production of CCR3-binding chemokines, we studied the in vitro mRNA expression and production of CCL11/eotaxin-1, CCL24/eotaxin-2 and CCL26/eotaxin-3 by two human colonic cell lines (HT-29 and Caco-2). These cell lines were either left untreated or cultured in the presence of Th1 or Th2-associated cytokines to reproduce in vitro the cytokine microenvironment of CD and UC, respectively.
Initially, in order to identify the incubation time needed for mRNA expression following stimulus, we assessed the induction of expression of CCL11/eotaxin-1, CCL24/eotaxin-2 and CCL26/eotaxin-3 following incubation of HT-29 and Caco-2 cells with individual cytokines for various time-points. Th1 cytokines (IL-1α, TNF-α, IFN-γ) were weak inducers of mRNA expression for eotaxins with a peak expression at 6 h following stimulation (Fig. 5a). Conversely, Th2 cytokines (IL-4, IL-10 and IL-13) were strong inducers of mRNA expression for eotaxins, again with a peak expression at 6 h following stimulation (Fig. 5b). Based upon these results, the 6-h time-point was used to compare the effect of the combination of Th1 or Th2 cytokines on the mRNA expression of Eotaxins.
Fig. 5.
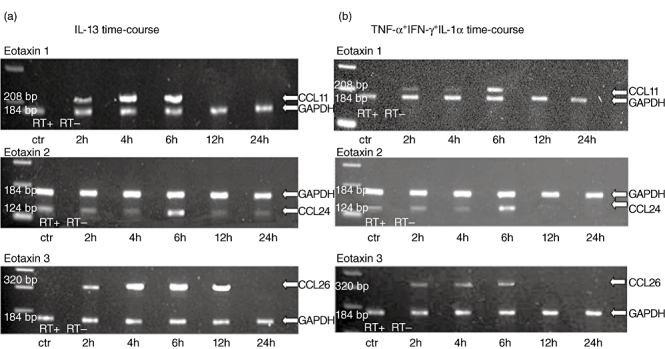
Both T helper type 1 (Th1) and Th2 cytokines are able to induce mRNA expression of CCR3 ligands by colonic epithelial cells. Total RNA was extracted from cultured HT-29 cells incubated for 2–24 h with media or Th1 and Th2 cytokines. Multiplex reverse transcription–polymerase chain reaction (RT–PCR) for CCL11/eotaxin-1 (upper panel), CCL24/eotaxin-2 (middle panel), CCL26/eotaxin-3 (lower panel) and glyceraldehyde-3-phosphate-dehydrogenase (GAPDH) was performed. (a) CCR3 ligand mRNA expression induced by interleukin (IL)-13 (10 ng/ml). (b) CCR3 ligand mRNA expression induced by interferon (IFN)-γ, tumour necrosis factor (TNF)-α and IL-1α. In order to control for genomic contamination each sample has a reverse transcriptase negative control (RT–). The gel shows fluorescence of ethidium bromide-stained PCR products resolved by electrophoresis.
Untreated cells did not express any of the chemokines tested, with the exception of CCL24/eotaxin-2 (Fig. 6a–c). Stimulation with a combination of Th1 cytokines, as explained in the Materials and methods section, revealed a modest induction of mRNA expression of CCL26/eotaxin-3 in both cell lines and a very weak expression of CCL11/eotaxin-1 and CCL24/eotaxin-2 (Fig. 6a–c). Conversely, treatment with a combination of Th2 cytokines induced CCL11/eotaxin-1, CCL24/eotaxin-2 and CCL26/eotaxin-3 mRNA expression considerably in both cell lines (Fig. 6a–c).
Fig. 6.
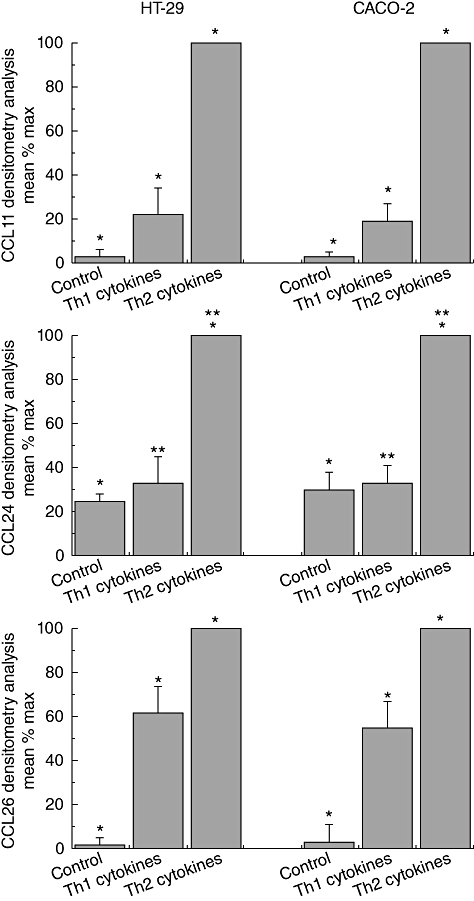
Chemokine expression by HT-29 and Caco-2 cells in response to T helper type 1 (Th1) and Th2-derived cytokines. Chemokine expression was measured in cells from two cell lines after 24 h stimulation with Th1 cytomix of interleukin (IL)-1α (10 ng/ml), tumour necrosis factor (TNF)-α (50 ng/ml) and interferon (IFN)-γ (300 U/ml) or the Th2-derived cytokines IL-4 (10 ng/ml), IL-10 (10 ng/ml) and IL-13 (10 ng/ml). Each column represents mean ± standard error of the mean of six separate experiments. *Significance between all three groups, i.e. NCs with CD, CD with ulcerative colitis (UC) and NCs with UC. **In CCL24, there is a significance difference between NCs and UC as well as CD and UC, but not between CD and UC.
Furthermore, CCL11/eotaxin-1, CCL24/eotaxin-2 and CCL26/eotaxin-3 protein production was assessed in cell culture supernatants following stimulation for 24 h with media alone or a combination of either Th1 or Th2 cytokines added to the culture media. The 24 h appeared to be the best time-point for chemokine production, as the 6-h time-point when the peak mRNA expression for chemokines appeared is generally considered too early for protein production; this was confirmed in our study as well, as we observed only minimal chemokine production 6 h after stimulation. No production of CCL11/eotaxin-1 was observed by non-stimulated, growth-arrested HT-29 and Caco-2 cells (Fig. 7a).
Fig. 7.
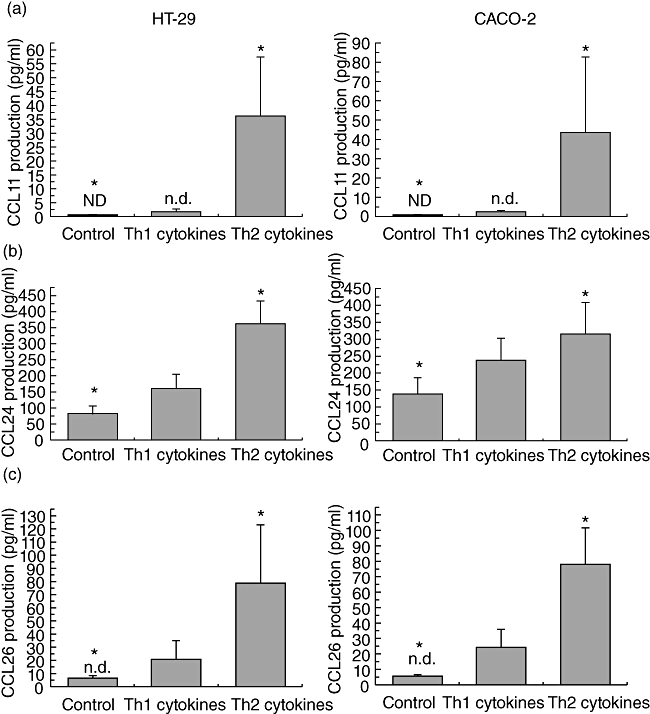
Th2 cytokines induce production of CCR3 ligands preferentially by colonic epithelial cells. Chemokine production was measured in supernatants from HT-29 and Caco-2 cell lines after 24 h stimulation with a combination of T helper type 1 (Th1) [10 ng/ml of interleukin (IL)-1α, 50 ng/ml of tumour necrosis factor (TNF)-α and 300 U/ml of interferon (IFN)-γ] or Th2 (10 ng/ml of IL-4, 10 ng/ml of IL-10 and 10 ng/ml of IL-13) cytokines. (a) CCL11/eotaxin-1 production by HT-29 (left panel) and Caco-2 (right panel) cell lines; ND, not detected; (b) CCL24/eotaxin-2 production by HT-29 (left panel) and Caco-2 (right panel) cell lines; (c) CCL26/eotaxin-3 production by HT-29 (left panel) and Caco-2 (right panel) cell lines. Each column represents mean ± standard error of the mean of nine separate experiments. *P < 0·05 between normal controls and Th2 cytokines.
A minimal increase in CCL11/eotaxin-1 production was observed when both cell lines were stimulated with Th1 (P < 0·05), while Th2 cytokines were very effective in inducing CCL11/eotaxin-1 production (P < 0·001, Fig. 7a). Incubation with Th1 cytokines induced a significant increase in CCL24/eotaxin-2 production (P < 0·01, Fig. 7b). Incubation with Th2 cytokines further increased CCL24/eotaxin-2 production compared to either control or Th1 values (P < 0·001, respectively, Fig. 7b). For the CCL26/eotaxin-3 in media-stimulated HT-29 and Caco-2 cells, most of the observed values were below the ELISA detection limit. A non-significant induction followed Th1 stimulation, but only Th2 cytokines were able to induce substantial CL26/eotaxin-3 production (P < 0·001, Fig. 7c). When stimulated with Th1 (TNF-α, IL-1α or IFN-γ) or Th2 (IL-4, IL-10 or IL-13) cytokines alone, there was no production of any eotaxin. The combination of IL-4 with IFN-γ induced CCL24/eotaxin-2 (130 pg/ml in HT-29 cells and 145 pg/ml in CACO2 cells) and CCL26/eotaxin-3 (72 pg/ml in HT-29 cells and 50 pg/ml in CACO-2 cells), but to a lesser extent than the combination of Th2 cytokines (data not shown). Thus, stimulation of HT-29 and CACO-2 cells by single cytokines, IL-4 (10 ng/ml), IL-13 (10 ng/ml), IL-10 (10 ng/ml), IL-1α (10 ng/ml), TNF-α (50 ng/ml), IFN-γ (300 U/ml) or even a combination of IL-1α/TNF-α/IFN-γ, IL-4/IL-13, IL-4/IL-10/IL-13 and IL-4/IFN-γ at the above-mentioned doses, revealed that the Th2 (IL-4/IL-13/IL-10) combination showed the highest eotaxin responses. In the same way, the Th1 combination was more effective than any single Th1 cytokine.
Discussion
Cytokines are key signals in the colonic immune system, contributing to the disruption of the so-called normal state of controlled inflammation [27]. They are produced mainly by immune cells and they play a key role in communication between cells mediating local and systemic inflammation [5]. Cytokines which are considered to be either pro- or anti-inflammatory [28] play a complex role in IBD both by orchestrating cellular interactions and by determining the nature of the immune response in different types of IBD: CD is considered to be a Th1-mediated disease while UC is characterized by Th2 cytokine production [29–32]. This concept has been disputed recently [33,34]. Chemokines and their receptors are involved in Th1 and Th2 immune responses.
In the present study we examined the expression of CCR3 and its ligands in the mucosa and circulating T lymphocytes of IBD patients. We also studied the expression and production of eotaxins in cultured bowel epithelial cells under the influence of either Th1 or Th2 cytokines.
We demonstrated a significant increase of circulating CCR3+ lymphocytes in UC patients compared to NCs. It was notable that CCR3 mRNA expression in colonic tissue followed the same pattern as CCR3 circulating levels. There was a marked CCR3 mRNA expression in 86% of UC and 65% of CD patients compared to 20% of NCs examined.
In accordance with our results, other groups showed massive infiltration of CD3+CCR3+ cells and high levels of eotaxin in colonic mucosa obtained from UC patients [35][36]. Berrebi et al. also described CCR3+-expressing cells that resembled lymphocytes morphologically in the rectal mucosa of 16 children with UC [37]. Our results are also consistent with another study that reported CCR3expression in 15% of CD3+ lymphocytes in UC patients [35], but our values are much lower. However, Yo et al., when comparing UC, CD patients and NCs by flow cytometry screening, found that CCR3+ cells comprised fewer than 1% of CD4+ cells in each group [38], very much in line with our results.
We also demonstrated clearly an increased production of CCR3-binding chemokines, eotaxin-1, eotaxin-2 and eotaxin-3 in serum obtained from UC patients, as well as an increase of eotaxin-1 in CD patients, while the other two CCR3 ligands were also increased without achieving significance. Notably, an increase in eotaxin mRNA expression was found in colonic biopsies of UC and to a lesser degree of CD patients, indicating a potential source of the increased circulating eotaxins in the serum of these patients. Increased serum eotaxin levels have also been demonstrated by other groups. Garcia-Zepeda et al. reported increased eotaxin mRNA expression in intestinal lesions of IBD patients [39]. Chen et al. demonstrated increased serum eotaxin levels by ELISA in both CD and UC patients. However, in contrast to our results they found no significant difference in eotaxin-2 levels and they reported a difference between active and inactive UC [40]. Mir et al., on the other hand, reported increased serum eotaxin levels in IBD patients, but no correlation with disease activity or treatment [41], a finding similar to ours. We also agree with their hypothesis that these results probably indicate an immunological abnormality present even in quiescent disease.
Because inflammation during active UC is confined mainly to intestinal/colonic mucosa layers, and T cell subset recruitment appears to be based in part upon the selective expression of chemokines at specific tissue locations, we tried to characterize further the cell type that could be partly responsible for the production of these chemokines.
HT-29 and Caco-2 cells were studied in cultures because colonic epithelial cells have been found to be a major source of chemokine production [42,43]. In our study, we stimulated HT-29 and Caco-2 cells with Th2-derived cytokines IL-4, IL-10 and IL-13 as well as with Th1, TNF-α, IL-1α and IFN-γ in combination. Notably, we demonstrated that cytokines regulate the expression of CCR-3 binding chemokines differentially in vitro in colonic epithelial cell lines. Th2-type cytokines IL-4, IL-10 or IL-13 stimulated preferentially the expression and production of CCR3-specific ligands such as eotaxin-1, eotaxin-2 and eotaxin-3. As far as we are aware, this is the first report of eotaxin expression in colonic epithelial cell lines. These results, in combination with our ex vivo experiments, support the hypothesis of a Th2 polarization in UC.
However, Th1 type cytokines also showed an increase of eotaxin protein and mRNA levels. This modest increase contrasts with the significant increase of CXCR3-binding chemokines that we have reported previously [44], following the same stimulation as employed in this series of experiments. This indicates that UC is not a pure Th2 disease. This increase of CCR3-binding chemokines is also consistent with the findings of Ruth et al. [45], who reported that eotaxin depletion abrogated not only type 2 but also type 1 inflammation.
Our findings suggest that the epithelial overproduction of CCR3 ligands may result in a migration of CD3+CCR3+ circulating cells to lamina propria in analogy with our previous suggestion on CXCR3 ligand production by epithelial cells [44]. We have reported previously that Th1 cytokines, which are overproduced in CD, stimulate CXCR3-binding chemokine expression in colonic epithelial cells, that this induction causes migration of CXCR3+ lymphocytes and that it is inhibited by Th2-derived cytokines [44]. We believe strongly, therefore, that in addition to cytokine-based therapies the inhibition of lymphocyte trafficking and lymphocyte–epithelial cell interaction should receive a great deal of attention in the future as a potential novel approach for IBD treatment.
Disclosure
Authors declare that there are no financial or other relationships that might lead to conflicts of interest.
References
- 1.Podolsky DK. Inflammatory bowel disease. N Engl J Med. 2002;347:417–29. doi: 10.1056/NEJMra020831. [DOI] [PubMed] [Google Scholar]
- 2.Rakoff-Nahoum S, Medzhitov R. Role of the innate immune system and host-commensal mutualism. Curr Top Microbiol Immunol. 2006;308:1–18. doi: 10.1007/3-540-30657-9_1. [DOI] [PubMed] [Google Scholar]
- 3.Hollander D, Vadheim CM, Brettholz E, Petersen GM, Delahunty T, Rotter JI. Increased intestinal permeability in patients with Crohn's disease and their relatives. A possible etiologic factor. Ann Intern Med. 1986;105:883–5. doi: 10.7326/0003-4819-105-6-883. [DOI] [PubMed] [Google Scholar]
- 4.Gitter AH, Wullstein F, Fromm M, Schulzke JD. Epithelial barrier defects in ulcerative colitis: characterization and quantification by electrophysiological imaging. Gastroenterology. 2001;121:1320–8. doi: 10.1053/gast.2001.29694. [DOI] [PubMed] [Google Scholar]
- 5.Neuman MG. Immune dysfunction in inflammatory. Bowel Disease Transl Res. 2007;149:173–86. doi: 10.1016/j.trsl.2006.11.009. [DOI] [PubMed] [Google Scholar]
- 6.Kolios G, Rooney N, Murphy CT, Robertson DA, Westwick J. Expression of inducible nitric oxide synthase activity in human colon epithelial cells: modulation by T lymphocyte derived cytokines. Gut. 1998;43:56–63. doi: 10.1136/gut.43.1.56. [DOI] [PMC free article] [PubMed] [Google Scholar]
- 7.Mudter J, Neurath MF. Mucosal T cells: mediators or guardians of inflammatory bowel disease? Curr Opin Gastroenterol. 2003;19:343–9. doi: 10.1097/00001574-200307000-00004. [DOI] [PubMed] [Google Scholar]
- 8.Daig R, Andus T, Aschenbrenner E, Falk W, Scholmerich J, Gross V. Increased interleukin 8 expression in the colon mucosa of patients with inflammatory bowel disease. Gut. 1996;38:216–22. doi: 10.1136/gut.38.2.216. [DOI] [PMC free article] [PubMed] [Google Scholar]
- 9.Z’Graggen K, Walz A, Mazzucchelli L, Strieter RM, Mueller C. The C-X-C chemokine ENA-78 is preferentially expressed in intestinal epithelium in inflammatory bowel disease. Gastroenterology. 1997;113:808–16. doi: 10.1016/s0016-5085(97)70175-6. [DOI] [PubMed] [Google Scholar]
- 10.Reinecker HC, Loh EY, Ringler DJ, Mehta A, Rombeau JL, MacDermott RP. Monocyte-chemoattractant protein 1 gene expression in intestinal epithelial cells and inflammatory bowel disease mucosa. Gastroenterology. 1995;108:40–50. doi: 10.1016/0016-5085(95)90006-3. [DOI] [PubMed] [Google Scholar]
- 11.Sallusto F, Lenig D, Mackay CR, Lanzavecchia A. Flexible programs of chemokine receptor expression on human polarized T helper 1 and 2 lymphocytes. J Exp Med. 1998;187:875–83. doi: 10.1084/jem.187.6.875. [DOI] [PMC free article] [PubMed] [Google Scholar]
- 12.Zingoni A, Soto H, Hedrick JA, et al. The chemokine receptor CCR8 is preferentially expressed in Th2 but not Th1 cells. J Immunol. 1998;161:547–51. [PubMed] [Google Scholar]
- 13.Agace WW, Roberts AI, Wu L, Greineder C, Ebert EC, Parker CM. Human intestinal lamina propria and intraepithelial lymphocytes express receptors specific for chemokines induced by inflammation. Eur J Immunol. 2000;30:819–26. doi: 10.1002/1521-4141(200003)30:3<819::AID-IMMU819>3.0.CO;2-Y. [DOI] [PubMed] [Google Scholar]
- 14.Dwinell MB, Lugering N, Eckmann L, Kagnoff MF. Regulated production of interferon-inducible T-cell chemoattractants by human intestinal epithelial cells. Gastroenterology. 2001;120:49–59. doi: 10.1053/gast.2001.20914. [DOI] [PubMed] [Google Scholar]
- 15.Grimm MC, Elsbury SK, Pavli P, Doe WF. Enhanced expression and production of monocyte chemoattractant protein-1 in inflammatory bowel disease mucosa. J Leukoc Biol. 1996;59:804–12. doi: 10.1002/jlb.59.6.804. [DOI] [PubMed] [Google Scholar]
- 16.Combadiere C, Ahuja SK, Murphy PM. Cloning and functional expression of a human eosinophil CC chemokine receptor. J Biol Chem. 1995;270:16491–4. doi: 10.1074/jbc.270.28.16491. [DOI] [PubMed] [Google Scholar]
- 17.Uguccioni M, Mackay CR, Ochensberger B, et al. High expression of the chemokine receptor CCR3 in human blood basophils. Role in activation by eotaxin, MCP-4, and other chemokines. J Clin Invest. 1997;100:1137–43. doi: 10.1172/JCI119624. [DOI] [PMC free article] [PubMed] [Google Scholar]
- 18.Rubbert A, Combadiere C, Ostrowski M, et al. Dendritic cells express multiple chemokine receptors used as coreceptors for HIV entry. J Immunol. 1998;160:3933–41. [PubMed] [Google Scholar]
- 19.Sallusto F, Mackay CR, Lanzavecchia A. Selective expression of the eotaxin receptor CCR3 by human T helper 2 cells. Science. 1997;277:2005–7. doi: 10.1126/science.277.5334.2005. [DOI] [PubMed] [Google Scholar]
- 20.Erin EM, Williams TJ, Barnes PJ, Hansel TT. Eotaxin receptor (CCR3) antagonism in asthma and allergic disease. Curr Drug Targets Inflamm Allergy. 2002;1:201–14. doi: 10.2174/1568010023344715. [DOI] [PubMed] [Google Scholar]
- 21.Lennard-Jones JE. Classification of inflammatory bowel disease. Scand J Gastroenterol Suppl. 1989;170:2–6. doi: 10.3109/00365528909091339. [DOI] [PubMed] [Google Scholar]
- 22.Best WR, Becktel JM, Singleton JW, Kern F., Jr Development of a Crohn's disease activity index. National Cooperative Crohn's Disease Study. Gastroenterology. 1976;70:439–44. [PubMed] [Google Scholar]
- 23.Walmsley RS, Ayres RC, Pounder RE, Allan RN. A simple clinical colitis activity index. Gut. 1998;43:29–32. doi: 10.1136/gut.43.1.29. [DOI] [PMC free article] [PubMed] [Google Scholar]
- 24.Papadaki HA, Stamatopoulos K, Damianaki A, et al. Activated T-lymphocytes with myelosuppressive properties in patients with chronic idiopathic neutropenia. Br J Haematol. 2005;128:863–76. doi: 10.1111/j.1365-2141.2005.05380.x. [DOI] [PubMed] [Google Scholar]
- 25.Jordan NJ, Kolios G, Abbot SE, et al. Expression of functional cxcr4 chemokine receptors on human colonic epithelial cells. J Clin Invest. 1999;104:1061–9. doi: 10.1172/JCI6685. [DOI] [PMC free article] [PubMed] [Google Scholar]
- 26.Valatas V, Kolios G, Manousou P, et al. Octreotide regulates CC but not CXC LPS-induced chemokine secretion in rat Kupffer cells. Br J Pharmacol. 2004;141:477–87. doi: 10.1038/sj.bjp.0705633. [DOI] [PMC free article] [PubMed] [Google Scholar]
- 27.Jump RL, Levine AD. Mechanisms of natural tolerance in the intestine: implications for inflammatory bowel disease. Inflamm Bowel Dis. 2004;10:462–78. doi: 10.1097/00054725-200407000-00023. [DOI] [PubMed] [Google Scholar]
- 28.Papadakis KA, Targan SR. Role of cytokines in the pathogenesis of inflammatory bowel disease. Annu Rev Med. 2000;51:289–98. doi: 10.1146/annurev.med.51.1.289. [DOI] [PubMed] [Google Scholar]
- 29.Monteleone G, Fina D, Caruso R, Pallone F. New mediators of immunity and inflammation in inflammatory bowel disease. Curr Opin Gastroenterol. 2006;22:361–4. doi: 10.1097/01.mog.0000231808.10773.8e. [DOI] [PubMed] [Google Scholar]
- 30.Ince MN, Elliott DE. Immunologic and molecular mechanisms in inflammatory bowel disease. Surg Clin North Am. 2007;87:681–96. doi: 10.1016/j.suc.2007.03.005. [DOI] [PubMed] [Google Scholar]
- 31.Boirivant M, Fuss IJ, Chu A, Strober W. Oxazolone colitis: a murine model of T helper cell type 2 colitis treatable with antibodies to interleukin 4. J Exp Med. 1998;188:1929–39. doi: 10.1084/jem.188.10.1929. [DOI] [PMC free article] [PubMed] [Google Scholar]
- 32.Parronchi P, Romagnani P, Annunziato F, et al. Type 1 T-helper cell predominance and interleukin-12 expression in the gut of patients with Crohn's disease. Am J Pathol. 1997;150:823–32. [PMC free article] [PubMed] [Google Scholar]
- 33.Kobayashi T, Okamoto S, Hisamatsu T, et al. IL23 differentially regulates the Th1/Th17 balance in ulcerative colitis and Crohn's disease. Gut. 2008;57:1682–9. doi: 10.1136/gut.2007.135053. [DOI] [PubMed] [Google Scholar]
- 34.Abraham C, Cho JH. IL-23 and autoimmunity: new insights into the pathogenesis of inflammatory bowel disease. Annu Rev Med. 2009;60:97–110. doi: 10.1146/annurev.med.60.051407.123757. [DOI] [PubMed] [Google Scholar]
- 35.Shibahara T, Si-Tahar M, Shaw SK, Madara JL. Adhesion molecules expressed on homing lymphocytes in model intestinal epithelia. Gastroenterology. 2000;118:289–98. doi: 10.1016/s0016-5085(00)70211-3. [DOI] [PubMed] [Google Scholar]
- 36.Gerber BO, Zanni MP, Uguccioni M, et al. Functional expression of the eotaxin receptor CCR3 in T lymphocytes co-localizing with eosinophils. Curr Biol. 1997;7:836–43. doi: 10.1016/s0960-9822(06)00371-x. [DOI] [PubMed] [Google Scholar]
- 37.Berrebi D, Languepin J, Ferkdadji L, et al. Cytokines, chemokine receptors, and homing molecule distribution in the rectum and stomach of pediatric patients with ulcerative colitis. J Pediatr Gastroenterol Nutr. 2003;37:300–8. doi: 10.1097/00005176-200309000-00018. [DOI] [PubMed] [Google Scholar]
- 38.Jo Y, Matsumoto T, Yada S, et al. CCR4 is an up-regulated chemokine receptor of peripheral blood memory CD4+ T cells in Crohn's disease. Clin Exp Immunol. 2003;132:332–8. doi: 10.1046/j.1365-2249.2003.02155.x. [DOI] [PMC free article] [PubMed] [Google Scholar]
- 39.Garcia-Zepeda EA, Rothenberg ME, Ownbey RT, Celestin J, Leder P, Luster AD. Human eotaxin is a specific chemoattractant for eosinophil cells and provides a new mechanism to explain tissue eosinophilia. Nat Med. 1996;2:449–56. doi: 10.1038/nm0496-449. [DOI] [PubMed] [Google Scholar]
- 40.Chen W, Paulus B, Shu D, Wilson, Chadwick V. Increased serum levels of eotaxin in patients with inflammatory bowel disease. Scand J Gastroenterol. 2001;36:515–20. doi: 10.1080/003655201750153377. [DOI] [PubMed] [Google Scholar]
- 41.Mir A, Minguez M, Tatay J, et al. Elevated serum eotaxin levels in patients with inflammatory bowel disease. Am J Gastroenterol. 2002;97:1452–7. doi: 10.1111/j.1572-0241.2002.05687.x. [DOI] [PubMed] [Google Scholar]
- 42.Kolios G, Wright KL, Jordan NJ, Leithead JB, Robertson DA, Westwick J. C-X-C and C-C chemokine expression and secretion by the human colonic epithelial cell line, HT-29: differential effect of T lymphocyte-derived cytokines. Eur J Immunol. 1999;29:530–6. doi: 10.1002/(SICI)1521-4141(199902)29:02<530::AID-IMMU530>3.0.CO;2-Y. [DOI] [PubMed] [Google Scholar]
- 43.Kucharzik T, Hudson JT, III, Lugering A, et al. Acute induction of human IL-8 production by intestinal epithelium triggers neutrophil infiltration without mucosal injury. Gut. 2005;54:1565–72. doi: 10.1136/gut.2004.061168. [DOI] [PMC free article] [PubMed] [Google Scholar]
- 44.Manousou P, Kolios G, Drygiannakis I, et al. Expression of a splice variant of CXCR3 in Crohn's disease patients; Indication for a lymphocyte – epithelial cell interaction. J Gastroenterol Hepatol. 2008;23:1823–33. doi: 10.1111/j.1440-1746.2008.05486.x. [DOI] [PubMed] [Google Scholar]
- 45.Ruth JH, Lukacs NW, Warmington KS, et al. Expression and participation of eotaxin during mycobacterial (type 1) and schistosomal (type 2) antigen-elicited granuloma formation. J Immunol. 1998;161:4276–82. [PubMed] [Google Scholar]


