Abstract
Friedreich ataxia (FRDA) is an autosomal recessive neurodegenerative disorder caused by reduced amounts of the mitochondrial protein frataxin. Frataxin levels in research studies are typically measured via Western blot analysis from patient fibroblasts, lymphocytes, or muscle biopsies; none of these is ideal for rapid detection in large scale clinical studies. Recently, a rapid, non-invasive lateral-flow immunoassay was developed to accurately measure picogram levels of frataxin protein and shown to distinguish lymphoblastoid cells from FRDA carriers, patients and controls. We expanded the immunoassay to measure frataxin directly in buccal cells and whole blood from a large cohort of controls, known carriers and patients typical of a clinical trial population. The assay in buccal cells shared a similar degree of variability with previous studies conducted in lymphoblastoid cells (~10% coefficient of variation in controls). Significant differences in frataxin protein quantity were seen between the mean group values of controls, carriers, and patient buccal cells (100, 50.2, and 20.9% of control, respectively) and in protein extracted from whole blood (100, 75.3, and 32.2%, respectively), although there was some overlap between the groups. In addition, frataxin levels were inversely related to GAA repeat length and correlated directly with age of onset. Subjects with one expanded GAA repeat and an identified frataxin point mutation also carried frataxin levels in the disease range. Some patients displaying an FRDA phenotype but carrying only a single identifiable mutation had frataxin levels in the FRDA patient range. One patient from this group has a novel deletion that included exons 2 and 3 of the FXN gene based on multiplex ligation-dependent probe amplification (MLPA) analysis of the FXN gene. The lateral flow immunoassay may be a useful means to non-invasively assess frataxin levels repetitively with minimal discomfort in FRDA patients in specific situations such as clinical trials, and as a complementary diagnostic tool to aid in identification and characterization of atypical patients.
Keywords: Frataxin, Friedreich Ataxia, Biomarker, Diagnostic, Point mutation, Deletion
Introduction
Friedreich ataxia (FRDA) is an autosomal recessive neurodegenerative disorder caused by mutations in the FXN gene, reducing the levels of the mitochondrial protein frataxin [1]. Deficiency of frataxin leads to increased intramitochondrial iron levels, deficiency of iron-sulfur cluster-containing enzymes, and enhanced sensitivity to oxidative stress [2]. Patients usually present during adolescence with progressive limb and gait ataxia, dysarthria, and hypertrophic cardiomyopathy [2]. FRDA has an incidence of approximately 1:40,000–1:50,000 people of Western European descent, making FRDA the most common inherited ataxia [3,4]. Normal alleles contain between 7–38 GAA repeats, while pathologic alleles typically have between 66–1500 repeats [1,5,6]. The length of the shorter GAA repeat correlates with age of onset in patients with FRDA [6–11].
Approximately 97% of FRDA patients are homozygous for a GAA expansion in the first intron of the FXN gene; the remaining patients are compound heterozygotes with an expanded GAA repeat on one allele and a point mutation on the other allele [1,12,13]. Both are associated with decreased levels of frataxin, though this has not been applied to large heterogeneous cohorts. A single patient has been identified with a large deletion of the gene, and another locus has been reported in a single instance [14]. Currently, there is no cure for FRDA, but several potential therapies may increase frataxin protein levels in affected tissues [15–17].
Traditionally, frataxin protein levels could only be determined through Western blot or ELISA analysis from patient-derived cells [18,19]. The potentially time-consuming nature of these assays (particularly Western blots) is not ideal for rapid quantification in a clinical research setting. An electrochemiluminescence assay based on the ELISA principle has been used to quantify frataxin from lymphocytes and fibroblasts, but the procedure is labor-intensive and untested in cell types collected noninvasively, and is limited by a narrow working range across different cell types and tissues [20]. Recently, a lateral-flow immunoassay was developed to measure levels of frataxin protein in FRDA patients and carriers without isolating or purifying mitochondria [21]. Here we expanded the application of the lateral-flow immunoassay to measure frataxin protein levels in buccal cells and whole blood samples from large numbers of control, known FRDA carriers, and FRDA patients.
Methods
This study had the approval of International Review Boards at the Children’s Hospital of Philadelphia and the University of California Los Angeles. All patients provided written informed consent before participating in study procedures.
Patients
Clinical and demographic information (including molecular confirmation of FXN gene mutations) was provided through a longitudinal natural history study on FRDA [22]. Whole blood samples were used from a subset (n=52) of these patients. Cheek swab and whole blood samples were also collected from known carriers and healthy controls. Samples were from individuals at the University of Pennsylvania, the Children’s Hospital of Philadelphia, the UCLA Medical Center, and other patients referred to physicians practicing at these institutions. A series of patients with other disorders also participated. These subjects had other ataxia or movement disorders in which FRDA has been ruled out by clinical and genetic criteria.
Buccal Cell and Whole Blood Sample Preparation
Buccal cells were harvested using MasterAmp Buccal Swab Brushes (Epicentre) by firmly pressing a brush against the inner cheek and swabbed while twirling for 30 seconds on each cheek. Both brushes were then immersed in the same tube containing 500 µL of ice cold extraction buffer (MitoSciences) and twirled gently to dislodge the cells. Samples were then microcentrifuged at 16,100g for 10 min at 4°C, and the supernatant was analyzed. Protein concentration was calculated using the BCA protein assay (Pierce). Whole blood from controls, known carriers, and patients was collected in EDTA tubes and frozen immediately at −80°C until use. Whole blood protein was extracted by mixing 1 volume of whole blood to 3 volumes of ice cold extraction buffer (MitoSciences). Samples were microcentrifuged as above, and supernatant was saved for analysis. Samples were further diluted as necessary for frataxin quantity.
Lateral Flow Immunoassay Protocol
MitoSciences dipstick assays (MSF31) were used to measure frataxin levels in buccal cells and whole blood (see reference 21 for schematic) [21]. Briefly, 10 µg of buccal cell protein in 25 µl of extraction buffer was mixed with 25 µl blocking buffer and added to individual wells on a 96-well plate with gold-conjugated mAb at the bottom of each well. After samples were allowed to equilibrate with the antibodies, dipsticks were inserted into the well and sample was allowed to wick up the membrane, where frataxin was immunocaptured onto designated capture zones on the dipstick. Capture zones on developed dipsticks were quantified with a Hamamatsu immunochromato reader (MS1000 Dipstick reader). A standard curve using a range (1–50 µg) of total protein extracted from buccal cells was run to determine an appropriate concentration of sample to use within the working range of the assay. Raw mABS (milli-Absorbance) results were corrected for protein concentration and normalized to the control goat α-mouse IgG band (internal positive control), and the data were expressed as percentages of the average controls run on the same assay.
MLPA Analysis
Genomic DNA was extracted from peripheral blood using an AutoGenFlex STAR automated DNA extractor (AutoGen, Inc.) or a commercially available kit (Genetra Systems, Inc.) according to manufacturer’s instructions.
Deletion/duplication analysis of the FXN gene was performed by MLPA (multiplex ligation-dependent probe amplification assay) according to manufacturer’s instructions with a commercially available probe mix (P316-B1, Recessive Ataxias, MRC Holland, Amsterdam, the Netherlands). In brief, 200ng of genomic DNA in a final volume of 5µl was heated for 5 min at 98°C. After cooling to room temperature, 1.5µl of the probe mix and 1.5µl SALSA hybridization buffer were added to each sample, followed by heat denaturation (1 min at 95°C) and hybridization (16 h at 60°C). Ligation was performed by adding 32 µl of ligation mix at 54°C for 15min and the reaction was stopped by incubating for 5min at 98°C. PCR amplification was carried out for 35 cycles in a final volume of 40 µl. PCR products were separated by capillary electrophoresis using an ABI 3130Xl (Applied Biosystems). An internal size standard LIZ 600 was used (Applied Biosystems). Two female controls were processed along with patient samples. Data analysis was performed using GeneMarker v 1.6 (SoftGenetics, USA). Threshold values were set at 0.75–1.3 for normals, 0.4–.65 for deletions and 1.4–1.6 for duplications. For normalization two female control samples were used.
Statistical Analysis
Data analysis was performed using STATA software. Difference in means was compared using Student’s t-test. The data assumed equal variance and were considered significantly different when p <0.05. Frataxin levels in control, carrier, and patient samples were typically expressed as % of average control. Means were expressed as % of average control ± standard deviation (SD) or standard error (SE), and variability was expressed using the coefficient of variation (%CV).
Results
Clinical and Demographic Information
Clinical and demographic information for the 195 FRDA patients (complete information unavailable for all 195 patients) is summarized in Table 1. The number of GAA repeats ranged from 41–1200, with a median value of 675. The age of onset ranged from 2–63, with a median age of 9; the majority of patients sampled were from the Children’s Hospital of Philadelphia (n=85) and the UCLA Medical Center (n=54), so there were few older-onset FRDA patients in this study that came from elsewhere.
Table 1.
Summary of clinical and demographic values from FRDA patients
| Sex (M/F, n=166) | Age, years (n=188) |
Age of Onset, years (n=183) |
GAA Repeat Range (n=171) |
FARS (n=90) |
|---|---|---|---|---|
| 81/85 | 3–76 | 2–63 | 41–1200 | 27.33–113 |
195 patients were involved in the study, but complete information for all patients could not be obtained.
FARS = Friedreich ataxia rating scale
Assay Reproducibility and Linearity
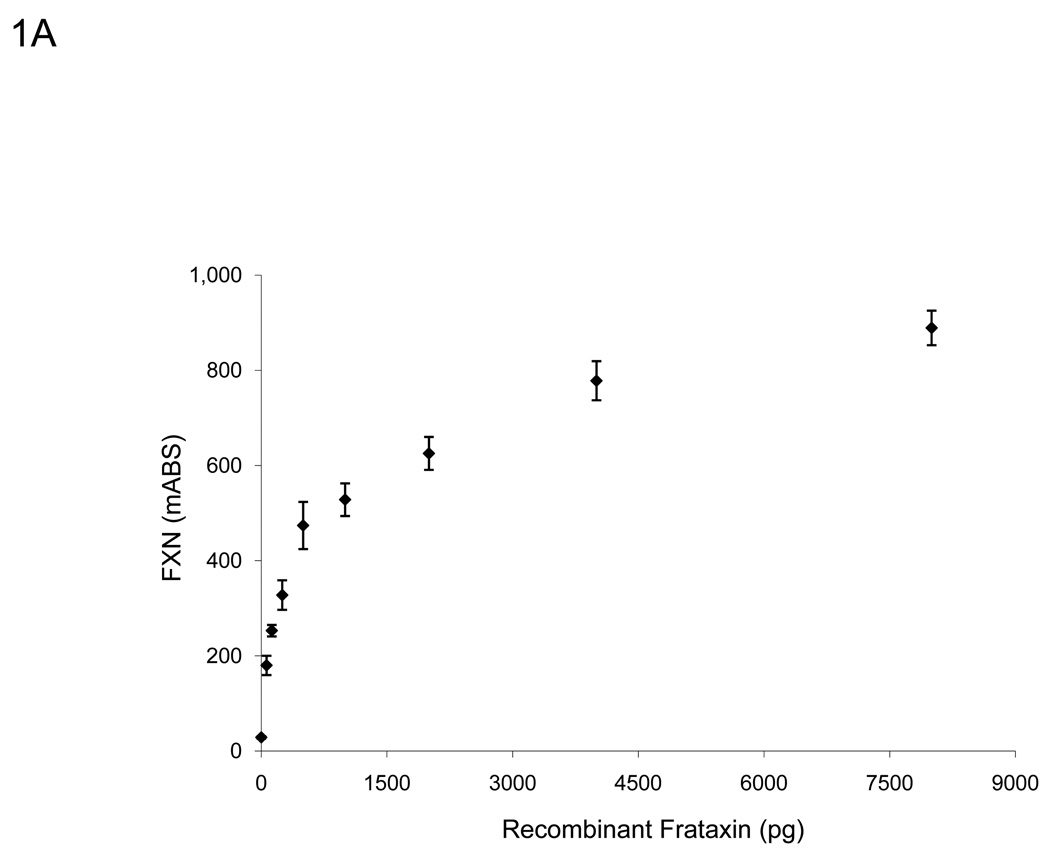
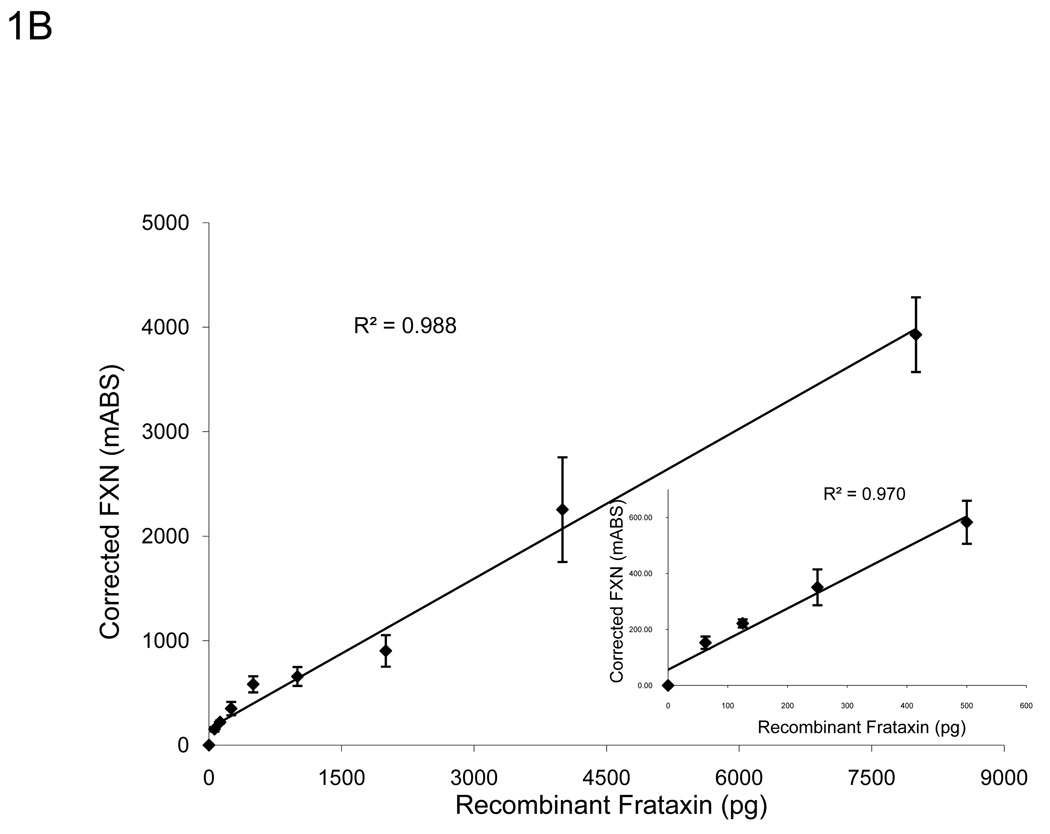
To determine the working range of the lateral flow immunoassay, a standard curve was generated using recombinant frataxin protein (Figure 1). In agreement with previous work, the relationship between frataxin loaded and dipstick signal was linear through 500 pg of recombinant frataxin and did not saturate until approximately 4,000 pg of recombinant frataxin was loaded (Figure 1A) [21]. Furthermore, we determined that the assay’s linear range could be expanded significantly by normalizing the frataxin signal to the signal of the “procedural control” (goat anti-mouse IgG, GAM) band, which is an internal positive control automatically run on each dipstick. Because initial experiments with buccal swab samples indicated a similar, and perhaps more pronounced improvement using this approach (Figure 1B), all results reported here have been normalized to the “GAM” band as described in the Methods.
Figure 1.
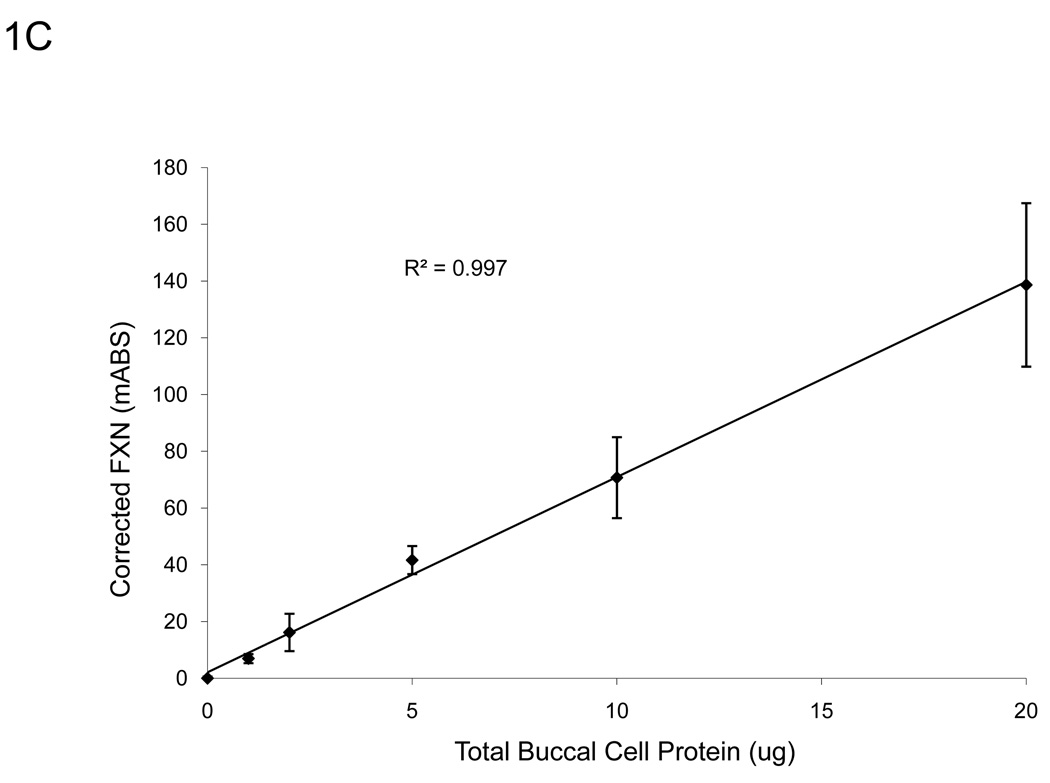
A. The assay remains sensitive and in the linear range through 500 pg of recombinant frataxin protein (n=3), higher than the amount of frataxin in 10 µg of total extracted protein from buccal cells (Figure 1C). Y-error bars show standard deviation. B. Normalized to GAM signal, the assay remains sensitive and in the linear range through 4000 pg of recombinant frataxin protein (n=3), levels much higher than the amount of frataxin in 10 µg of total extracted protein from buccal cells (Figure 1C). Y-error bars show standard deviation and show that error increases with increased signal, but variance remains consistent. C. The standard curve of a representative control (n=3, 0.899 µg/µl) using 0, 1, 2, 5, 10, 20, and 50 µg of total protein extracted from a cheek swab shows the assay remains in the linear range between 0–20 µg -- levels easily obtained from a typical cheek swab. All samples were normalized to 0 µg dipsticks and corrected for the completion of the assay (GAM) of the negative control. Y-error bars show standard deviation.
A typical cheek swab contains approximately 700 µg of total cell protein, at a concentration of 1–3 µg/µl, and up to 50 µl of each buccal cell sample can be loaded into wells reliably for the lateral immunoassay. A standard curve using a range of buccal cell protein amounts from 0–50 µg of a representative control sample (Figure 1C) showed that the assay remained linear throughout the experimental range of 0–20 µg (R2 = 0.997). Therefore, for ease of use and to remain within the most linear range of the immunoassay, a set amount (10 µg) of total cellular cheek swab protein was used in routine experiments. Importantly, loading 10 µg per test allows accurate measurement of the reduced frataxin levels (10–30% of control values) expected (and observed) in FRDA patient samples. Note that this amount is small compared to the total amount of protein collected per cheek swab (~700 µg), allowing frozen storage of an archive of samples for additional subsequent study.
Reproducibility of the assay was assessed by intra-assay, interassay, and intersample variability within the working range of buccal cell extracts collected from a representative control and patient (Tables 2 and 3). The immunoassay was reproducible within the working range with reasonable intra-assay (3.3–11.2% and 0.5–12.2%, control and patient, respectively), interassay (10.3% and 5.3%, control and patient, respectively), and intersample (17.4%, control) coefficient of variation (CV) values. CV values (standard deviation expressed as percent of mean) may be higher for patients than controls in some instances due to the low residual levels of frataxin in patient samples, i.e., small variations in absolute values result in larger percent CV values. The variability seen between different collected samples from the same individual can be attributed to a combination of intra-assay variance and unknown biological factors. Even with thorough rinsing, there are likely to be small, varying levels of non-cellular protein harvested with buccal cells while swabbing the inner cheek that can alter protein concentrations measured. A disproportionate amount of this non-cellular protein in aliquots of harvested buccal cells may have also contributed to interassay and intersample variability. Subsequent variability and reproducibility studies in controls and patients showed similar results to that seen in Table 2 and Table 3.
Table 2.
Inter and Intra-assay variability in cheek swab frataxin protein quantification from a control sample
| Experiment | Dipstick 1 | Dipstick 2 | Dipstick 3 | Mean | St.Dev | CV (%) |
|---|---|---|---|---|---|---|
|
Intra-assay Variability |
||||||
| Day 1 | 51.5 | 47.5 | 54.4 | 51.1 | 3.5 | 6.8 |
| Day 2 | 68.1 | 54.8 | 65.6 | 62.8 | 7.1 | 11.2 |
| Day 3 | 58.5 | 54.8 | 56.1 | 56.5 | 1.9 | 3.3 |
|
Inter-assay Variability (Day 1–3) |
Mean | St.Dev | CV (%) | |||
| 56.8 | 5.9 | 10.3 | ||||
|
Inter-sample Variability |
Day 1 | Day 2 | Day 3 | Mean | St.Dev | CV (%) |
| 76.0 | 62.9 | 89.4 | 76.1 | 13.3 | 17.4 | |
Intra and inter-assay variability in frataxin protein quantification in buccal cells (raw milli-absorbance). To assess the intra-assay error, 10 µg of total protein from buccal cells of the same control sample was assayed in triplicate on the same plate. To measure inter-assay variability, 10 µg of total protein from buccal cells of the same control sample was assayed in triplicate on three different days. The means, standard deviations, and coefficient of variation (CV%) are shown above. Inter-sample variability was calculated from a sample collected from the same control on three different days; milli-absorbance values were normalized to negative controls and the internal goat anti-mouse positive control band.
Table 3.
Inter and Intra-assay variability in cheek swab frataxin protein quantification from a patient sample
| Experiment | Dipstick 1 | Dipstick 2 | Dipstick 3 | Mean | St.Dev | CV (%) |
|---|---|---|---|---|---|---|
|
Intra-assay Variability |
||||||
| Day 1 | 20.5 | 20.9 | 25.4 | 22.3 | 2.7 | 12.2 |
| Day 2 | 23.9 | 23.9 | 23.7 | 23.8 | 0.1 | 0.5 |
| Day 3 | 22.7 | 19.7 | 22 | 21.5 | 1.6 | 7.3 |
|
Inter-assay Variability (Day 1–3) |
Mean | St.Dev | CV (%) | |||
| 22.5 | 1.2 | 5.3 | ||||
Intra and inter-assay variability in frataxin protein quantification in buccal cells (raw milli-absorbance) from a patient sample. CV = Coefficient of Variation
Frataxin Measurements from Buccal Cells and Whole Blood
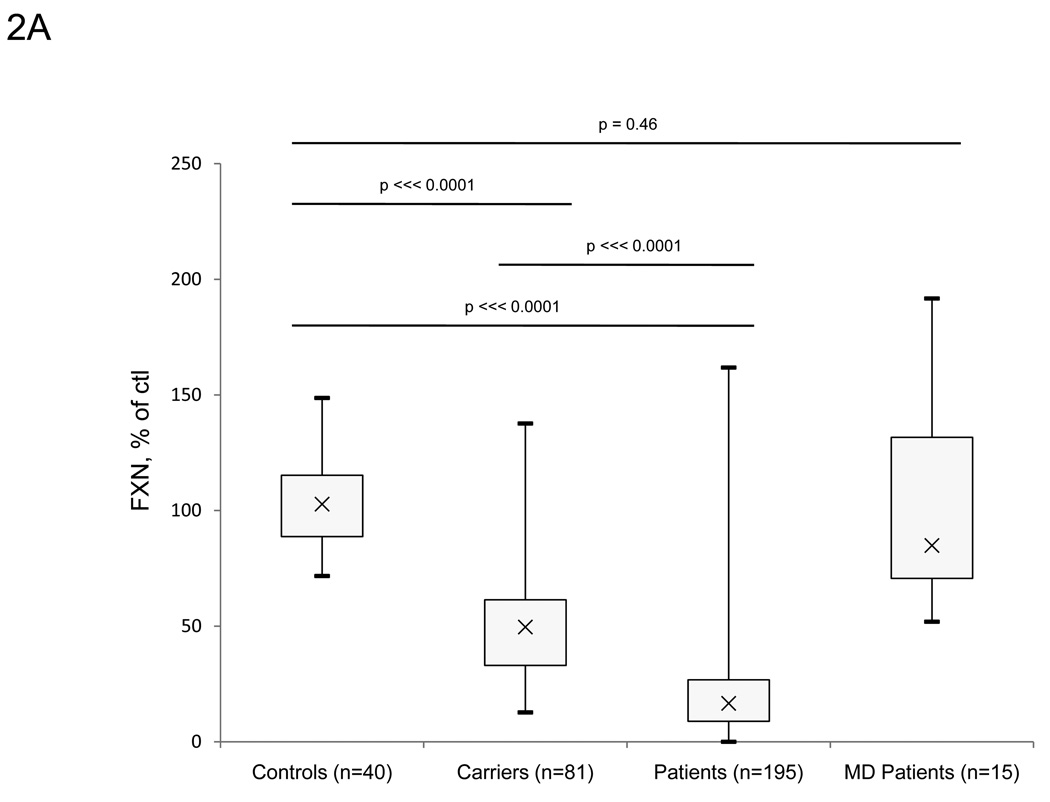
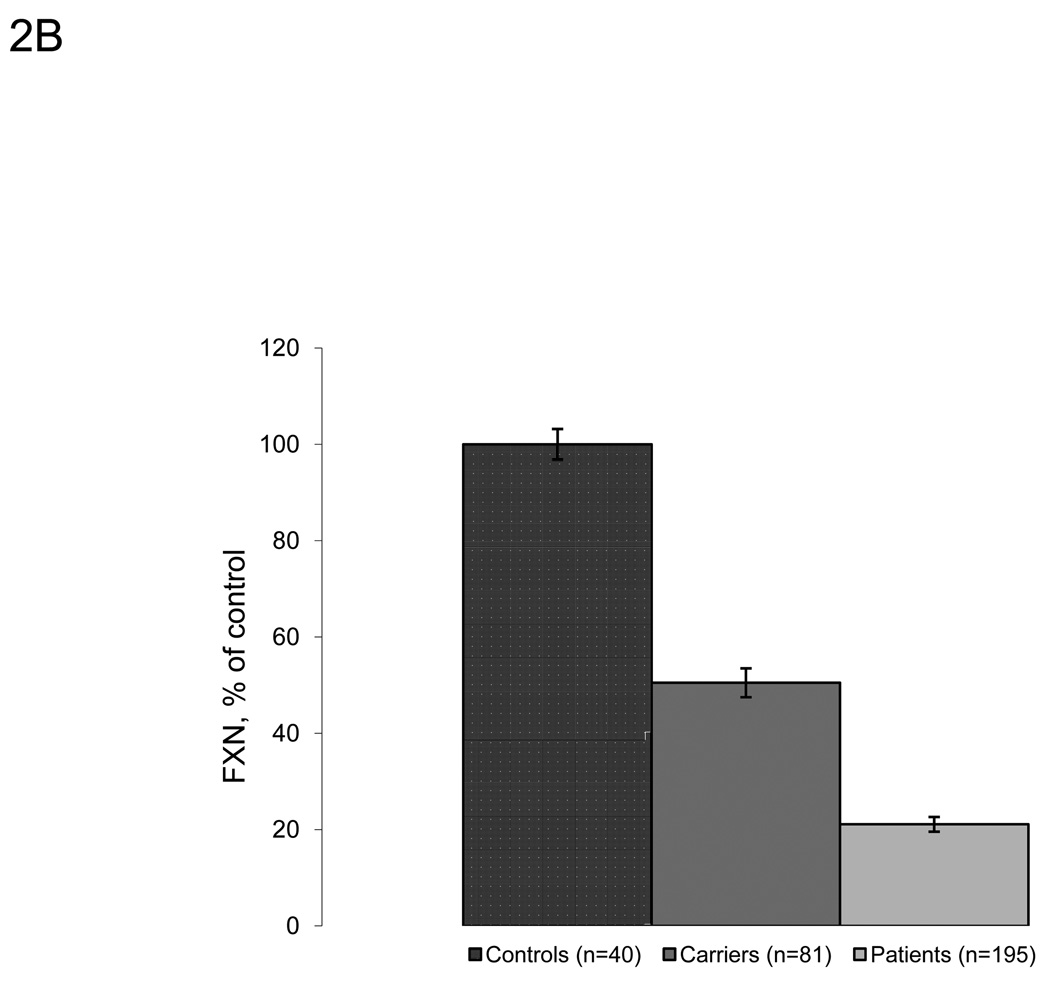
We expanded upon the previous studies using this approach and measured frataxin protein levels from large numbers of buccal cell samples collected from cheek swabs of controls (n=40), known carriers (n=81), and FRDA patients (n=195). Carriers and FRDA patients show significantly lower amounts of frataxin protein compared to controls (50.5% of control, p ⋘ 0.0001, and 21.1% of control, p ⋘ 0.0001, respectively) (Figure 2A–B). The absolute value of frataxin in control buccal swabs is approximately 30 pg/µg total protein (data not shown). Values from controls, known carriers, and FRDA patients overlap slightly, although there is no overlap between the interquartile range in any of the three groups. While this overlap may reflect the variability intrinsic to the assay to some degree (Figure 1), a few patients had levels of frataxin in the control range (nine outliers >1.5*IQR above Q3). Most of these individuals had later onset disease. For example, the three patients with highest frataxin levels (161.8, 151.7, and 99.8% of control) were all late-onset patients (age of onset 40, 43, and 27 respectively), suggesting a relationship between measured frataxin levels and severity of disease. Frataxin levels were also measured in eight patients who are compound heterozygotes with one expanded allele, and one identified point mutation in the FXN gene. These patients all have reduced frataxin levels with seven of the eight in the lower range of individuals with GAA expansions on both alleles (Table 4). As a control for the presence of disease/disability, frataxin levels were measured in buccal cells collected from cheek swabs of non-FRDA movement disorder patients (n=15) (Figure 2A). Confirming the specificity of low frataxin protein levels for FRDA patients, the non-FRDA movement disorder patients had average frataxin levels similar to the control group (103.3% of control, SDnon-FRDA − 45.9) with no statistically significant differences (p=0.46). These patients also serve as age-matched controls for FRDA-patients.
Figure 2.
Lateral flow immunoassays showed significant differences between controls, known carriers and patients in collected buccal cell samples. A. Frataxin protein levels in buccal cells collected from controls (n=40), known carriers (n=81), patients (n=195), and non-FA movement disorder (MD) patients (n=15). Buccal cells were collected and assayed as described in the Methods section, and data is expressed as frataxin, % of average control for that day’s experiment. The carrier group contains 3 outliers (>1.5*IQR above/below quartiles), while the patient group contains 9 outliers. The p-values (Student’s t-test) were calculated for two samples assuming equal variance. B. Average frataxin protein levels in buccal samples collected in A. (expressed as % of control). Known carriers (n=81) and patients (n=195) show significant decreases in frataxin protein (50.5% and 21.1% of control, respectively) compared to controls (n=40).
Table 4.
Frataxin levels measured in compound heterozygotes with GAA expansions and known point mutations
| Patient | Sex | GAA repeat # | Age/Age of Onset |
Point Mutation | FXN levels, % of control |
|---|---|---|---|---|---|
| P.MUT.001 | M | 633 | 20/16 | I154F | 17.6 |
| P.MUT.002 | M | 1000 | 21/5 | R165C | 46.4 |
| P.MUT.003 | F | 734 | 15/4 | W155R | 17.9 |
| P.MUT.004 | M | 832 | 11/3 | L106S | 5.9 |
| P.MUT.005 | M | 840 | 51/18 | G130V | 14.5 |
| P.MUT.006 | M | 840 | 55/18 | G130V | 12.4 |
| P.MUT.007 | F | 986 | 9/3 | G130V | 6.6 |
| P.MUT.008 | F | 613 | 19/6 | c.483-1G>T | 10.6 |
Patients with known deleterious point mutations were assayed for frataxin protein levels. Seven out of eight patients displayed significant deficits in frataxin protein and are within the FRDA patient range.
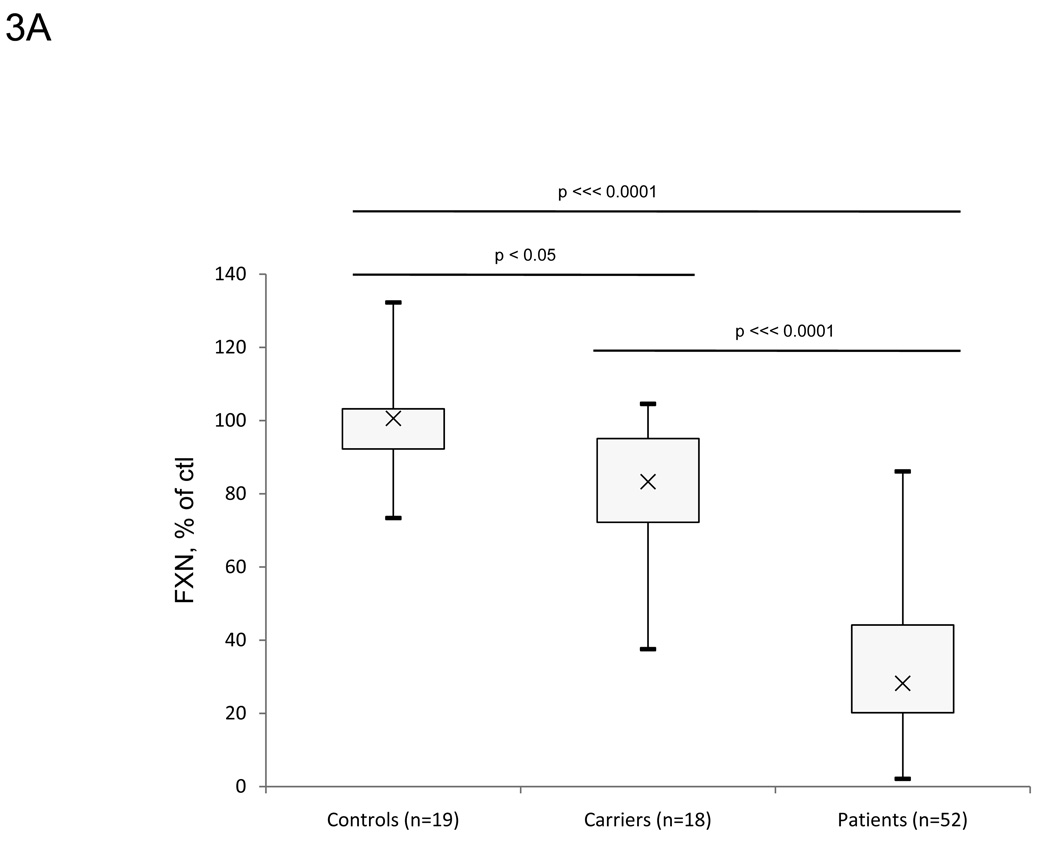
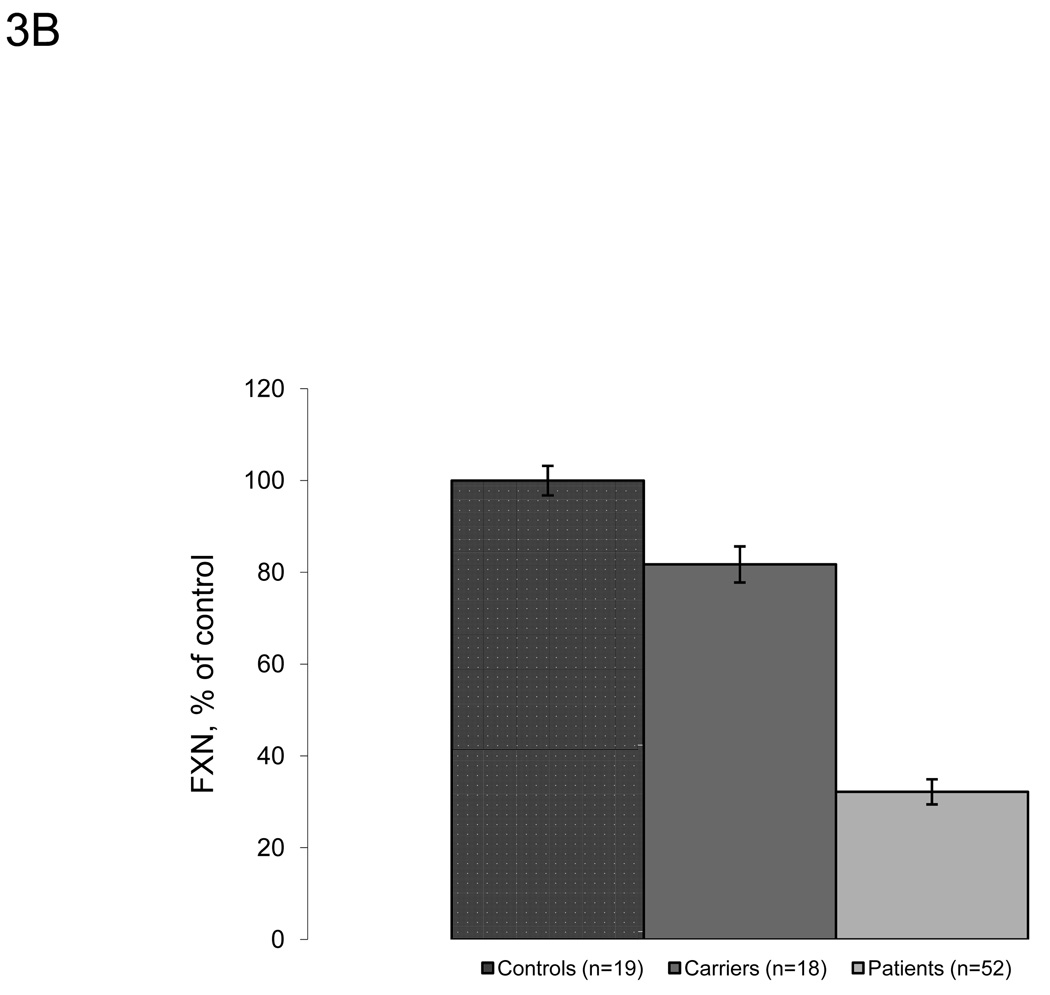
Frataxin protein levels were also measured in whole blood (Figure 3A–B). Similarly to buccal cells, known carriers (n=18) and patients (n=52) show lower amounts of frataxin protein (81.7% and 32.2% of control, respectively) compared to controls (n=19). There were higher relative frataxin levels in whole blood from carriers and FRDA patients compared to protein extracts from buccal cells. Although less than in buccal cell measurements, there is some overlap between the three groups, which may partially be a result of intra-assay variability. The values are reproducible with intra-assay CV values less than 8% under different blood storage conditions (Table 5). Control blood samples contained frataxin at a concentration of approximately 30 pg/µl of prepared whole blood (data not shown).
Figure 3.
Lateral flow immunoassays also showed significant differences between controls, known carriers and patients in whole blood samples. A. Frataxin protein levels in whole blood samples collected from controls (n=19), known carriers (n=18), and patients (n=52). Protein from whole blood was extracted and assayed as described in the Methods section, and data is expressed as frataxin, % of average control for that day’s experiment. FRDA patients show significant decreases in frataxin protein compared to carriers and controls. The control group contains 3 outliers (>1.5*IQR above/below quartiles) carrier and patient groups contain 1 outlier. The p-values (Student’s t-test) were calculated for two samples assuming equal variance. B. Average frataxin protein levels in whole blood collected in A. with standard error Y-error bars (expressed as % of control). Similarly to buccal cells, known carriers (n=18) and patients (n=52) show significantly less amounts of frataxin protein (81.7% and 32.2% of control, respectively) compared to controls (n=19).
Table 5.
Reproducibility of frataxin protein quantity in whole blood samples from controls
| Experiment | Sample 1 | Sample 2 | Sample 3 | Mean | St.Dev | CV (%) |
|---|---|---|---|---|---|---|
| Frataxin Protein | ||||||
| −80°C immediately | 325.043 | 302.166 | 353.540 | 326.916 | 25.738 | 7.9 |
| 4°C 1hr, then −80°C | 254.123 | 249.211 | 244.935 | 249.423 | 4.598 | 1.8 |
| Fresh Blood | 234.260 | 212.469 | 204.488 | 217.072 | 15.410 | 7.1 |
Reproducibility of frataxin protein quantity (raw milli-absorbance) was examined in whole blood under different storage conditions: frozen immediately and stored at −80°C, stored at 4°C for 1 hr then stored at −80°C, or assayed immediately after blood draw. CV = Coefficient of Variation
Analysis of Patient Data
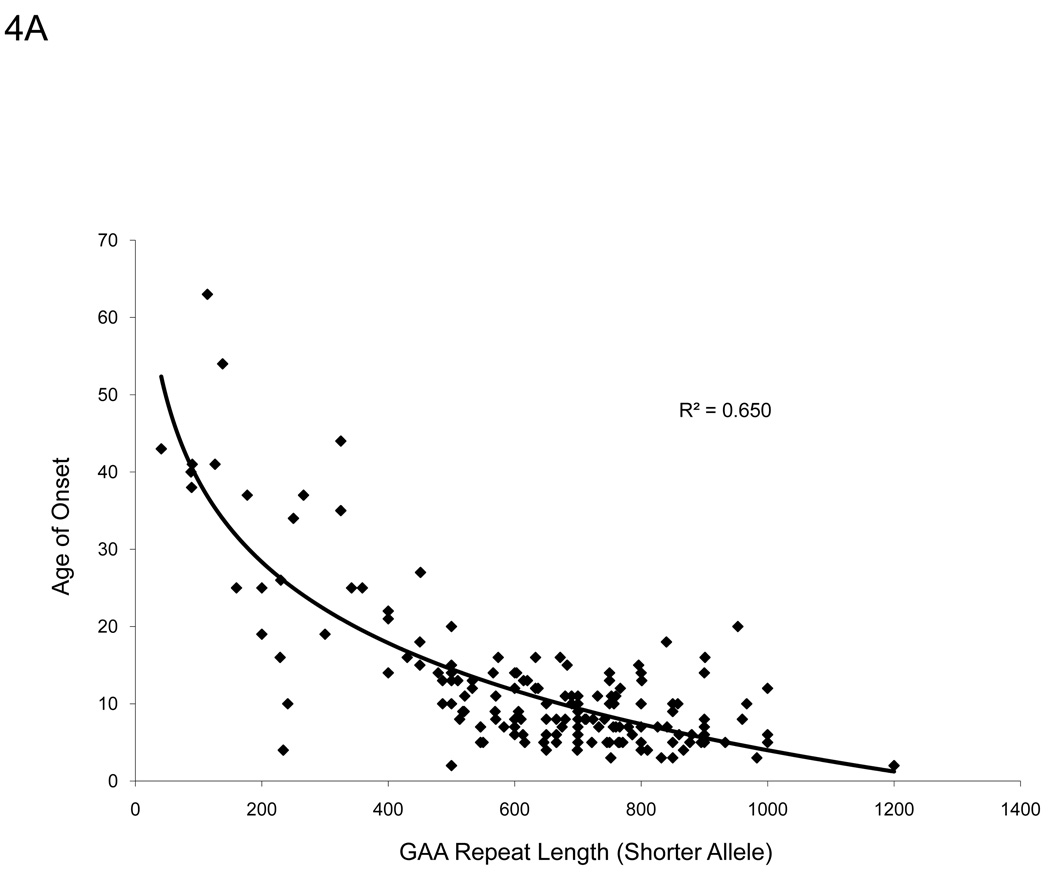
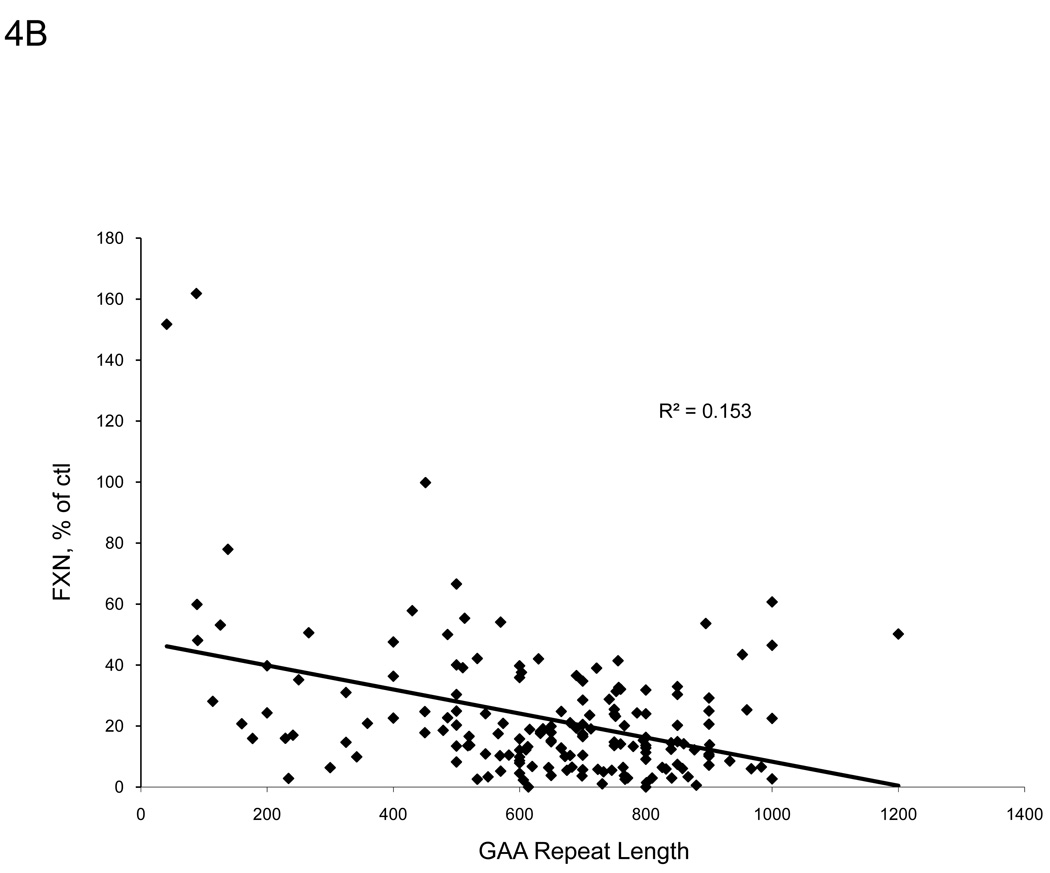
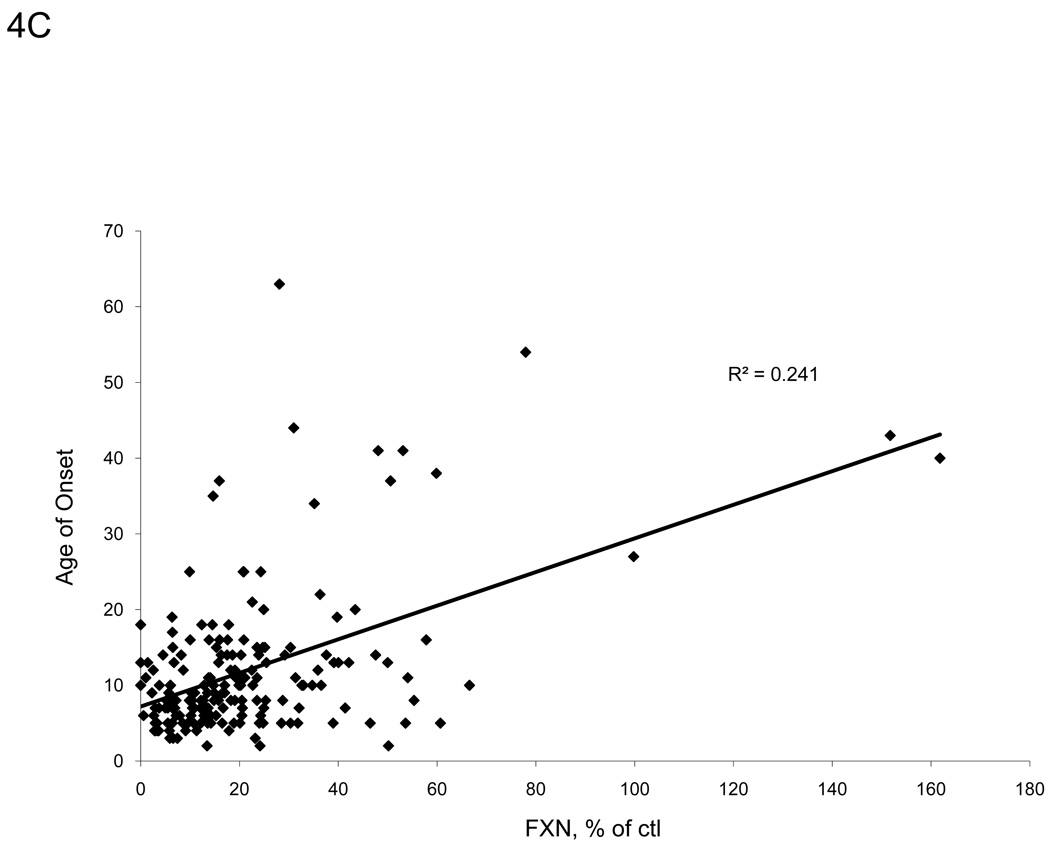
A strong inverse hyperbolic correlation (R2 = 0.650, p<0.001) exists between patient age of onset and GAA repeat length on the shorter allele for the patients in our sample group (Figure 4A), in agreement with other studies [10,23]. Frataxin protein levels from buccal cell extracts of FRDA patients also correlated with GAA repeat length of the shorter allele (R2 = 0.153, p<0.001) and even more so with the age of onset (R2 = 0.241, p<0.001) (Figure 4B–C). These data suggest that the immunoassay captures information relating to the disease severity.
Figure 4.
There are distinct relationships between frataxin levels and severity of disease. A. We confirm the suggested inverse relationship between patient age of onset and GAA repeat length of the shorter allele (p<0.001). B. Measured frataxin levels inversely correlates with GAA repeat length, suggesting that the assay is useful for assessing severity of disease in buccal cells (p<0.001). C. Age of onset correlates directly with measured frataxin levels (p<0.001).
Interestingly, frataxin levels also correlated with age (R2 = 0.155, p<0.001) in FRDA patients. To separate the effect of multiple covariates of subject age that could secondarily alter frataxin levels, we used linear regression analysis using frataxin levels as the dependent variable and age, sex, and GAA repeat length as independent variables. In controls and carriers, GAA repeat length was not included. In control samples, age at buccal cell collection did not predict with frataxin levels in models accounting for sex (p=0.48 for age, p=0.39 for sex, R2 = 0.03, n=31), indicating that age does not alter frataxin levels in control subjects. Similar results were noted with carriers (p=0.78 for age, p=0.40 for sex, R2=0.03, n=34). In contrast, among FRDA patients GAA repeat length was highly predictive of frataxin level (p=0.002) as was age (p=0.001, R2=0.21), with older age predicting higher frataxin levels. Sex did not predict frataxin levels (p=0.94); this reveals the presence of age dependence of frataxin levels in our patient cohort.
We also assessed whether quantification of disease progression by neurological exam predicted frataxin scores. While there was no correlation between FARS exam scores and frataxin levels (p=0.24, R2=0.02), in multivariate linear regression models FARS exam scores did predict frataxin levels when age was accounted for (p=0.000 for age, p=0.002 for FARS, R2=0.29, n=86). However, when models accounted for GAA repeat length, FARS scores did not predict frataxin levels. Likewise, FARS scores were not predicted by frataxin when taking GAA repeat length into account (p=0.424 for frataxin, p=0.398 for GAA, R2=0.03). This shows that clinical severity does reflect frataxin level, but clinical severity does not predict levels to the degree predicted by genetic severity.
MLPA Analysis Identifies a Novel Deletion
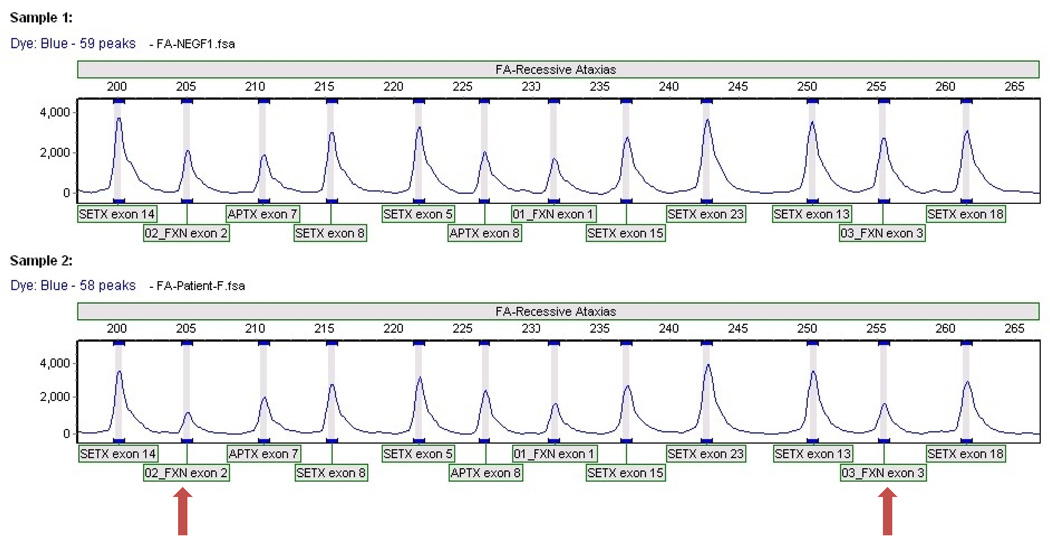
Approximately 96–98% of all FRDA patients carry an expanded GAA repeat on both alleles of the FXN gene, while the remaining 2–4% are compound heterozygotes for an expanded GAA repeat on one allele and a deleterious point mutation within the FXN gene on the other allele [1,12,13]. During the course of our work, we identified eleven patients who had phenotypes that were similar to FRDA but who did not have pathogenic mutations identified on each allele, including two with only a single point mutation. Seven of these patients had reduced frataxin levels detected in buccal cell samples, with six of them in the low end of the patient range (Table 6). One patient (P.A.011) had levels of frataxin below the range of detection and thus was given a “0” value. We screened a subset of these patients for a possible deletion in the FXN gene using multiplex ligation-dependent probe amplification (Table 6). Five of the six patients tested were negative for any deletions within the FXN gene, but one patient carried a novel heterozygous partial deletion that included exons 2 and 3 indicated by a decrease in amplification of the associated primer pairs (Figure 5 bottom). This mutation appears to be deleterious as indicated by the lower frataxin levels and FRDA-like phenotype the patient displays. These data further confirm the wide spectrum of deleterious FXN mutations and indicate that other patients likely carry deleterious mutations that remain to be characterized.
Table 6.
Mutation status and frataxin levels measured in patients with Freidreich ataxia-like phenotypes
| Patient | Sex | Age/Age of Onset | Notes | FXN levels, % of control |
MLPA Result |
|---|---|---|---|---|---|
| P.A.001 | F | 14/10 | 1 expanded GAA repeat; no known point mutations |
19.5 | Heterozygous for partial gene deletion of FXN (exons 2–3) |
| P.A.002 | M | 8/7 | Start codon mutation; no expanded GAA repeats |
1.6 | Negative |
| P.A.003 | F | 15/5 | 1 expanded GAA repeat; no known point mutations |
17.5 | Negative |
| P.A.004 | F | 22/− | No expanded GAA repeats; 1 known point mutation |
7.4 | Negative |
| P.A.005 | M | 1 expanded GAA repeat; no known point mutations |
2.1 | ND | |
| P.A.006 | M | 44/20 | 1 expanded GAA repeat; no known point mutations; adult- onset, mildly-spastic phenotype |
ND | Negative |
| P.A.007 | F | 28/11 | No expanded GAA repeats or known point mutations |
62.4 | Negative |
| P.A.008 | F | No expanded GAA repeats or known point mutations |
107.6 | ND | |
| P.A.009 | - | 40/18 | ND | 108.9 | ND |
| P.A.010 | - | 31/11 | No expanded GAA repeats | 112.5 | ND |
| P.A.011 | M | 18/10 | 1 expanded GAA repeat; no known point mutations |
0* | ND |
FRDA patients labeled as “atypical” patients are those with a phenotype similar to FRDA but don’t share the genetic profile of “typical” FRDA patients: a GAA expansion on both alleles or a GAA expansion on one allele and a pathogenic mutation on the other allele. Six of the eleven patients had significantly reduced frataxin levels in the low patient range.
* = no detectable frataxin signal on dipstick. ND = not determined.
Figure 5.
MLPA results for a normal control (top) and for P.A.001 (bottom) revealing a heterozygous deletion of exons 2 and 3 of the FXN gene (arrows). Mutations in APTX and SETX genes are involved in ataxia-ocular apraxia.
Discussion
In the current study, we have shown that a rapid, lateral-flow immunoassay can be used to noninvasively assess disease severity in FRDA patients, measure frataxin levels in a clinical research study format, and serve as a complementary diagnostic tool. This assay identifies differences in frataxin protein levels between controls, carriers, and patients in buccal cells and whole blood. Protein extracted from purified PBMCs and platelets also showed clear differences (data not shown), although the isolation procedure is more involved and thus not ideal for clinical trial settings.
While frataxin levels correlate with age of onset and GAA repeat length (Figure 4B, 4C), there was no correlation between FARS (Friedreich ataxia rating scale) scores and frataxin levels, indicating that frataxin levels match biologic severity of disease but remains unaffected by clinical status unless one accounts for subject age (noted in linear regression models). Thus, the simplicity of the lateral flow assay makes it useful in clinical research studies alongside clinical measures. It provides a biologic measure, not a clinical measure, which can be useful in assessing therapies designed to alter the steps leading to frataxin deficiency.
Although there are clear differences between the controls and carriers, there also appears to be substantial overlap between the two groups, which could be explained by a number of factors. Overall, none of the IQRs intersect between any of the three groups, suggesting that it is mainly outliers responsible for some of the overlap. Some of the patient overlap with other groups may again be attributed to late-onset and other less severely affected FRDA patients. Similar results are seen in platelet and PBMC samples (data not shown), suggesting that this overlap is seen in multiple tissues that are unaffected in FRDA. There are several explanations for this. Frataxin may be an inducible protein in some situations, and it may be the inability to increase frataxin levels that gives rise to disease [24–26]. If this were true, then samples from subjects could easily vary from day-to-day depending on many factors, including diet and time of day, thus explaining the highly variable results in controls. In addition, it would explain the overlap in unaffected tissue by presuming that frataxin levels in affected tissues are always being induced. Similarly, identification and characterization of outliers may lead to discovery of additional genetic modifiers of frataxin levels, and thus provide new targets for therapeutic intervention and recovery of frataxin levels in FRDA patients.
However, the complex age relation of frataxin levels in patients may play a role in the overlap between groups. Our data show that within the patient group only, age predicted frataxin level when accounting for GAA repeat length. This could reflect statistical considerations in a failure to completely account for effects of shorter GAA repeat length in older subjects; there were no advanced-aged early-onset patients in the cohort, and all of the older patients were less severely affected late-onset FRDA patients indicating a patient selection bias in our sample population. However, this could not explain the levels of the least severely affected patients being found in the normal range. Thus, the age relation also could reflect biological factors related to age if cells carrying shorter GAA repeats were selected for over the course of aging. As somatic variability is shown to exist in FRDA, this provides a reasonable explanation for the age dependence of frataxin levels as well as the overlap between control and patient groups [27,28]. In addition, increased frataxin levels with age may be accounted for by contraction of the longer GAA repeats as seen in vivo, thus adopting the properties of cells from less severely affected patients with smaller GAA repeat length [29].
We measured frataxin levels in eight compound heterozygous patients with an expansion on one allele and a known point mutation on the other allele (Table 4); all eight patients display reduced frataxin levels with seven of the eight in the lower FRDA patient range. However, protein levels did not correlate with phenotypic severity. Patients heterozygous for the G130V mutation often present with a milder, atypical phenotype, but we have shown that they still have frataxin protein levels <15% of controls [30]. In contrast, they have roughly 50% of normal mRNA levels, consistent with this mutation leading to loss of protein after translation of the altered transcript [30]. One patient with a severe phenotype with the W155R mutation, at an evolutionarily conserved residue of frataxin protein, was assayed to have 17.9% frataxin compared to controls, levels similar to other compound heterozygous and homozygous FRDA patients.
In our study we have come across a few patients missing an expansion, a deleterious point mutation, or both (Table 6). Although they theoretically exist, no double-point mutation patients with normal GAA repeat lengths have been reported, as null mutations are likely embryonic lethal. There must be other deleterious mutations that account for patients that still display an FRDA-like phenotype but have only one or no detectable mutation in the FXN gene. Zühlke, et al (2004) have detected a heterozygous 2776 bp deletion including exon 5a in one of their patients that resulted in a 50-residue deletion in the frataxin protein [31]. Here, we measured frataxin levels in ten of eleven patients that exhibit an FRDA-like phenotype that do not have a FXN gene mutation (GAA expansion or point mutation) on both alleles (Table 6). MLPA analysis on six of these patients revealed a novel deletion encompassing exons 2 and 3 of the FXN gene in a patient with a single GAA expansion (Figure 5). It is possible that the five patients testing negative in the MLPA analysis are actually carriers that registered positive for low frataxin in the immunoassay. The carrier frequency for FRDA is approximately 1:100, so they could have potentially been in the low range of carrier frataxin levels. However, these individuals do have a phenotype resembling FRDA, suggesting that they may in fact have an as yet undetected mutation resulting in disease. Taken together, these reports all indicate that the spectrum of mutations for FRDA is wider than originally anticipated.
Acknowledgments
We wish to sincerely thank all FRDA patients, their relatives, and all other individuals who volunteered blood and cheek swab samples for this study. We thank Karlla Brigatti, Baali Muganga, Sarah Lagedrost, Lisa Friedman, and Erin Paulsen of the Children’s Hospital of Philadelphia and Sharone Trifskin of the UCLA Medical Center for providing us with patient samples and demographic information used for analysis.
Abbreviations
- FRDA
Friedreich ataxia
- FXN
frataxin
- FXN
frataxin gene
- MLPA
multiplex ligation-dependent probe amplification
- GAM
goat anti-mouse IgG
- CV
Coefficient of Variation
- IQR
Interquartile Range
- PBMC
peripheral blood mononuclear cells
- FARS
Friedreich ataxia rating scale
References
- 1.Campuzano V, Montermini L, Molto MD, Pianese L, Cossee M, Cavalcanti F, Monros E, Rodius F, Duclos F, Monticelli A, Zara F, Canizares J, Koutnikova H, Bidichandani SI, Gellera C, Brice A, Trouillas P, De Michele G, Filla A, De Frutos R, Palau F, Patel PI, Di Donato S, Mandel JL, Cocozza S, Koenig M, Pandolfo M. Friedreich’s ataxia: Autosomal recessive disease caused by an intronic GAA triplet repeat expansion. Science. 1996;271:1423–1427. doi: 10.1126/science.271.5254.1423. [DOI] [PubMed] [Google Scholar]
- 2.Wilson RB. Iron Dysregulation in Friedreich Ataxia. Semin Pediatr Neurol. 2006;13:166–175. doi: 10.1016/j.spen.2006.08.005. [DOI] [PubMed] [Google Scholar]
- 3.Lodi R, Tonon C, Calabrese V, Schapira AH. Friedreich’s ataxia: from disease mechanisms to therapeutic interventions. Antiox Redox Signal. 2006;8(3–4):438–443. doi: 10.1089/ars.2006.8.438. [DOI] [PubMed] [Google Scholar]
- 4.Lynch DR, Farmer JM, Balcer LJ, Wilson RB. Friedreich ataxia: effects of genetic understanding on clinical evaluation and therapy. Arch Neurol. 2002;59:743–747. doi: 10.1001/archneur.59.5.743. [DOI] [PubMed] [Google Scholar]
- 5.Dürr A A, Cossee M, Agid Y, Campuzano V, Mignard C, Penet C, Mandel JL, Brice A, Koenig M. Clinical and genetic abnormalities in patients with Friedreich's ataxia. N Engl J Med. 1996;335:1169–1175. doi: 10.1056/NEJM199610173351601. [DOI] [PubMed] [Google Scholar]
- 6.Schöls L, Amoiridis G, Przuntek H, Frank G, Epplen JT, Epplen C. Friedreich's ataxia: revision of the phenotype according to molecular genetics. Brain. 1997;120:2131–2140. doi: 10.1093/brain/120.12.2131. [DOI] [PubMed] [Google Scholar]
- 7.Ohshima K, Montermini L, Wells RD, Pandolfo M. Inhibitory effects of expanded GAA.TTC triplet repeats from intron I of the Friedreich ataxia gene on transcription and replication in vivo. J Biol Chem. 1998;273(23):14588–14595. doi: 10.1074/jbc.273.23.14588. [DOI] [PubMed] [Google Scholar]
- 8.Sakamoto N, Chastain PD, Parniewski P, Ohshima K, Pandolfo M, Griffith JD, Wells RD. Sticky DNA: self-association properties of long GAA.TTC repeats in R.R.Y triplex structures from Friedreich’s ataxia. Mol Cell. 1999;3(4):979–982. doi: 10.1016/s1097-2765(00)80474-8. [DOI] [PubMed] [Google Scholar]
- 9.Al-Mahdawi S, Pinto RM, Ismail O, Varshney D, Lymperi S, Sandi C, Trabzuni D, Pook M. The Friedreich ataxia GAA repeat expansion mutation induces comparable epigenetic changes in human and transgenic mouse brain and heart tissues. Hum Mol Genet. 2008;17(5):735–746. doi: 10.1093/hmg/ddm346. [DOI] [PubMed] [Google Scholar]
- 10.Filla A, De Michele G, Cavalcanti F, Pianese L, Monticelli A, Campanella G, Cocozza S. The relationship between trinucleotide (GAA) repeat length and clinical features in Friedreich ataxia. Am J Hum Genet. 1996;59:554–560. [PMC free article] [PubMed] [Google Scholar]
- 11.Montermini L, Richter A, Morgan K, Justice CM, Julien D, Castellotti B, Mercier J, Poirier J, Capozzoli F, Bouchard JP, Lemieux B, Mathieu J, Vanasse M, Seni MH, Graham G, Andermann F, Andermann E, Melançon SB, Keats BJ, Di Donato S, Pandolfo M. Phenotypic variability in Friedreich ataxia: role of the associated GAA triplet repeat expansion. Ann Neurol. 1997;41:675–682. doi: 10.1002/ana.410410518. [DOI] [PubMed] [Google Scholar]
- 12.Pandolfo M. Friedreich ataxia: Detection of GAA repeat expansions and frataxin point mutations. Methods Mol. Med. 2006;126:197–216. doi: 10.1385/1-59745-088-X:197. [DOI] [PubMed] [Google Scholar]
- 13.Cossee M, Durr A, Schmitt M, Dahl N, Trouillas P, Allinson P, Kostrzewa M, Nivelon-Chevallier A, Gustavson KH, Kohlschutter A, Muller U, Mandel JL, Brice A, Koenig M, Cavalcanti F, Tammaro A, De Michele G, Filla A, Cocozza S, Labuda M, Montermini L, Poirier J, Pandolfo M. Friedreich’s ataxia: point mutations and clinical presentation of compound heterozygotes. Ann Neurol. 1999;45:200–206. doi: 10.1002/1531-8249(199902)45:2<200::aid-ana10>3.0.co;2-u. [DOI] [PubMed] [Google Scholar]
- 14.Christodoulou K, Deymeer F, Serdaroğlu P, Ozdemir C, Poda M, Georgiou DM, Ioannou P, Tsingis M, Zamba E, Middleton LT. Mapping of the second Friedreich's ataxia (FRDA2) locus to chromosome 9p23-p11: evidence for further locus heterogeneity. Neurogenetics. 2001;3:127–132. doi: 10.1007/s100480100112. [DOI] [PubMed] [Google Scholar]
- 15.Babady NE, Carelle N, Wells RD, Rouault TA, Hirano M, Lynch DR, Delatycki MB, Wilson RB, Isaya G, Puccio H. Advancements in the pathophysiology of Friedreich’s ataxia and new prospects for treatments. Molec Genet Metab. 2007;92:23–35. doi: 10.1016/j.ymgme.2007.05.009. [DOI] [PMC free article] [PubMed] [Google Scholar]
- 16.Grant L, Sun J, Xu H, Subramony SH, Chaires JB, Hebert MD. Rational selection of small molecules that increase transcription through the GAA repeats found in Friedreich’s ataxia. FEBS Lett. 2006;580:5399–5405. doi: 10.1016/j.febslet.2006.09.006. [DOI] [PMC free article] [PubMed] [Google Scholar]
- 17.Herman D, Jenssen K, Burnett R, Soragni E, Perlman SL, Gottsfeld JM. Histone deacetylase inhibitors reverse gene silencing in Friedreich’s ataxia. Nat Chem Biol. 2006;2:551–558. doi: 10.1038/nchembio815. [DOI] [PubMed] [Google Scholar]
- 18.Campuzano V, Montermini L, Lutz Y, Cova L, Hindelang C, Jiralerspong S, Trottier Y, Kish SJ, Faucheux B, Trouillas P, Authier FJ, Durr A, Mandel JL, Vescovi A, Pandolfo M, Koenig M. Frataxin is reduced in Friedreich ataxia patients and is associated with mitochondrial membranes. Hum. Mol. Genet. 1997;6:1771–1780. doi: 10.1093/hmg/6.11.1771. [DOI] [PubMed] [Google Scholar]
- 19.Boesch S, Strum B, Hering S, Goldenberg H, Poewe W, Scheiber-Mojdehkar B. Friedreich’s ataxia: Clinical pilot trial with recombinant human erythropoietin. Ann Neurol. 2007;62:521–524. doi: 10.1002/ana.21177. [DOI] [PubMed] [Google Scholar]
- 20.Steinkellner H, Scheiber-Mojdehkar B, Goldenberg H, Sturm B. A high throughput electrochemiluminescence assay for the quantification of frataxin protein levels. Analytica Chemica Acta. 2010;659:129–132. doi: 10.1016/j.aca.2009.11.036. [DOI] [PubMed] [Google Scholar]
- 21.Willis JH, Isaya G, Gakh O, Capaldi RA, Marusich MF. Lateral-flow immunoassay for the frataxin protein in Friedreich’s ataxia patients and carriers. Mol. Genet. Metab. 2008;94:491–497. doi: 10.1016/j.ymgme.2008.03.019. [DOI] [PMC free article] [PubMed] [Google Scholar]
- 22.Friedman LS, Farmer JM, Perlman S, Wilmot G, Gomez CM, Bushara KO, Mathews KD, Subramony SH, Ashizawa T, Balcer LJ, Wilson RB, Lynch DR. Measuring the rate of progression in Friedreich ataxia: Implications for clinical trial design. Mov. Disord. 2010 doi: 10.1002/mds.22912. [Epub ahead of print] [DOI] [PMC free article] [PubMed] [Google Scholar]
- 23.Delatycki MB, Paris DB, Gardner RJ, Nicholson GA, Nassif N, Storey E, MacMillan JC, Collins V, Williamson R, Forrest SM. Clinical and genetic study of Friedreich ataxia in an Australian population. Am J Med Genet. 2000;87:168–174. doi: 10.1002/(sici)1096-8628(19991119)87:2<168::aid-ajmg8>3.0.co;2-2. [DOI] [PubMed] [Google Scholar]
- 24.Oktay Y, Dioum E, Matsuzaki S, Ding K, Yan LJ, Haller RG, Szweda LI, Garcia JA. Hypoxia-inducible factor 2alpha regulates expression of the mitochondrial aconitase chaperone protein frataxin. J. Biol. Chem. 2007;282:11750–11756. doi: 10.1074/jbc.M611133200. [DOI] [PubMed] [Google Scholar]
- 25.Acquaviva F, Castaldo I, Filla A, Giacchetti M, Marmolino D, Monticelli A, Pinelli M, Saccà F, Cocozza S. Recombinant human erythropoietin increases frataxin protein expression without increasing mRNA expression. Cerebellum. 2008;7:360–365. doi: 10.1007/s12311-008-0036-x. [DOI] [PubMed] [Google Scholar]
- 26.Kuhlow D, Zarse K, Voigt A, Schulz TJ, Petzke KJ, Schomburg L, Pfeiffer AF, Ristow M. Opposing effects of dietary sugar and saturated fat on cardiovascular risk factors and glucose metabolism in mitochondrially impaired mice. Eur. J. Nutr. 2010 doi: 10.1007/s00394-010-0100-4. [Epub ahead of print] [DOI] [PubMed] [Google Scholar]
- 27.Sharma A, Bhatti S, Gomez M, Clark RM, Murray C, Ashizawa T, Bidichandani SI. the GAA triplet-repeat sequence in Friedreich ataxia shows a high levels of somatic instability in vivo, with a significant predilection for large contractions. Hum Mol Genet. 2002;11:2175–2187. doi: 10.1093/hmg/11.18.2175. [DOI] [PubMed] [Google Scholar]
- 28.Badhwar A, Jansen A, Andermann F, Pandolfo M, Andermann E. Striking intrafamilial phenotypic variability and spastic paraplegia in the presence of similar homozygous expansions of the FRDA1 gene. Mov Disord. 2004;19:1424–1431. doi: 10.1002/mds.20264. [DOI] [PubMed] [Google Scholar]
- 29.Sharma R, Bhatti S, Gomez M, Clark RM, Murray C, Ashizawa T, Bidichandani SI. The GAA triplet-repeat sequence in Friedreich ataxia shows a high level of somatic instability in vivo, with a significant predilection for large contractions. Hum Mol Genet. 2002;11:2175–2187. doi: 10.1093/hmg/11.18.2175. [DOI] [PubMed] [Google Scholar]
- 30.Bidichandani SI, Ashizawa T, Patel PI. Atypical Friedreich ataxia caused by compound heterozygosity for a novel missense mutation and the GAA triplet-repeat expansion. Am J Hum Genet. 1997;60:1251–1256. [PMC free article] [PubMed] [Google Scholar]
- 31.Zühlke CH, Dalski A, Habeck M, Straube K, Hedrich K, Hoeltzenbein M, Konstanzer A, Hollenbroich Y, Schwinger E. Extension of the mutation spectrum in Friedreich’s ataxia: detection of an exon deletion and novel missense mutations. Eur J Hum Genet. 2004;11:979–982. doi: 10.1038/sj.ejhg.5201257. [DOI] [PubMed] [Google Scholar]


