

Abstract
Achieving label-free, molecular-specific imaging with high spatial resolution in deep tissue is often considered the grand challenge of optical imaging. To accomplish this goal, significant optical scattering in tissues has to be overcome while achieving molecular specificity without resorting to extrinsic labeling. We demonstrate the feasibility of developing such an optical imaging modality by combining the molecularly specific stimulated Raman excitation with the photoacoustic detection. By employing two ultrashort excitation laser pulses, separated in frequency by the vibrational frequency of a targeted molecule, only the specific vibrational level of the target molecules in the illuminated tissue volume is excited. This targeted optical absorption generates ultrasonic waves (referred to as stimulated Raman photoacoustic waves) which are detected using a traditional ultrasonic transducer to form an image following the design of the established photoacoustic microscopy.
Keywords: biomedical imaging, microscopy, nonlinear optics, photoacoustics
The successful clinical treatment and fundamental studies of diseases, such as cancer, can significantly benefit from the earliest possible diagnosis of chemical and anatomical changes in tissue, which are strongly correlated with the first stage of disease development (1). Typically, those changes occur within the body and are therefore inaccessible for visual inspections. Some medical disorders and/or traumas, such as brain injuries, naturally occur deep within tissues, providing limited access for imaging the damaged area (see Fig. 1A). Moreover, chemical analysis of specific tissues, such as blood, is important for a number of diseases. Enabling the repeated or even continuous monitoring of blood-sugar levels noninvasively would relieve much of the burden associated with diabetes mellitus, which affects one out of 20 people worldwide (2).
Fig. 1.

(A) Schematic diagram illustrating one of the possible applications of stimulated Raman PA imaging. Lipid-rich myelin sheath can be efficiently heated through selective Raman photoexcitation, and the heat-generated acoustic wave intercepted by an ultrasound detector is used for deep-tissue neuron imaging. (B) Schematic diagram illustrating the major concept of the stimulated Raman PA excitation.
There are increasing needs to develop optical modality capable of label-free, chemically-specific imaging of deep-tissue structures. Optical methods are traditionally used when high-resolution, remote, and non- or minimally-invasive imaging is needed. They can provide nanoscopic spatial resolution (3), single-molecule sensitivity (4), and intrinsic specificity through selective excitation of vibrational levels (5, 6). The major obstacle of optical imaging is the strong optical scattering in tissue, which causes photons to diffusely propagate inside the tissue and, as a result, to wash out the spatial origins of the detected signals. Hence, existing optical imaging technologies cannot penetrate more than one optical transport mean free path (approximately 1 mm) in biological tissue while still maintaining a high resolution. However, even in small animal models, the early chemical and anatomical changes typically initiate beneath the skin surface at a depth of several millimeters, which are beyond the extent of modern high-resolution optical imaging technologies, such as two-photon microscopy (7) and optical coherence tomography (8).
To overcome the strong optical scattering in tissue, and to attain both deep imaging and high spatial resolution, the recently developed photoacoustic tomography (PAT) (9) and photoacoustic microscopy (PAM) (10, 11) combine optical excitation with a high-frequency ultrasonic detection. These fast emerging imaging modalities rely on linear absorption of the incident optical energy in tissue (12, 13). As the optical energy is absorbed, it results in a local temperature rise and thermoelastic expansion, which, in turn, generates ultrasound waves (referred to as photoacoustic waves). The photoacoustic (PA) waves are further detected by an ultrasonic transducer to form an image that is governed by the spatial distribution of the linear absorbers in tissue.
Since ultrasonic waves exhibit significantly lower scattering in tissue than optical waves, the inverse problem for acoustic waves is much easier to address. It has been demonstrated that PA imaging is possible at depths of several centimeters into tissue (12, 14). In practice, a typical PAT system uses a set of unfocused ultrasound detectors to acquire time-resolved PA signals at different positions around the sample, and the image is reconstructed by a back projection algorithm (11). A PAM system on the other hand, uses two-dimensional point-by-point raster scanning in combination with time-resolved ultrasonic detection and requires no reconstruction algorithm to obtain an image (9, 10).
In all the aforementioned applications of PA imaging, the acoustic wave is generated by a selective absorption of endogenous tissue pigments, such as melanin, hemoglobin, and, most recently, fat (15), or by artificially administered contrast agents (labels), such as colloidal nanoparticles (16) and proteins (13). However, without the external labeling, PA imaging relies on linear molecular absorption, which is characterized by broad featureless spectra with poor molecular specificity. To explore the full potential of PA imaging, it is essential to attain true chemical selectivity.
Chemical selectivity can be achieved by means of a spectroscopic method based on stimulated Raman PAs, which was first proposed in the later 1970s (17). In brief, when two laser pulses (pump, ωp and Stokes, ωS) excite the vibrational level of a molecule (see Fig. 1B), the energy of the excited state is then transferred into heat, generating a PA wave. Raman spectroscopy has long been considered for biological (18) and biomedical imaging (19). One of the shortcomings of Raman spectroscopy, its low quantum efficiency, has been successfully overcome by using its nonlinear optical analog, coherent anti-Stokes Raman scattering (CARS) microscopy, which has demonstrated its great potential for real-time microscopic imaging (20–23). However, CARS microscopy in some versions requires optical phase-matching and is hardly applicable for imaging objects hidden deeply inside tissue.
The requirement for phase-matching can be removed by utilizing stimulated Raman spectroscopy (24) and microscopy (25, 26); however, the signal detection scheme has to be substantially modified to allow for the image reconstruction in a highly scattered medium. As presented here, the powerful blend of stimulated Raman excitation and PA imaging comes into its own.
In the past 30 years, stimulated Raman PAs have been used for gas-phase analysis, where the detection limits of nonlinear Raman PAs are comparable to other nonlinear optical techniques (27, 28). For the condensed phase, Patel and Tam have anticipated the ability of Raman PAs to detect Raman gains as small as 10-5 cm-1 (29). A comprehensive analysis of the signal-to-noise ratio of the PA detection is given in ref. 30, which demonstrated that highly sensitive detection is possible.
These characteristics put stimulated Raman PAs on the same footing as traditional PAs, which rely on a linear optical absorption mechanism. However, there has been no attempt to apply Raman PAs to imaging, where such a modality has untapped potential for deep-tissue, chemically-specific, noninvasive imaging.
Results
To appraise the feasibility of such applications, the signal amplitude has to be evaluated under reasonable excitation conditions. To this end, we first estimate the amplitude of the PA signal induced by the stimulated Raman excitation and then calculate the corresponding magnitude of induced local heating. In our notation, the energy deposition via stimulated Raman excitation process involves a pump photon at frequency ωp which excites the system and a Stokes photon at frequency ωs which deexcites it leaving the total energy ℏ·(ωp - ωs) in the system. The excitation/deexcitation process typically happens on a very short time scale (i.e., before the energy is dissipated), and we can assume that the energy goes into local heating. This energy can be expressed (see, for example, ref. 31) as:
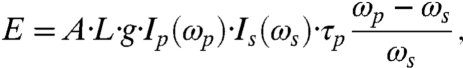 |
[1] |
where
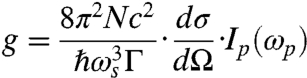 |
[2] |
is the Raman gain; A and L are the cross-section and the length of the irradiated object;  is the differential Raman cross-section for the excited transition; Γ is the line-width of this transition; N is the density of molecules in the selected object; Ip and Is are the incident intensities of the pump and Stokes beams, respectively; and τp is the pulse duration of the input pulses, which is assumed to be the same for both the pump and Stokes beam.
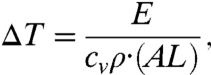
Assuming thermal balance and no energy dissipation (30), the energy in Eq. 1 will result in localized heating, which results in a temperature increase given by
 |
[3] |
where cv is the specific heat capacity, and ρ is the mass density of the object. The above assumptions will be fulfilled if both excitation pulses are rather short, i.e., less than 10 ns. Eqs. 1–3 provide the basis for estimating the temperature rise due to the stimulated Raman excitation, which can be rewritten as
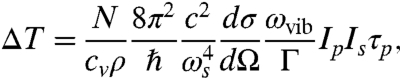 |
[4] |
where ωvib = ωp - ωs. We assume that the object under study is homogeneous and composed of molecules with a molar mass of M. Then 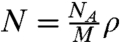 , where NA is Avogadro’s number, and writing Eq. 4 in terms of wavelength,
 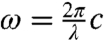 , we have
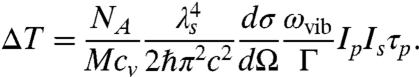 |
[5] |
As an example, let us consider chloroform molecules;
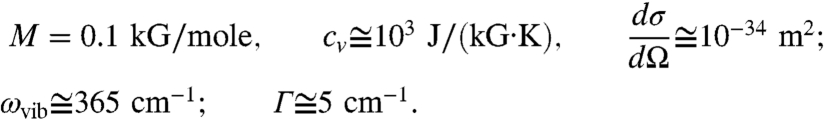 |
For the given excitation wavelength λs = 800 nm, we have
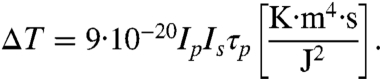 |
[6] |
Under a typical optical excitation condition (Ep,s = 2 μJ, Ip,s = 80 GW/cm2, and τp = 1 ps), we have: ΔT ≅ 0.06 °K, which is at least an order of magnitude larger than the detection limit for PA imaging [ΔT = mK (11)].
Clearly, to maximize PA signal one has to evaluate Eq. 5, selecting molecular transitions with the largest Raman cross-section and the narrowest line-width. Near-infrared excitation is not only beneficial for maximizing the PA signal amplitude (see Eq. 5), it allows us to use higher intensity pulses with much less cellular photodamage (32).
To achieve stimulated Raman excitation, narrow-band spectral components for pump and Stokes pulses were selected from the relatively broadband output of the Ti:sapphire laser system (Fig. 2). This selection was achieved by placing a double-slit assembly in the pulse compressor. Such an arrangement also ensured that both pulses coincide spatially and temporally. Typical output spectra of the amplifier, with, and without such spectral pulse shaping are shown in Fig. 3A.
Fig. 2.

Experimental set-up for stimulated Raman PA imaging. A double-slit assembly is placed inside the pulse compressor to select the appropriately spaced frequency components. This spectrally shaped output is directed and focused onto the sample placed into double distilled water, and the detected PA signal is collected via piezzo transducer, amplified, and displayed and analyzed by a digital oscilloscope.
Fig. 3.

(A) Lower: output spectrum from the amplified Ti:sapphire laser; upper: shaped spectrum resulting in a strong PA signal from chloroform; (B) lower: Raman spectrum of neat chloroform (spectral resolution 3 cm-1); upper: stimulated Raman PA excitation spectrum of neat chloroform (spectral resolution 50 cm-1 is determined by the excitation line-width and is shown as a horizontal error bar); (C) the amplitude of stimulated Raman PA signal as a function of the input power: circles—experiment, dashed line—quadratic dependence.
By changing the separation distance between the two slits, the frequency difference between the two excitation pulses was varied, and the PA signal was recorded as a function of such frequency difference. This spectrum is shown in Fig. 3B, where the recorded signal was normalized by the product of the incident powers of the two pulses. The stimulated Raman PA excitation spectrum was found to be in good agreement with the independently measured Raman spectrum of chloroform. The PA signal was reduced by at least two orders of magnitude when the liquid in a capillary tube was replaced with distilled water, and its spectral dependence and amplitude revealed a dramatic change when the capillary tube was filled with DMSO. These results clearly demonstrate the chemical specificity of the stimulated Raman PA signal.
To further confirm the nonlinear nature of the stimulated Raman PA signal, the input power was varied (by inserting neutral density filters), and the PA signal was measured as a function of the input power. This dependence is shown in Fig. 3C and can be nicely fit with a quadratic dependence, as predicted by theory. When one of the beams in a pulse compressor was blocked, the PA signal was reduced by more than an order of magnitude, and the residual signal showed a linear power dependence on the incident beam. This implies that a weak background PA signal is mostly due to the linear absorption of the incident irradiation by the sample.
Finally, the imaging capabilities of the stimulated Raman PA signal were demonstrated by scanning a capillary tube (internal diameter: 400 μm) filled with chloroform through the excitation volume. In doing so, the chloroform was excited at the 370 cm-1 peak of the stimulated Raman PA signal. When the capillary was scanned through the focal volume of the incident laser beam (with a step size of 100 μm in x-y plane), and perpendicular to the direction of the laser beam propagation, an image of the capillary tube was acquired. The recorded PA signal was plotted against the position of the tube as displayed in Fig. 4, where the borders of the capillary tube are clearly visible. The signal-to-background ratio was more than 100. At its peak, the PA signal reached the level of 60 mV, while it was not detectable (< 0.5 mV) outside the capillary tube. As little as 4 mW of average power (or 4 μJ per pulse) was used to obtain this image.
Fig. 4.

Stimulated Raman PA signal image, collected by scanning the capillary tube (about 400 μm in diameter) filled with neat chloroform in the plane perpendicular to the direction of the incident laser beam propagation. No digital background subtraction or image enhancement was performed.
Discussion
To make stimulated Raman PA a valuable tool for diagnostic biomedical imaging one has to overcome several potential hurdles. One possible reduction of PA signal is due to incident light scattering in tissues. To compensate for this effect one must increase the incident light intensity, which has its limits imposed by the laser safety regulations (33). An alternative approach is to split the laser excitation into several pulses and create a short delay between each pulse, thereby reducing laser peak intensity to levels below the safety limit. If the maximum delay between pulses in the excitation pulse train is less than the minimum of the stress relaxation time, which is defined as the smallest one of the time required for the acoustic wave to travel through the excitation volume, and the thermal relaxation time (11), the amplitudes of the PA waves will be added for all the pulses in a pulse train. For typical excitation geometry, the stress relaxation time is of the order of several nanoseconds. Given the pulse duration of the excitation radiation (several picoseconds), as many as 1,000 pulses can be used to effectively increase the amplitude of the excited PA wave. This approach is somewhat similar to the one which has been recently employed for multiphoton optical microscopy (34). To demonstrate the proof of principle of this approach for PA imaging, we used a series of three Michelson interferometers to construct a sequence of eight nearly identical picosecond laser pulses (see Fig. 5A) (35). We measured the amplitude of the PA wave as a function of the number of pulses by blocking one of the interferometers’ arms. The resultant PA signal shows a linear dependence on the number of the excitation pulses (Fig. 5B), which supports our hypothesis.
Fig. 5.

(A) A multiple-pulse sequence used for the excitation of PA waves; (B) the amplitude of the PA signal (filled circles—data points, solid line—a linear dependence to provide a guide to an eye) as a function of the number of the excitation pulses, illustrating the accumulative effect of multiple-pulse excitation. The total duration of a pulse train was about 850 ps, which is less than an estimated acoustic transient time, i.e., the time which is needed for acoustic wave to travel across the excitation volume.
The second obstacle to achieving PA imaging using a stimulated Raman contrast mechanism is the ordinary linear absorption either of the pump or the Stokes radiation. This linear absorption in the near-infrared region can be as high as 10 cm-1 (36), and can dominate the desired nonlinear optical absorption due to stimulated Raman excitation. To remove such background signal we can use the fact that stimulated Raman excitation requires simultaneous presence of both the pump and Stokes pulses at the same point in space. If we temporally delay one pulse with respect to another, both the optical signal showing the energy gain of the Stokes beam and the PA signal are reduced (Fig. 6). However, due to the residual linear absorption, the PA signal does not go to zero (see Fig. 6 B and C). By modulating the temporal delay between two beams, and by taking the difference of the PA signals at the positions of the maximum temporal overlap and the absence of temporal overlap of two pulses, we achieved suppression of the PA signal due to the linear absorption by more than two orders of magnitude. Fig. 6D illustrates the background reduction effect of this experimental methodology.
Fig. 6.

(A) The increase of the intensity of the Stokes beam as a function of the time delay between the pump and Stokes pulses; (B) the PA signal as a function of the time delay between the pump and Stokes pulses; (C) the same as (B), but the incident power of the beams is reduced by a factor of seven (the PA signal due to the simultaneous action of two pulses is almost invisible due to the linear absorption background); (D) the same as (C), but the signal is measured by taking the difference between the actual value at a given time delay and the PA signal taken at a large enough time delay, when there is no overlap between two pulses; (E) cross-correlation function of the pump and Stokes beam measured by the sum-frequency generation in a nonlinear crystal.
The above experiments demonstrate that stimulated Raman PA imaging with high signal-to-noise-ratio is possible using picosecond pulses for excitation. Given a very strong Raman cross-section for some of the major lipid and bone vibrations, such as symmetric CH2 stretch vibration at 2,845 cm-1 and phosphate vibration at 960 cm-1 (hydroxyapatite), it is anticipated that the unique imaging modality experimentally demonstrated here can be employed for deep-tissue visualization of molecular structures composed of those molecules. Potential applications include imaging and chemical analysis of microcalcifications preceding breast cancer (19), imaging of neuronal structures (37), and diagnosis of atherosclerosis (38) and bone demineralization (39). These studies will require a modified stimulated Raman PA imaging instrumentation to allow larger frequency separation between pump and probe beams, which is achievable given the moderate power requirement for efficient excitation. The addition of scattering does not present a problem for imaging because stimulated Raman excitation does not require phase-matching in the way that coherent anti-Stokes Raman scattering does. Thus, an image can be generated by detecting acoustic waves rather than by a tightly focusing of light radiation as used in dark-field PAM (9)
Materials and Methods
We have designed and conducted several experiments in which a femtosecond Ti:sappire oscillator/amplifier system (Spectra-Physics, Inc.) was used for stimulated Raman excitation. The output (average power: 450 mW; repetition rate: 1 kHz; center wavelength: 810 nm; FWHM bandwidth: 45 nm) was spectrally shaped and weakly focused onto the sample using a 25 cm focal length lens. The input energy was measured in front of the sample and was always kept well below that required for higher order nonlinear optical effects, such as optical breakdown, which typically occurred when the incident energy in each of the narrow-band beams exceeded 20 μJ. The focal spot in air was about 50 μm.
The sample was a borosilicate glass capillary tube filled with a liquid. The inner diameter was about 0.4 mm, while the wall thickness was about 100 μm to minimize the attenuation of acoustic waves. The tube was placed on a homemade mount, whose position could be independently controlled in all three dimensions with respect to the laser beam focus and the ultrasonic transducer (V317, OlympusNDT, Inc.; center frequency: 20 MHz, bandwidth: 70%), as shown in Fig. 2, and was immersed in a glass container filled with distilled water. The acoustic transducer was connected through a wide-band amplifier circuit to a digital oscilloscope (TDS 3052B, Tektronix Inc.), which displayed the temporal profile of the acoustic wave. In all the measurements described here, the maximum amplitude of the PA wave was used as a quantitative measure of the stimulated Raman excitation.
Chloroform was used as the primary target molecule. The Raman spectrum of chloroform (excitation wavelength λ = 532 nm) is shown in Fig. 3B in the spectral region of interest. Several other samples, such as capillary tubes filled with distilled water and DMSO were used to independently confirm that the detected PA signal was chemically specific.
Acknowledgments.
The authors thank Mr. Tan Liu, Mr. Jing Wang, and Dr. Georgi Petrov for assistance with experimental measurements. The authors acknowledge support of the National Institute of Health (NIH) (Grant R03EB008535), the National Science Foundation (NSF) (ECS Grant 0925950), the American Society for Engineering Education (ASEE) Fellowship from the Air Force Research Laboratory (AFRL) (to V.V.Y.). Also the Human Effectiveness Directorate, and the St. Mary’s University McNair Scholars Program for support of Mr. Corey Harbert in assistance with instrumentation. Support to M.L.D. and G.D.N. was in the form of AFRL Contract FA8650-08-D-6920. The authors thank the University of Wisconsin-Milwaukee start-up fund and the Shaw Scientist Award (to H.F.Z.).
Footnotes
The authors declare no conflict of interest.
References
- 1.Weisseleder R, Pittet MJ. Imaging in the era of molecular oncology. Nature. 2008;452:580–589. doi: 10.1038/nature06917. [DOI] [PMC free article] [PubMed] [Google Scholar]
- 2.Wild S, Roglic G, Green A, Sicree R, King H. Global prevalence of diabetes: estimates for 2000 and projections for 2030. Diabetes Care. 2004;27:1047–1053. doi: 10.2337/diacare.27.5.1047. [DOI] [PubMed] [Google Scholar]
- 3.Hell SW. Far-field optical nanoscopy. Science. 2007;316:1153–1158. doi: 10.1126/science.1137395. [DOI] [PubMed] [Google Scholar]
- 4.Weiss S. Fluorescence spectroscopy of single biomolecules. Science. 1999;283:1676–1683. doi: 10.1126/science.283.5408.1676. [DOI] [PubMed] [Google Scholar]
- 5.Ellis DI, Goodacre R. Metabolic fingerprinting in diseases diagnosis: biomedical applications of infrared and Raman spectroscopy. Analyst. 2006;131:875–885. doi: 10.1039/b602376m. [DOI] [PubMed] [Google Scholar]
- 6.Hanlon EB, et al. Prospects for in vivo Raman spectroscopy. Phys Med Biol. 2000;45:1–59. doi: 10.1088/0031-9155/45/2/201. [DOI] [PubMed] [Google Scholar]
- 7.Denk W, Strickler JH, Webb WW. Two-photon laser scanning fluorescence microscopy. Science. 1990;248:73–76. doi: 10.1126/science.2321027. [DOI] [PubMed] [Google Scholar]
- 8.Huang D, et al. Optical coherence tomography. Science. 1991;254:1178–1181. doi: 10.1126/science.1957169. [DOI] [PMC free article] [PubMed] [Google Scholar]
- 9.Zhang HF, Maslov K, Stoica G, Wang LV. Functional photoacoustic microscopy for high-resolution and noninvasive in vivo imaging. Nat Biotechnol. 2006;24:848–851. doi: 10.1038/nbt1220. [DOI] [PubMed] [Google Scholar]
- 10.Zhang HF, Maslov K, Wang LV. In vivo imaging of subcutaneous structures using functional photoacoustic microscopy. Nat Protoc. 2007;2:797–804. doi: 10.1038/nprot.2007.108. [DOI] [PubMed] [Google Scholar]
- 11.Wang LV. Tutorial on photoacoustic microscopy and computed tomography. IEEE J Sel Top Quant. 2008;14:171–179. [Google Scholar]
- 12.Wang LV. Multiscale photoacoustic microscopy and computed tomography. Nat Photonics. 2009;3:503–509. doi: 10.1038/nphoton.2009.157. [DOI] [PMC free article] [PubMed] [Google Scholar]
- 13.Razansky D, et al. Multispectral opto-acoustic tomography of deep-seated fluorescent proteins in vivo. Nat Photonics. 2009;3:412–417. [Google Scholar]
- 14.Song KH, Wang LV. Deep reflection-mode photoacoustic imaging of biological tissue. J Biomed Opt. 2007;12:060503. doi: 10.1117/1.2818045. [DOI] [PubMed] [Google Scholar]
- 15.Sethuraman S, Amirian JH, Litovsky SH, Smalling RW, Emelianov SY. Spectroscopic intravascular photoacoustic imaging to differentiate atherosclerotic plaques. Opt Express. 2008;16:3362–3367. doi: 10.1364/oe.16.003362. [DOI] [PubMed] [Google Scholar]
- 16.Copland JA, et al. Bioconjugated gold nanoparticles as a molecular contrast agent: implications for imaging of deep tumors using optoacoustic tomography. Mol Imaging Biol. 2004;6:341–349. doi: 10.1016/j.mibio.2004.06.002. [DOI] [PubMed] [Google Scholar]
- 17.Nechaev SY, Ponomarev YN. High resolution Raman spectrometer. Soviet Journal of Quantum Electronics. 1975;5:752–753. [Google Scholar]
- 18.Puppels GJ, et al. Studying single living cells and chromosomes by confocal Raman microspectroscopy. Nature. 1990;347:301–303. doi: 10.1038/347301a0. [DOI] [PubMed] [Google Scholar]
- 19.Haka AS, et al. Diagnosing breast cancer by using Raman spectroscopy. Proc Natl Acad Sci USA. 2005;102:12371–12376. doi: 10.1073/pnas.0501390102. [DOI] [PMC free article] [PubMed] [Google Scholar]
- 20.Potma EO, de Boeij WP, van Haastert PJM, Wiersma DA. Real-time visualization of intracellular hydrodynamics in single living cells. Proc Natl Acad Sci USA. 2001;98:1577–1582. doi: 10.1073/pnas.031575698. [DOI] [PMC free article] [PubMed] [Google Scholar]
- 21.Evans CL, et al. Chemical imaging of tissue in vivo with video-rate coherent anti-Stokes Raman scattering microscopy. Proc Natl Acad Sci USA. 2005;102:16807–16812. doi: 10.1073/pnas.0508282102. [DOI] [PMC free article] [PubMed] [Google Scholar]
- 22.Pestov D, et al. Optimizing the laser-pulse configuration for coherent Raman spectroscopy. Science. 2007;316:265–268. doi: 10.1126/science.1139055. [DOI] [PubMed] [Google Scholar]
- 23.Petrov GI, et al. Comparison of coherent and spontaneous Raman microspectroscopies for noninvasive detection of single bacterial endospores. Proc Natl Acad Sci USA. 2007;104:7776–7779. doi: 10.1073/pnas.0702107104. [DOI] [PMC free article] [PubMed] [Google Scholar]
- 24.Kukura P, McCamant DW, Mathies RA. Femtosecond stimulated Raman spectroscopy. Annu Rev Phys Chem. 2007;58:461–488. doi: 10.1146/annurev.physchem.58.032806.104456. [DOI] [PubMed] [Google Scholar]
- 25.Ploetz E, Laimgruber S, Berner S, Zinth W, Gilch P. Femtosecond stimulated Raman microscopy. Applied Physics B. 2007;87:389–393. [Google Scholar]
- 26.Freudiger CW, et al. Label-free biomedical imaging with high sensitivity by stimulated Raman scattering microscopy. Science. 2008;322:11857–11861. doi: 10.1126/science.1165758. [DOI] [PMC free article] [PubMed] [Google Scholar]
- 27.Schrotter HW, Berger H, Boquillon JP, Lavorel B, Millot G. High-resolution nonlinear Raman spectroscopy in gases. J Raman Spectrosc. 1990;21:781–789. [Google Scholar]
- 28.Rotger G, Lavorel B, Chaux R. High-resolution photoacoustic Raman spectroscopy of gases. J Raman Spectrosc. 1992;23:303–309. [Google Scholar]
- 29.Patel CKN, Tam AC. Pulsed optoacoustic spectroscopy of condensed matter. Rev Mod Phys. 1981;53:517–550. [Google Scholar]
- 30.Das KK, Rostovtsev YV, Lehmann K, Scully MO. Thermodynamic and noise considerations for the detection of microscopic particles in a gas by photoacoustic Raman spectroscopy. Opt Commun. 2005;246:551–559. [Google Scholar]
- 31.Yariv A. Quantum electronics. 2nd ed. New York: Wiley; 1975. Ch. 18. [Google Scholar]
- 32.Squirrel J, Wokosin D, White J, Bavister B. Long-term two-photon fluorescence imaging of mammalian embryos without compromising viability. Nat Biotechnol. 1999;17:762–763. doi: 10.1038/11698. [DOI] [PMC free article] [PubMed] [Google Scholar]
- 33.Barat K. Laser safety management. Boca Raton, Florida: CRC Press; 2006. [Google Scholar]
- 34.Ji N, Magee JC, Betzig E. High-speed, low-photodamage nonlinear imaging using passive pulse splitters. Nat Methods. 2008;5:197–202. doi: 10.1038/nmeth.1175. [DOI] [PubMed] [Google Scholar]
- 35.Liu T, Wang J, Petrov GI, Yakovlev VV, Zhang HF. Photoacoustic generation by multiple picoseconds pulse excitation. Med Phys. 2010;37:1518–1521. doi: 10.1118/1.3352666. [DOI] [PMC free article] [PubMed] [Google Scholar]
- 36.Troy TL, Thennadil SN. Optical properties of human skin in the near infrared wavelength range of 1,000 to 2,200 nm. J Biomed Opt. 2001;6:167–176.37. doi: 10.1117/1.1344191. [DOI] [PubMed] [Google Scholar]
- 37.Mizuno A, et al. Near-infrared FT-Raman spectra of the rat-brain tissues. Neurosci Lett. 1992;141:47–52. doi: 10.1016/0304-3940(92)90331-z. [DOI] [PubMed] [Google Scholar]
- 38.Sanz J, Fayad ZA. Imaging of atherosclerotic cardiovascular disease. Nature. 2008;451:953–957. doi: 10.1038/nature06803. [DOI] [PubMed] [Google Scholar]
- 39.Ohsaki K, et al. Demonstrations of de- and remineralization mechanism as revealed in synthetic auditory ossicle (Apaceram®) of rats by laser Raman spectrometry. Cell Mol Biol. 1995;41:1155–1167. [PubMed] [Google Scholar]