

Abstract
The systems controlling the number, size, and hemoglobin concentrations of populations of human red blood cells (RBCs), and their dysregulation in anemia, are poorly understood. After release from the bone marrow, RBCs undergo reduction in both volume and total hemoglobin content by an unknown mechanism [Lew VL, et al. (1995) Blood 86:334–341; Waugh RE, et al. (1992) Blood 79:1351–1358]; after ∼120 d, responding to an unknown trigger, they are removed. We used theory from statistical physics and data from the hospital clinical laboratory [d'Onofrio G, et al. (1995) Blood 85:818–823] to develop a master equation model for RBC maturation and clearance. The model accurately identifies patients with anemia and distinguishes thalassemia-trait anemia from iron-deficiency anemia. Strikingly, it also identifies many pre-anemic patients several weeks before anemia becomes clinically detectable. More generally we illustrate how clinical laboratory data can be used to develop and to test a dynamic model of human pathophysiology with potential clinical utility.
Keywords: hematology, mathematical modeling, medical sciences, stochastic differential equations, systems biology
In healthy human adults, ∼2.5 × 10¹¹ new red blood cells (RBCs) are released from the bone marrow into the peripheral circulation per day, and about the same number are cleared. The cells composing the circulating population are thus continuously changing, but in healthy individuals (and patients with mild disease) the characteristics of the population are very stable. In the clinic, population characteristics such as the volume fraction of cells in the blood (hematocrit), the average RBC volume (MCV), the coefficient of variation in RBC volume (RDW), and the mean intracellular hemoglobin mass (MCH) are routinely measured in complete blood counts (CBCs) (1). Recently, it has become possible to identify and characterize very young (hours or days old) circulating RBCs (reticulocytes) (2). RBCs undergo a rapid reduction in volume and hemoglobin in the few days after release from the bone marrow (3). This rapid phase is followed by a much longer period of slower reduction (4–7) during which volume and hemoglobin are coregulated (8) (Fig. 1A). A comparison of the probability distributions of reticulocytes and of all circulating RBCs (Fig. 1A) shows that the correlation between volume and hemoglobin content increases as the cells mature, from an initial correlation coefficient of ∼0.40 in the reticulocyte population to ∼0.85 in the full population. Thus, whereas many of the molecular mechanisms involved are unknown, it is clear that the average RBC matures in such a way that its hemoglobin concentration tends toward the population mean corpuscular hemoglobin concentration (MCHC), shown as an iso-concentration line in Fig. 1 A and B: the variation in hemoglobin concentration is lower than that for volume and hemoglobin content (8).
Fig. 1.

Empirical measurement (A) and dynamic model (B) of coregulation of volume and hemoglobin of an average RBC in the peripheral circulation. The reticulocyte distribution is shown as blue iso-probability density contours and the population of all RBCs as red. The diagonal line projecting to the origin in A and B represents the average intracellular hemoglobin concentration (MCHC) in the population. An RBC located anywhere on this line will have an intracellular hemoglobin concentration equal to the MCHC. Fast dynamics (β) first reduce volume and hemoglobin for the typical large immature reticulocytes shown in the upper right of A and B. Slow dynamics (α) then reduce volume and hemoglobin along the MCHC line. Because biological processes are inherently noisy, we suggest that small random variations during the events required for reduction of volume and hemoglobin cause individual cellular hemoglobin concentrations to drift about the MCHC line, fluctuating with magnitude (D) around the MCHC line as shown in the Inset in B until reaching a critical volume (vc in B) when cells are removed.
Results
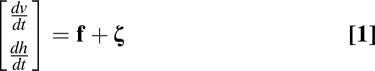
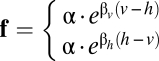
The volume and hemoglobin regulation of an individual RBC in vivo during the course of its lifetime is extremely complex and difficult to understand. Understanding the average behavior of a large population of RBCs may be more tractable. To gain insight into this population-level behavior, we developed a model of RBC maturation and clearance that describes the dynamics of an RBC population. Our model applies only to the typical behavior of RBCs in healthy individuals or those with mild anemia and may not apply to RBCs in more severe disease or even to extreme behavior of RBCs in healthy individuals. Our model decomposes the volume (v) and hemoglobin (h) dynamics of an average RBC over time (t) into deterministic reductions (f) and random fluctuations (ζ) as shown in Eq. 1, where v and h are scaled by their population means  , and t is scaled by the average cell age
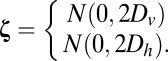
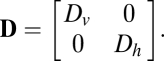
  . On the basis of data from prior reports (3–5, 7), we introduced two parameters into the deterministic component: a fast change (β), whose effect dominates until the RBC is close to the MCHC line, and a slow change (α). The random fluctuation is modeled as a Gaussian random variable with mean zero and variance given by a diffusion tensor 2D, as shown in Fig. 1B and Eq. 1:
 |
 |
 |
As with inverse problems in general and human pathophysiology in particular (9), this problem is ill posed in the sense that similar in vivo dynamics can result from different functional forms of f. We find that the precise functional form of f is less important to the behavior of this model than the qualitative combination of fast and slow deterministic dynamics and random fluctuations. See SI Text (Functional Forms, Figs. S1–S4, and Table S1) for details.
In our model, the random fluctuation and deterministic dissipation or reduction of volume and hemoglobin content for a typical individual cell are described by a Langevin equation, commonly used to model Brownian motion in a potential (10). The dynamics of the entire circulating population of RBCs may then be described by a master equation for the time-dependent joint volume–hemoglobin probability distribution ( ) which can be approximated by a Fokker–Planck equation (10, 11). Eq. 2 describes the drift (f), diffusion (D), birth (b), and death (d) of probability density for this joint volume–hemoglobin distribution:
 |
 |
The birth and death processes account for the RBCs that are constantly added to and removed from the population. In states of health and mild illness, the total number of cells added equals the total number removed:  . The precise trigger and mechanism for RBC removal are not fully understood (12), but empirical measurements such as those shown in Fig. 1A suggest that there is a threshold (
 ) along the MCHC line beyond which most RBCs have been cleared. See Clearance Function in Materials and Methods for details. CBC measurements vary from person to person but do not change significantly for a healthy individual (13), indicating that these dynamic processes reach a steady state in vivo,
  , where
  . See Movie S1 for an example of a numerical solution to Eq. 2. With appropriate choice of parameters (α, β, D, and vc), our model faithfully reproduces the observed distribution of RBC populations in healthy individuals. See Movie S2 for a comparison of a fitted and an observed distribution.
To test whether the model can distinguish the dynamics of RBC populations in healthy individuals from those in anemic individuals, we obtained CBC and reticulocyte measurements for individuals with three common forms of anemia with different underlying etiologies: anemia of chronic disease (ACD), an inflammatory condition; thalassemia trait (TT), a genetic disorder; and iron deficiency anemia (IDA), a nutritional condition (14). We selected mild cases of each anemia where RBC population characteristics appeared stable and a quasi-steady-state assumption was reasonable; we also selected several apparently healthy controls. See Blood Samples in Materials and Methods for details on sample collection, data collection, and diagnosis. For each patient sample, we identified an optimal parameter set (α, β, D, and  ) that reproduces the steady state observed for that patient. We used a least-squares fit between the simulated steady-state distribution and the measured CBC distribution to identify the best fit. Where repeat tests were available for the same individual, we found that any variation in fitted parameters was explained by analytic variation in the CBC measurement. See Parameter Fits in Materials and Methods and Movie S2 for details. Fitted parameters for healthy and anemic individuals are shown in Fig. 2 and median fitted parameters are listed in Table 1.
Fig. 2.

Boxplots of model parameters for 20 healthy individuals and patients with three forms of mild anemia: 11 with anemia of chronic disease (ACD), 33 with thalassemia trait (TT), and 27 with iron deficiency anemia (IDA). The upper and lower edges of each box are located at the 75th and 25th percentiles. The median is indicated by a horizontal red line. Vertical lines extend to data points whose distance from the box is <1.5 times the interquartile distance. More extreme data points are shown as red plus (+) symbols. The fast dynamics are characterized by β, the slow by α, random fluctuations by D, and the clearance threshold by  .
.
Table 1.
Median values of nondimensional and dimensional fitted parameters (where appropriate)
| Normal | ACD | TT | IDA | |
| βv | 26 | 27 | 14 | 15 |
| βh | 16 | 15 | 5 | 12 |
| α | 0.05 (0.09 fL/d and 0.03 pg/d) | 0.05 (0.09 fL/d and 0.03 pg/d) | 0.13 (0.20 fL/d and 0.07 pg/d) | 0.13 (0.20 fL/d and 0.07 pg/d) |
| Dv | 0.014 (2.3 fL2/d) | 0.015 (2.4 fL2/d) | 0.017 (2.2 fL2/d) | 0.013 (1.7 fL2/d) |
| Dh | 0.0014 (0.025 pg2/d) | 2.7 × 10⁻⁵ (4.9 × 10⁻⁴ pg2/d) | 2.7 × 10⁻¹⁵ (3.6 × 10⁻¹⁴ pg2/d) | 0.019 (0.34 pg2/d) |
| vc | 0.80 (72 fL) | 0.80 (72 fL) | 0.74 (59 fL) | 0.71 (56 fL) |
We find clear differences between the best-fit parameters derived for healthy individuals and those with anemia, and we also find that the different anemic conditions have different characteristic parameter sets. For example, healthy individuals and ACD patients have high βv and βh and low α; i.e., they lose relatively more of their volume and hemoglobin during the fast phase than they do during the slow phase. In contrast, patients with TT and IDA lose relatively more volume and hemoglobin during the slow phase than in the fast phase. Patients with ACD show slightly elevated Dv and slightly reduced Dh relative to healthy individuals, whereas TT is associated with a larger increase in Dv along with a substantially reduced Dh. IDA patients have a Dv similar to that of healthy individuals and show dramatic elevation in Dh with most individuals >10 times higher than normal. The normalized critical volume,  , in healthy individuals and those with ACD is ≈80% of
  , or ∼72 fL. Most patients with TT or IDA typically have a reduced
  and reduced
  . Fig. 2 shows that in addition to absolute reductions in
  and
and  , the
, the  for these patients is further reduced and shows much greater variability across different individuals.
Discussion
These parameters show that RBCs in patients with TT and IDA remain in the periphery with much smaller volumes and lower hemoglobin contents, in both absolute and relative terms, than they would under normal conditions. Their persistence may reflect a compensatory delay in clearance in response to the less efficient erythropoiesis of these anemias. Thus, mechanisms must exist that can alter the behavior of the trigger for RBC clearance. Comparing RBC clearance in TT and IDA with that of healthy individuals or ACD patients may provide a route to identifying the trigger. The variation in  is much smaller than the variation in
  for healthy individuals (14), suggesting that the trigger is highly correlated with position on the MCHC line.
Our model offers a potential way to identify patients with latent or compensated IDA before it leads to clinical anemia, by looking for signs of clearance delay. We tested this possibility in an independent set of patients who had normal CBCs followed at least 30 and no more than 90 d later by either another normal CBC or clinical IDA. For each patient sample, we projected the (v, h) coordinates of all cells onto the MCHC line and integrated the probability density along this line below 85% of the mean (P0.85). Fig. 3 A–C shows the evolution of one patient's CBC from normal to latent IDA and ultimately to IDA. The CBC shown in Fig. 3B was clinically unremarkable, but the P0.85 was abnormal, predicting anemia that did not come to medical attention for 51 d. Fig. 3D shows values of P0.85 for 20 normal CBCs from patients who remained healthy and 20 normal CBCs from those who developed IDA between 30 and 90 d later. The value of P0.85 predicted IDA with a sensitivity of 75% and a specificity of 100%. See Predicting Iron Deficiency Anemia in Materials and Methods for details. Common existing approaches have a sensitivity of 0% because all CBCs were “normal.” This model-based prediction relies on only a single CBC measurement at one point in time, in contrast to statistical regression approaches that often rely on the integration of multiple measurements and types of information from different sources and different time points (15). IDA is often the initial presentation in serious conditions such as colon cancer (16) and childhood malnutrition (17). Earlier detection of IDA via this method would enable a faster response to such conditions. If a reduced  represents an adaptive physiologic response to offset the anemia, then perhaps one would expect the normal
  seen here for ACD, where the anemia itself may represent an adaptive physiologic response (18).
Fig. 3.

Contour plots (A–C) of CBCs for a patient developing IDA after 4 mo. Each plot shows contours enclosing 35, 60, 75, and 85% of the probability density. The dashed line from the origin represents the MCHC. The short solid line perpendicular to the dashed line marks the position along the line corresponding to 85% of the mean projected cell. The circle shows the mean projection. A shows a normal CBC measured 116 d before the patient's presentation with iron deficiency anemia. The calculated P0.85 (red area) is normal. B shows the normal CBC measured 65 d later and 51 d before detection of iron deficiency anemia. P0.85 is abnormal even though the CBC is normal. C shows the CBC at the time IDA was diagnosed. D shows boxplots of P0.85 for 20 normal CBCs from patients with a second normal CBC within 90 d and 20 normal CBCs from patients who were diagnosed with IDA up to 90 d later. P0.85 successfully predicts IDA up to 90 d earlier than is currently possible with a sensitivity of 75% and a specificity of 100%. See main text and Predicting Iron Deficiency Anemia in Materials and Methods for more detail.
Fig. 2 shows that Dh differentiates IDA and TT, the two most common causes of microcytic anemia. TT is one of the most commonly screened conditions in the world, but existing diagnostic methods either are too expensive or have unacceptably low diagnostic accuracy, with false positive rates of up to 30% (19, 20). Our model provides a possibly more accurate way to distinguish these conditions. We first established a threshold value for Dh of 0.0045 by analyzing 10 training samples. We then analyzed 50 independent patient samples where diagnosis of either mild IDA or TT could be confidently established and calculated Dh. Fig. 4 shows that this Dh threshold had a diagnostic accuracy of 98%, correctly identifying 22/22 cases of IDA and 27/28 cases of TT and outperforming other published approaches by between 6% and 41% (20). See Diagnosis of Microcytic Anemia in Materials and Methods for details.
Fig. 4.

Differentiating TT and IDA as causes of microcytic anemia. This boxplot shows the distributions of Dh for 5 training cases with TT, 5 training cases with IDA, 28 test cases with TT, and 22 test cases with IDA.
Our mathematical model, although simple in concept, captures important features of the complex pathophysiology of circulating RBCs and allows us to identify quantitative differences in the dynamics of health and disease, using readily available clinical measurements. This model also provides a useful framework for thinking about the dynamical processes governing physiological homeostasis and shows how an understanding of these dynamics motivates diagnostic tests and generates pathophysiological hypotheses.
Materials and Methods
Blood Samples.
Blood samples and CBC results were obtained from the clinical laboratory of a tertiary care adult hospital under a research protocol approved by the Partners Healthcare Institutional Review Board. Reticulocyte and CBC measurements were made within 6 h of collection (21) on a Siemens Advia 2120 automated hemanalyzer.
IDA was defined as mild reduction in hematocrit to no more than 20% below the lower limit of normal, low MCV, low ferritin, and historical evidence of normal MCV with normal hematocrit. Patients with acute illness, acute bleeding, transfusion in the prior 6 mo, concurrent hospitalization, chronic inflammatory illness, or hemoglobinopathy were excluded.
TT was defined as either a high hemoglobin A2 or heterozygosity for the presence of an α-globin gene mutation, as well as a reduction in hematocrit to no more than 20% below the lower limit of normal, low MCV, and normal ferritin. Patients with acute illness, acute bleeding, transfusion in the prior 6 mo, concurrent hospitalization, chronic inflammatory illness, or additional hemoglobinopathy were excluded.
ACD was defined as a reduction in hematocrit to no more than 20% below the lower limit of normal, normal or high ferritin, and a low or normal total iron binding capacity. Patients with acute illness, acute bleeding, transfusion in the prior 6 mo, concurrent hospitalization, or hemoglobinopathy were excluded.
Clearance Function.
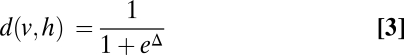
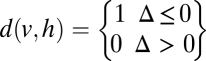
On the basis of observations of empirical RBC distributions, we model probability of RBC clearance as a function of the RBC volume and hemoglobin content. Each RBC's position in the volume–hemoglobin content plane is projected onto the MCHC line, and the probability of clearance (d) is defined as either a sigmoid or a step function of the distance from this projected point to a threshold,  , on this line (Figs. 1 and 5; Fig. S2). Eq. 3 quantifies this relationship:
Fig. 5.

Schematic of the projected distance (Δ) used to calculate the probability of clearance as described in Eq. 3. The cell is projected onto the MCHC line, and the probability of clearance is a function of the distance from the projected point to a threshold ( ) along this line.
 |
or
 |
 |
 |
Description of Simulation and Explicit Numerical Solution.
For a given set of parameters, Eq. 2 was solved numerically using a finite difference approximation for first-order  and second-order
  spatial derivatives with boundary conditions of vanishing probability at volumes and hemoglobin contents outside the pathophysiological range and initial conditions equal to the empirically measured reticulocyte distribution. The volume–hemoglobin content plane was discretized with a constant mesh width and represented as a vector (P) of variables equal to the probability density in each mesh cell. Simulation results reported here were executed with a mesh width of 1.8 fL along the volume axis and 1.8 pg along the hemoglobin content axis. This mesh width was comparable to the analytic resolution of the empirical volume and hemoglobin content measurements. All results were confirmed using a smaller mesh width (1.2 fL and 1.2 pg). The convection contribution (f) was modeled numerically using an upwind finite difference approximation of the spatial derivative. The resulting linear system of ordinary differential equations was integrated using the MATLAB ode15s integrator and iterated until a steady state (P∞) was reached.
The steady-state distribution for the numerical problem (P∞) was also determined analytically by noting that the numerical approximations of the evolution (J + L) and clearance (d) terms are linear operators and that the integral scaling the birth process is a constant equal to the reciprocal of twice the mean age  . The linear operators can be inverted, yielding a family of steady-state distributions indexed by the mean cell age, as show in Eq. 4:
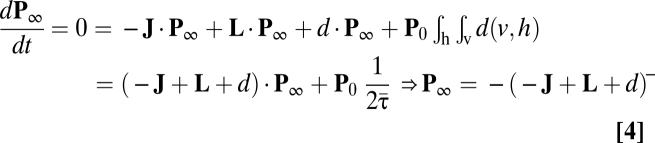 |
We found negligible differences between the steady-state distributions obtained by each approach.
Parameter Fits.
We identified optimal neighborhoods in parameter space for each patient, using gradient and nongradient optimization methods. We started with a patient's empirically measured reticulocyte distribution and an initial randomly chosen parameter set. We calculated the resulting steady-state RBC distribution using Eq. 4. This calculated distribution (P∞) was then compared with the empirical distribution (PCBC). The quality of the parameter estimates was quantified by computing an objective function equal to the sum of the normalized squared residuals for the discretized distributions, as shown in Eq. 5, where i and j represent indices of cells in the discretized volume–hemoglobin plane:
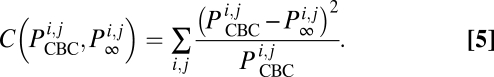 |
New parameter values were then chosen to reduce this objective function. We used gradient-based (lsqnonlin function) and non-gradient-based (fminsearch and patternsearch functions) optimization algorithms in MATLAB to search for optimal parameters. We constrained all parameters to be nonnegative and defined a uniform initial parameter space to exclude mean cell ages >1,000 or <5 d. We then picked initial parameters from this space, using latin hypersquare sampling. We imposed one optimization constraint, limiting α to be small enough that the mean cell age would be >5 d and large enough that the mean cell age would <1,000 d. Fig. 6 shows that the model provides a faithful reproduction of PCBC for this healthy patient by comparing the simulated and measured steady-state probability distributions. When projected along the MCHC line, the empirical distribution for this patient has slightly higher density near the mode and slightly lower density in the regions to either side of the mode. See Movie S2 for more detail.
Fig. 6.

Comparison of fitted (red) and empirical (blue) steady-state joint volume–hemoglobin content probability distributions for a healthy individual. (Upper) The view projected on a vertical plane through the MCHC line (Fig. 1). (Lower) Ninety degree rotated view looking toward the origin.
Fig. 7 shows the smallest local minima for parameters obtained from >200 optimizations for a single patient. Some results had local minima above the range of the axes. The best fits among all simulations form a small neighborhood of values for all parameters, demonstrating that the parameter estimation process reached a well-defined optimal neighborhood for this patient's blood sample.
Fig. 7.

Histograms of optimized parameter values from >200 separate simulations and the goodness of fit as determined by a sum of squared residuals objective function. Smaller values of the objective function signify a better fit. All parameters have well-defined optimal neighborhoods. See Eq. 5 for objective function.
Predicting Iron Deficiency Anemia.
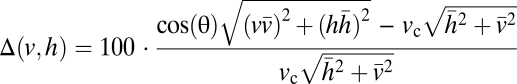
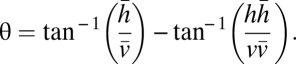
We tested the hypothesis that compensated or latent IDA can be predicted up to 90 d earlier than is currently possible on the basis of an expanding population of cells that project along the MCHC line closer to the origin than the mean. The projection operation is pictured in Fig. 5. We first determined the projected position (u) of each cell with volume (v) and hemoglobin (h) along the MCHC line:
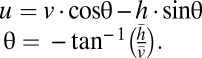 |
We then calculated the fraction of projected cells located between the origin and 85% of  , where fMCHC is the probability density of the projected cells as a function of location on the MCHC line:
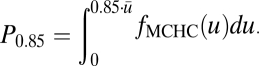 |
The 85% threshold was chosen by comparing the discrimination efficiency of different thresholds for the steady-state CBCs used in Fig. 2. The 85% threshold shown in Fig. 8 provided the greatest separation when compared with other thresholds (70, 75, 80 90, and 100%). We selected a threshold value for P0.85 of 0.121 on the basis of this training set.
Fig. 8.

Identifying a threshold for latent IDA. This boxplot shows the distributions of P0.85 for the steady-state healthy and IDA patients shown in Fig. 2. On the basis of these results, we picked a threshold value for P0.85 of 0.121 to use in a test of an independent set of patients shown in Fig. 3.
We then identified 40 new and independent patient CBCs, all of which were normal. Twenty of these normal CBCs came from individuals who had additional normal CBCs 30–90 d later, and 20 of these normal CBCs came from individuals who presented with IDA no more than 90 d later. Patients with acute bleeding or any iron supplementation between the two CBCs were excluded. See Blood Samples in this section for definition of IDA. Fig. 3 shows that the threshold of 0.121 for P0.85 is able to predict IDA with a sensitivity of 75% and a specificity of 100% in this independent test group.
Diagnosis of Microcytic Anemia.
To assess the diagnostic accuracy of Dh in differentiating the two most common causes of microcytic anemia, we fit parameters for 10 training cases: 5 with IDA and 5 with TT, as shown in Fig. 4. See Blood Samples for case definitions. The TT training set had Dh ranging from 1.7 × 10⁻¹⁵ to 2.3 × 10⁻¹⁵. The IDA training set had Dh ranging from 0.009 to 0.043. We picked a threshold value equal to 0.0045, the average of the lowest Dh among the IDA training set and the highest of the TT training set. We then identified 50 new and independent cases, 22 with IDA and 28 with TT. All 22 IDA cases were correctly classified, and 27/28 TT cases were correctly classified for an overall diagnostic accuracy of 98%. We find this accuracy to be superior to that of four commonly cited discriminant functions (20): The Green and King formula yielded an accuracy of 92%; Micro/Hypo, 84%; Mentzer, 68%; and England and Fraser, 57%. See ref. 20 for further details on these other discriminant functions.
Supplementary Material
Acknowledgments
We thank Alicia Soriano, Svetal Patel, Rosy Jaromin, Hasmukh Patel, David Dorfman, Paul Charest, the Harvard Crimson Tissue Bank, and the Partners Research Patient Data Repository for help acquiring samples and data. We thank Ricardo Paxson, Madhusudhan Venkadesan, and Shreyas Mandre for useful suggestions on the analysis; Frank Bunn, Carlo Brugnara, and Steve Sloan for helpful discussions regarding the findings; and Rebecca Ward for critical reading of the manuscript. The simulations in this paper were primarily run on the Orchestra cluster supported by the Harvard Medical School Research Information Technology Group. J.M.H. acknowledges support from National Institute of Diabetes and Digestive and Kidney Diseases Grant DK083242. L.M. acknowledges support from National Heart, Lung, and Blood Institute Grant HL091331.
Footnotes
Conflict of interest statement: J.M.H. and L.M. are listed as inventors on a patent application related to this manuscript submitted by their institutions.
This article is a PNAS Direct Submission.
This article contains supporting information online at www.pnas.org/lookup/suppl/doi:10.1073/pnas.1012747107/-/DCSupplemental.
References
- 1.Fauci AS. In: Harrison's Principles of Internal Medicine. 17th Ed. Fauci AS, et al., editors. New York: McGraw–Hill Medical; 2008. [Google Scholar]
- 2.d'Onofrio G, et al. Simultaneous measurement of reticulocyte and red blood cell indices in healthy subjects and patients with microcytic and macrocytic anemia. Blood. 1995;85:818–823. [PubMed] [Google Scholar]
- 3.Gifford SC, Derganc J, Shevkoplyas SS, Yoshida T, Bitensky MW. A detailed study of time-dependent changes in human red blood cells: From reticulocyte maturation to erythrocyte senescence. Br J Haematol. 2006;135:395–404. doi: 10.1111/j.1365-2141.2006.06279.x. [DOI] [PubMed] [Google Scholar]
- 4.Waugh RE, et al. Rheologic properties of senescent erythrocytes: Loss of surface area and volume with red blood cell age. Blood. 1992;79:1351–1358. [PubMed] [Google Scholar]
- 5.Willekens FL, et al. Hemoglobin loss from erythrocytes in vivo results from spleen-facilitated vesiculation. Blood. 2003;101:747–751. doi: 10.1182/blood-2002-02-0500. [DOI] [PubMed] [Google Scholar]
- 6.Sens P, Gov N. Force balance and membrane shedding at the red-blood-cell surface. Phys Rev Lett. 2007;98:018102. doi: 10.1103/PhysRevLett.98.018102. [DOI] [PubMed] [Google Scholar]
- 7.Willekens FL, et al. Liver Kupffer cells rapidly remove red blood cell-derived vesicles from the circulation by scavenger receptors. Blood. 2005;105:2141–2145. doi: 10.1182/blood-2004-04-1578. [DOI] [PubMed] [Google Scholar]
- 8.Lew VL, Raftos JE, Sorette M, Bookchin RM, Mohandas N. Generation of normal human red cell volume, hemoglobin content, and membrane area distributions by “birth” or regulation? Blood. 1995;86:334–341. [PubMed] [Google Scholar]
- 9.Zenker S, Rubin J, Clermont G. From inverse problems in mathematical physiology to quantitative differential diagnoses. PLoS Comput Biol. 2007;3:e204. doi: 10.1371/journal.pcbi.0030204. [DOI] [PMC free article] [PubMed] [Google Scholar]
- 10.Zwanzig R. Nonequilibrium Statistical Mechanics. Oxford, UK: Oxford University Press; 2001. [Google Scholar]
- 11.Kampen NGv . Stochastic Processes in Physics and Chemistry. Amsterdam: North-Holland; 1992. [Google Scholar]
- 12.Lang KS, et al. Mechanisms of suicidal erythrocyte death. Cell Physiol Biochem. 2005;15:195–202. doi: 10.1159/000086406. [DOI] [PubMed] [Google Scholar]
- 13.Garner C, et al. Genetic influences on F cells and other hematologic variables: A twin heritability study. Blood. 2000;95:342–346. [PubMed] [Google Scholar]
- 14.Robbins SL, Kumar V, Cotran RS. Robbins and Cotran Pathologic Basis of Disease. 8th Ed. Philadelphia: Saunders/Elsevier; 2010. [Google Scholar]
- 15.Milbrandt EB, et al. Predicting late anemia in critical illness. Crit Care. 2006;10:R39. doi: 10.1186/cc4847. [DOI] [PMC free article] [PubMed] [Google Scholar]
- 16.Rockey DC, Cello JP. Evaluation of the gastrointestinal tract in patients with iron-deficiency anemia. N Engl J Med. 1993;329:1691–1695. doi: 10.1056/NEJM199312023292303. [DOI] [PubMed] [Google Scholar]
- 17.Lozoff B, Jimenez E, Wolf AW. Long-term developmental outcome of infants with iron deficiency. N Engl J Med. 1991;325:687–694. doi: 10.1056/NEJM199109053251004. [DOI] [PubMed] [Google Scholar]
- 18.Zarychanski R, Houston DS. Anemia of chronic disease: A harmful disorder or an adaptive, beneficial response? CMAJ. 2008;179:333–337. doi: 10.1503/cmaj.071131. [DOI] [PMC free article] [PubMed] [Google Scholar]
- 19.Jopang YP, Thinkhamrop B, Puangpruk R, Netnee P. False positive rates of thalassemia screening in rural clinical setting: 10-year experience in Thailand. Southeast Asian J Trop Med Public Health. 2009;40:576–580. [PubMed] [Google Scholar]
- 20.Ntaios G, et al. Discrimination indices as screening tests for beta-thalassemic trait. Ann Hematol. 2007;86:487–491. doi: 10.1007/s00277-007-0302-x. [DOI] [PubMed] [Google Scholar]
- 21.Lippi G, Salvagno GL, Solero GP, Franchini M, Guidi GC. Stability of blood cell counts, hematologic parameters and reticulocytes indexes on the Advia A120 hematologic analyzer. J Lab Clin Med. 2005;146:333–340. doi: 10.1016/j.lab.2005.08.004. [DOI] [PubMed] [Google Scholar]
Associated Data
This section collects any data citations, data availability statements, or supplementary materials included in this article.