

Abstract
The role of genetics in driving intracortical relationships is an important question that has rarely been studied in humans. In particular, there are no extant high-resolution imaging studies on genetic covariance. In this article, we describe a novel method that combines classical quantitative genetic methodologies for variance decomposition with recently-developed semi-multivariate algorithms for high-resolution measurement of phenotypic covariance. Using these tools, we produced correlational maps of genetic and environmental (i.e. nongenetic) relationships between several regions of interest and the cortical surface in a large pediatric sample of 600 twins, siblings, and singletons. These analyses demonstrated high, fairly uniform, statistically significant genetic correlations between the entire cortex and global mean cortical thickness. In agreement with prior reports on phenotypic covariance using similar methods, we found mean cortical thickness was most strongly correlated with association cortices. However, the present study suggests that genetics plays a large role in global brain patterning of cortical thickness in this manner. Further, using specific gyri with known high heritabilities as seed regions, we found a consistent pattern of high bilateral genetic correlations between structural homologues, with environmental correlations more restricted to the same hemisphere as the seed region, suggesting that interhemispheric covariance is largely genetically mediated. These findings are consistent with the limited existing knowledge on the genetics of cortical variability as well as our prior multivariate studies on cortical gyri.
Introduction
The development of non-invasive technologies for the acquisition of neuroanatomic information has revolutionized our ability to study human brain structure in vivo. Over the last several decades, magnetic resonance imaging (MRI) in particular has greatly expanded our understanding of the neural substrates of many psychiatric and neurological diseases, neurogenetic syndromes, typical human neurodevelopment, and aging. But with a few notable exceptions (e.g. Lerch et al., 2006; Worsley et al., 2005), the vast majority of the work on anatomic MRI to date has been univariate. The interrelationships between different regions are fundamentally important, however, given the compartmentalization of essential neural functions and the formation of complex neural networks. Many neuroanatomic circuits, such as the limbic system, perceptual and motor systems, and networks involved in higher cognition, language, and mood might be expected to result in morphological correlations between related regions. In addition to simply knowing which regions are associated, knowing what forces drive these observed correlations in brain structure also is of great neurodevelopmental interest; are associations between cortical regions generated via shared genetic factors, or rather environmental (i.e. nongenetic) effects that similarly influence different neuroanatomic structures?
Many research modalities such as axon tracing studies, diffusion tensor imaging, positron emission tomography, and functional magnetic resonance imaging have actively pursued methods on generating maps of neuroanatomic interrelatedness (Ramnani et al., 2004). Multivariate analyses in high-resolution structural data are particularly challenging, however, given the extremely large number of voxels and subsequent immense computational requirements (the so-called “curse of dimensionality”) for traditional multivariate approaches. Recently, semi-multivariate methods for high-resolution mapping of cortical correlations have been proposed that provide a work around to the problem of multidimensionality, by calculating correlations between all voxels and a target region of interest (ROI) (Lerch et al., 2006; Worsley et al., 2005). These semi-multivariate approaches, in particular, are easily integrated into quantitative genetic analyses.
In this article, we describe a statistical genetic extension to these maps of neuroanatomic relatedness. Using a similar global strategy, we use structural equation modeling (SEM) to determine which regions are structurally related and to assess the relative contribution of genetic or nongenetic factors to these relationships.
Methods
Subjects
Subjects were recruited as part of an ongoing longitudinal study of pediatric brain development at the Child Psychiatry branch of the National Institutes of Mental Health (NIMH). Recruitment was performed via local and national advertisements and participants were screened via an initial telephone interview, parent and teacher rating versions of the Child Behavior Checklist (Achenbach and Ruffle, 2000), and physical and neurological assessment. Exclusion criteria included psychiatric diagnosis in the subject or a first degree relative, and head injury or other conditions that might have affected gross brain development. Twin zygosity was determined by DNA analysis of buccal cheek swabs using 9–21 unlinked short tandem repeat loci for a minimum certainty of 99%, by BRT Laboratories, Inc. (Baltimore, MD). Twins were included in the analysis only if quantifiable MRI scans free from motion or other artifact were obtained on both twins at the same age. Written assent from the child and written consent from a parent were obtained for all participants. The study protocol was approved by the institutional review board of the NIMH.
The resultant sample consisted of 600 children (mean age 11.1, SD 3.4, range 5.4–18.7), including 214 MZ and 94 DZ twins reared together, 64 singleton siblings of twins (1–2 per family), 116 members of entirely singleton families (2–5 members per family), and 112 unrelated singletons. The distribution of subjects and basic demographic information are given in Table 1. [Table 1 about here]
Table 1.
Demographic characteristics of the sample and mean cortical thickness measures.
| MZ twins | DZ twins | Sibs of twins | Singletonsa | Total Sample | |
|---|---|---|---|---|---|
| N (% of total) | 214 (35.7) | 94 (15.7) | 64 (10.7) | 228 (38.0) | 600 |
| Age (years) | |||||
| Mean (SD): | 11.03 (3.16) | 11.20 (3.80) | 11.62 (3.53) | 10.92 (3.48) | 11.08 (3.43) |
| Range: | 5.37–18.72 | 5.55–19.34 | 4.99–19.11 | 5.16–18.88 | 4.99–19.34 |
| Sex (% of subsample) | |||||
| Male | 117 (55) | 53 (56) | 31 (48) | 132 (58) | 332 (55) |
| Female | 97 (45) | 41 (44) | 33 (52) | 96 (42) | 268 (45) |
| Race (%of subsample) | |||||
| Caucasian | 202 (94) | 92 (98) | 63 (98) | 172 (75) | 529 (88) |
| African-American | 6 (3) | 0 (0) | 0 (0) | 36 (16) | 42 (7) |
| Asian-American | 2 (<1) | 0 (0) | 0 (0) | 8 (4) | 10 (2) |
| Hispanic | 4 (2) | 2 (2) | 1 (2) | 11 (5) | 18 (3) |
| Unspecified | 0 (0) | 0 (0) | 0 (0) | 1 (<1) | 1 (<1) |
| Handedness (% of subsample) | |||||
| Right | 189 (88) | 78 (83) | 56 (88) | 199 (87) | 513 (86) |
| Mixed | 19 (9) | 11 (12) | 7 (11) | 21 (9) | 36 (6) |
| Left | 18 (8) | 9 (10) | 10 (16) | 32 (14) | 37 (6) |
| Undetermined | 6 (3) | 2 (2) | 4 (6) | 2 (<1) | 14 (2) |
| Socioeconomic Statusb | |||||
| Mean (SD) | 43.49 (18.40) | 42.92 (13.87) | 40.11 (16.89) | 40.70 (20.57) | 41.99 (18.49) |
| Range | 20–89 | 20–70 | 20–77 | 20–95 | 20–95 |
| Mean Cortical Thickness (10−4 m) | |||||
| Mean (SD) | 42.0 (3.4) | 41.3 (3.2) | 41.2 (3.7) | 41.2 (3.8) | 41.5 (3.6) |
| Range | 21.7–49.0 | 26.7–47.1 | 29.6–47.9 | 28.1–50.0 | 21.7–50.0 |
| Variance | 11.5 | 10.4 | 13.3 | 14.5 | 12.72 |
Singletons represent subjects in families without twins, with sibships ranging from 1–5.
As assessed using the Hollingshead scale (Hollingshead and Redlich, 1958).
Image Acquisition
All subjects were scanned on the same GE 1.5 Tesla Signa scanner using the same three-dimensional spoiled gradient recalled echo in the steady state (3D SPGR) imaging protocol (axial slice thickness = 1.5 mm, time to echo = 5 msec, repetition time = 24 msec, flip angle = 45 degrees, acquisition matrix = 192 × 256, number of excitations = 1, and field of view = 24 cm). Figure 1 provides an example of the raw data that was acquired. A clinical neuroradiologist evaluated all scans and no gross abnormalities were reported.
Figure 1.

Example of raw T1 weighted SPGR image used in the present study. Data were acquired using the identical pulse sequence and the same 1.5 Tesla scanner for all subjects.
Image Analysis
The native MRI scans were registered into standardized stereotaxic space using a linear transformation (Collins et al., 1994) and corrected for non-uniformity artifacts (Sled et al., 1998). The registered and corrected volumes were segmented into white matter, gray matter, cerebro-spinal fluid and background using a neural net classifier (Zijdenbos et al., 2002). The white and gray matter surfaces are fitted using deformable surface-mesh models and non-linearly aligned towards a standard template surface (Kim et al., 2005; MacDonald et al., 2000; Robbins et al., 2004). The white and grey matter surfaces are resampled into native space and CT is measured in native-space millimeters using the linked distance between the white and pial surfaces at each of 40,962 cortical points throughout the cortex (Lerch and Evans, 2005; MacDonald et al., 2000). In order to improve the ability to compare populations, each subject’s cortical thickness map blurred using a 30mm surface based blurring kernel, which respects anatomical boundaries, chosen to maximize statistical power while minimizing false positives (Lerch and Evans, 2005).
Cortical points are assigned to specific regions using a probabilistic atlas (Collins, et al. 1999). These methods have been validated using both manual measurements (Kabani, et al. 2001) and a population simulation (Lerch and Evans 2005), and have been used in studies of Alzheimer’s disease (Lerch, et al. 2005) and normal development (Shaw, et al. 2005), among others. Statistical results from structural equation modeling analyses of cortical thickness at each point (see Statistical Methods, below) are projected upon the smoothed brain template using software developed by the Montreal Neurological Institute. Descriptive statistics for mean cortical thickness by study group are provided in Table 1. Group differences in mean (F3,597 = 2.00 p = 0.11) and variance (Brown Forsythe test F3,597 = 2.27, p = 0.07) were not statistically significant despite the large sample size.
Statistical Analysis
Our overall analytic approach is similar to many of the MACAAC (Mapping Anatomical Correlations Across the Cerebral Cortex ) methods described in Lerch et al. which calculate Pearson cross-correlations between a target ROI and all cortical vertices (Lerch et al., 2006). The present methods differ in that 1) data records were based on families rather than individuals and 2) variance decomposition for each vertex were computed using SEM in Mx (Neale et al., 2002), a linear algebra interpreter and numeric optimizer commonly used in quantitative genetics (Neale and Cardon, 1992).
The parsing of variation into subcomponents is possible because of the known differences in genetic relatedness between different types of family members. Both simple arithmetic approaches (e.g. Falconer estimation) and SEM can be used to estimate genetic variance and covariance in this manner. In the univariate case, for example, differences between MZ and DZ cross-twin correlations can be used to estimate the variance attributable to genetic factors across all vertices via the formula:
Where VARA is a Nv × 1 vector of genetic variances equal in length to the observed measurements (e.g., in our case, Nv = 40962), νi is the measured cortical thickness for the ith vertex, and subscripts 1 and 2 denote twin number. NMZ and NDZ, μMZ and μDZ, and j and k are the number of twin pairs, means, and twin pair index for MZ and DZ groups, respectively. This formulation is more simply and familiarly expressed as VarAi = 2(coviMZ–coviDZ) for the ith vertex; the variance analog of the Falconer estimation for heritability (Falconer and Mackay, 1996). A similar procedure can be employed to estimate the genetic covariance between two phenotypes of interest by comparing the cross-twin, cross-trait covariances between MZ and DZ groups rather than the within-trait covariances. For the ith vertex, in order to calculate the genetic covariation with a seed ROI the formula can be modified to:
which simplifies to CovA (Vi , ROI) = 2(CovMZ (Vi1, ROI2 ) – CovDZ (Vi1, ROI2 )). These simple formulations have some important limitations. The calculation of genetic covariance shown above, for example, effectively ignores half of the available information on cross twin covariance. Though including this information is possible, several other problems with this approach remain, including 1) these statistics do not easily generalize to more than two individuals per family group, 2) no information regarding the relative precision of the MZ and DZ correlations is incorporated, which are dependent both on sample size and correlation magnitude, 3) generating test statistics to determine whether covariation is statistically important is not straightforward, and 4) the addition of covariates, such as age and sex, is difficult. Thus, in order to estimate genetic and environmental covariances, we employed SEM as described below.
Although conceptually similar to the above formulae, SEM-based approaches provide a straightforward solution to these problems and were used in the present study. Family relationships were modeled using a statistical genetic extension of the Cholesky decomposition (e.g., Figure 2), which factors any symmetric positive definite matrix into a lower triangular matrix postmultiplied by its transpose (Neale and Cardon, 1992). This approach allows for the covariance between two phenotypes to be decomposed into covariance resulting from genetic, shared environmental, or unique environmental sources but places few a priori constraints on the data. The variance in observed variables (denoted as rectangles in Figure 2) are modeled to be mediated by latent additive genetic (A.), shared environmental (C.) or unique environmental (E.) sources of variance (circles) with latent variances standardized to unity.
Figure 2.

Example of a path diagram describing the bivariate Cholesky decomposition used to estimate genetic correlations between regions of interest (ROIs). The variance in observed variables (denoted as rectangles) are modeled to be mediated by latent additive genetic (A.), shared environmental (C.) or unique environmental (E.) sources of variance (circles) with latent variances standardized to unity. In this example, two related family members (S1 and S2) are shown. For families with more than two individuals, this model is easily expanded, with families of size k generating (2k)2 informative variance/covariance relationships. Subjects without family members in the present study are not genetically informative, but provide useful information for the estimation of total ROI variances as well as the within-person phenotypic covariance.
This model is identified since the correlation between genetic factors is perfect in MZ twins, but, on average, ½ between DZ twins and singleton siblings. In the path diagram shown in Figure 2, single-headed arrows are causal, double headed arrows represent correlations, with values on causal arrows (e.g. a1, a2, and a3) representing freely estimated parameters. The expected covariances of this model produce nine simultaneous equations from which the values of the nine free parameters (a., c., e.) can be estimated. In practice, the expected covariance matrices varied from 2 × 2 to 10 × 10 depending on the number of members in the family (i.e. 1–5). The addition of siblings of twins and a large sample of siblings from singleton families (i.e. families with no twins) provided substantially increased power to detect genetic signal due to a greater number of observed covariance statistics (Posthuma et al., 2000; Posthuma and Boomsma, 2000). This extended design assumes that the shared environment operates similarly in both twins and singleton births, with respect to the phenotype of interest. In our sample, families contained a twin pair and up to three additional siblings, or singleton families with up to five members in total. Consistent with our univariate analyses (Lenroot et al., 2007), the role of the shared environment was minimal for all seed regions, and following the rules of parsimony it was removed from the findings reported below.
Optimization was performed using maximum likelihood (ML) (Edwards, 1972), which produces unbiased estimates of model parameters. From the parameter estimates calculations of the genetic and unique environmental covariance (covG and covE) between an ROI and all vertices could be determined. In addition, the genetic and environmental correlations were calculated by standardizing the decomposed variance-covariance matrices:
ML also allows for straightforward hypothesis testing, since the removal of parameters of interest from the original model produces nested submodels in which the difference in ML generally follows a χ2 distribution, with degrees of freedom equal to the difference in the number of free parameters (Neale and Cardon, 1992). Thus, probability maps indicating regions of significant covariances could be constructed.
Assessment of Global Covariation
We first wanted to determine how genetic factors contribute to global covariation patterns. MACAAC algorithms include a measure of correlational strength (MACAAC-strength), which is the average correlation between vertex i and all other vertices:
Unfortunately, this approach is computationally demanding, as correlations for all pairwise combinations of vertices must be calculated. The computational cost is magnified with SEM, as numeric optimization must be performed for each pairwise combination of vertices. However, it has been demonstrated that use of global mean cortical thickness as a target ROI provides a reasonable approximation for the average correlation across all j (Lerch et al., 2006). This approach represents a special case of the general bivariate method of comparing a single ROI to a large vector of vertices.
Therefore, we employed our general bivariate SEM using mean global cortical thickness as the target ROI (μG). In addition to modeling the variances as described previously, we also simultaneously adjusted for mean effects of sex and age on the phenotypes of interest. Sex effects were estimated using a linear model and age was estimated using a cubic model, based on prior evidence of age interactions with cortical thickness (Lenroot et al., 2005). The resultant parameter estimates provide measures of the dominant forces driving interrelationships in cortical thickness. These findings provide similar information to that which would be gleaned from examining the dominant eigenvalues of a principle component analyses on the Nv × Nv (40962 × 40962) covariance matrix, after decomposing the matrix into genetic and environmental subcomponents.
The maximal likelihood parameter estimates for the analyses were then projected onto the brain surface. In order to gain a thorough understanding of the strength of relationships, both covariances and correlation maps were constructed. Correlations have the advantage of standardizing the relationships between variables, but can be deceptive when covariances are very small. Additionally, probability maps testing for the significance of genetic and environmental effects on cortical associations (H0: rG = 0 and H0: rE = 0, respectively) were constructed. A priori, we expected that these analyses would produce a large number of moderately significant voxels with few highly significant, voxels and a high level of clustering of significant voxels. Thus, the risk of type I error associated with multiple testing was controlled by setting a relatively lenient false discovery rate (FDR) of .10 (Genovese et al., 2002), with η0 calculated by bootstrap (Storey, 2002).
Analyses of target ROIs
We also examined covariances with respect to more localized ROIs. The seed ROIs were determined using a probabilistic atlas was used to assign cortical points to specific neuroanatomic regions (Collins et al., 1999), which roughly corresponded to cerebral gyri and were based on the sulcal definitions of Ono (Ono et al., 1990). The mean CT for this region was then calculated. In these studies, we controlled for global effects by including μG as a covariate in addition to age and sex.
Our previous research has suggested that many of the most heritable vertices in the cortex lie in superior and inferior frontal gyri (SFG and IFG, respectively), supramarginal gyrus (SMG), superior parietal lobule (SPL), and the superior temporal gyrus (STG). Because we are primarily interested in the formation of genetically mediated cortical networks, we used these ROIs as seed regions for the generation of covariance maps.
Results
Global Covariation
Genetic correlations with global mean cortical thickness (μG) approached unity and were substantially higher than environmental correlations, though both had similar patterns. The genetic correlations were uniformly high except in the superior parietal lobule and the occipital pole (Figure 3). The regions with the strongest genetic correlations were the frontal cortex, SMG, STG, and in parieto-temporal cortex centered on the angular gyrus and continuing into lateral temporal lobe. Most primary somatosensory cortex, primary motor cortex, and primary visual cortex had lower genetic correlations with μG. The most notable differences in pattern between the two measures were that genetic correlations in the frontal poles, left SMG and STG, and inferior pre- and postcentral gyri bilaterally were among the highest in the brain, while environmental correlations were unremarkable in these regions. Probability maps (not shown) were uniformly significant, with 86% and 99% of all vertices significantly correlated with μG via genetic and environmental factors, respectively, at an α of .05. Correlational patterns for both genetic and environmental correlations were remarkably similar to measures of phenotypic cross correlations reported by Lerch et al., with the genetic correlational maps more similar in magnitude.
Figure 3.
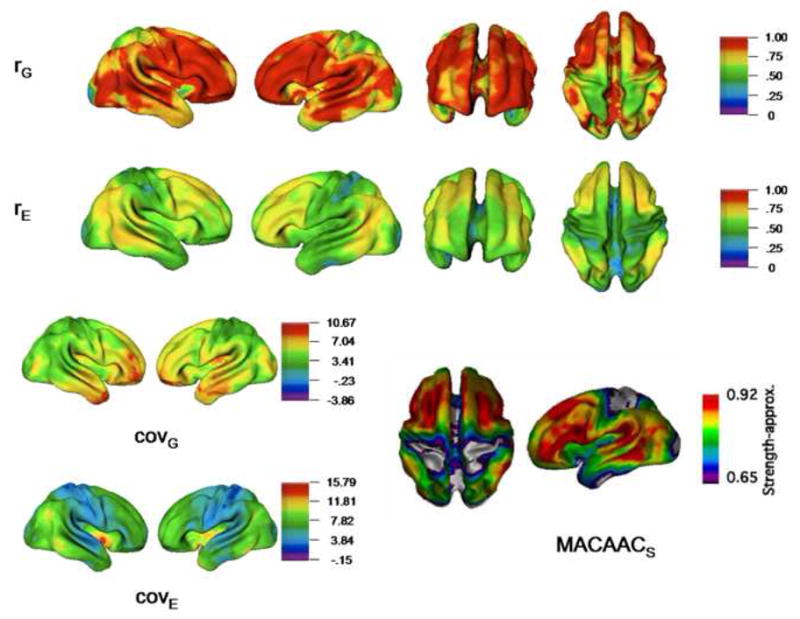
Maps of genetic and environmental relationships between global mean CT and individual vertices. Genetic and environmental correlations (rG and rE) and covariances (covG and covE) are shown. Both genetic and environmental correlations were highly significant throughout the brain. Map of MACAACs statistic (lower right) is adapted from Lerch et al. (2006).
Correlations with target ROIs
When modeling relationships with target ROIs, striking differences were observed between the genetic and environmental correlations. Figures 4 and 5 provide surface renderings of the results of analyses using several seed ROIs. In general, we observed that both environmental correlations and covariances tend to be greatest in regions in close spatial proximity to the seed, gradually decreasing with greater distance along the cortical surface. Environmental correlations were almost entirely unilateral, with some notable exceptions. The most obvious of these were environmental correlations between the superior frontal gyrus and its contralateral homologue, though correlations remained highly asymmetrical. Environmental correlations appeared almost entirely positive.
Figure 4.

Covariance Maps between CT and ten seed ROIs with high univariate heritability. Genetic and environmental correlations (rG and rE), covariances (covG and covE), and probability maps testing for significant genetic and environmental covariance (adjusted for multiple testing with an FDR threshold of .10) are given for each seed ROI. Correlations are on the same scale for each ROI (range -1 to 1); Scales for covariances and probability maps are based on individual analyses.
Figure 5.

Standardized probability maps (range 0 – .05) testing for the significance of genetic and environmental factors between ten seed ROIs and the cortical surface.
Genetic correlations, in contrast, were typically bilateral and were occasionally negative. Genetic correlations were high spatially proximal to the seed itself, but also in and near the corresponding gyrus in the contralateral hemisphere. To varying degrees, we observed the general pattern of bilateral genetic correlations in the contralateral homologue for both left and right SFG, IFG, SMG, and SPL target ROIs. In many cases, the genetic correlations were, in fact, stronger in the contralateral hemisphere. Negative genetic correlations were most commonly observed between distal structures, such as between frontal ROIs and the occipitotemporal cortex. We also observed some differences in the pattern of genetic correlations when the ROI seed was in the left or right hemisphere, particularly for the IFG. Though the genetic correlations were strong bilaterally in both cases, they were very high between RIFG and the entire frontal lobe, while genetic correlations to LIFG were more restricted to inferior frontal and orbitofrontal cortex.
The most prominent exceptions to these general observations were the results from analyses using STG as a seed, which differed noticeably compared to other ROIs, particularly LSTG. Both genetic and environmental correlations were surprisingly low. We observed virtually no significant genetic effects when the entire LSTG was used as a seed, but significant negative distal environmental correlations with superior and dorsal frontal regions bilaterally and the superior parietal lobule.
Discussion
These analyses demonstrate that traditional quantitative methodologies for the assessment of genetic variance can be integrated with novel multivariate tools for assessing cortical connectivity at high levels of resolution. This addition allowed us to decompose phenotypic correlations into maps of genetic and environmental relatedness.
Using these methods, we found several differences between genetically-mediated and environmentally-mediated cortical relationships. While nearly all cortical vertices were highly correlated with μG via shared genetic origins, global environmental correlations were somewhat lower. Both genetic and environmental global correlations were highest in frontal and tempro-parietal association cortex, and were virtually identical to the MACACCs map of phenotypic correlations reported by Lerch et al. (see Figure 3). Since the MACACCs statistic identifies voxels with the highest average global associations, it is logical that association cortex would be most implicated. Interestingly, it appears as if this correlational pattern is determined by both common genetic and environmental effects.
The high genetic correlations between nearly the entire cortical surface and μG are consistent with the multivariate genetic studies on volumes, which show a single genetic factor accounting for the majority of both total genetic variance and the total phenotypic variance (Schmitt et al., 2007). Environmental factors appear to be somewhat more important to CT phenotypic variance than for volumes, but global genetically-mediated CT correlations appear largely dominated by a single genetic factor. Such a finding is consistent with radial models of neocortical evolution (Rakic, 1995) as well as the more recent modifications of this hypothesis (Kriegstein et al., 2006). It is important to note, however, that genetic covariances with μG were not uniform, but substantially higher in the frontal lobe, middle temporal lobe, and supramarginal gyrus, particularly on the left. The discrepancy between genetic correlations and covariances likely is due to a larger amount of genetic variance within the pediatric population in these regions.
Seed ROIs
For most seed ROIs, we observed strong localized environmental correlations and regionalized, bilateral genetic correlations after adjusting for μG. Strong associations between ROIs and their contralateral homologues has been reported previously in both phenotypic and genetic studies of intracortical correlations at the gyral level (He et al., 2007; Schmitt et al., 2008), as well as phenotypic correlations at high resolution (Lerch et al., 2006).
In this high resolution study, most of the covariance that we observed between the left and right hemispheres was a result of shared genetic mechanisms. A regionalized genetic role in bilateral cortical patterning, of course, is not a novel concept. Numerous neurogenetic syndromes are associated with bilateral abnormalities with very specific anatomical patterns, including several forms of polymicrogyria, Smith Magenis syndrome, Turner syndrome, and language disorder associated with FOXP2 (, 2000; Boddaert et al., 2004; Guerrini and Marini, 2006; Mochida, 2005; Molko et al., 2004; Piao et al., 2005; Watkins et al., 2002). Recent anatomic MRI studies have shown that several common genetic polymorphisms influence brain structure bilaterally and in a regionally-specific manner, including variants of COMT, DISC1, BDNF, PCF1, and APOE (Gurling et al., 2006; Hashimoto and Lewis, 2006; McIntosh et al., 2006; Nemoto et al., 2006; Wishart et al., 2006). For example, in a study of the apolipoprotein E gene (APOE), Wishart et al. found regionalized bilateral gray matter reductions in frontal and temporal regions in ε4/ε3 heterozygotes relative to individuals homozygous for the ε3 allele (Wishart et al., 2006). The aggregate effects of many polymorphisms such as these could explain the patterns we observed in population genetic variance in CT. Conversely, the information gleaned from studies on genetic covariance may facilitate the identification of the genes responsible for structural brain variation, by suggesting novel endophenotypic constructs or targets for multivariate analysis.
The most interesting exception to bilateral genetic correlations was our analyses of STG, which had distinctly different correlational patterns compared to other ROIs. The LSTG target ROI had virtually no significant genetic correlations with any vertex, even those within its confines, but significant negative environmental correlations with superior frontal structures. Prior research on functional connectivity has shown strong associations between the STG and dorsolateral prefrontal cortex in typically developing adults, and disruptions in connectivity are implicated in schizophrenia (Buckholtz et al., 2007; Gur et al., 1999; Wolf et al., 2007). The present findings would suggest that at least with respect to variation within the typical pediatric population, anatomic associations between STG and dorsal frontal regions may be strongly influenced by nongenetic factors.
Although these findings represent a unique perspective on the genetics of brain structure, the limitations of the analyses must be considered in order to evaluate their utility. As this research represents a fusion of high-resolution anatomic methods as well as genetic techniques for twin and family covariance modeling, the general caveats for both apply to this research.
For example, twin methods are dependent on the validity of the equal environment assumption (EEA), which assumes that the environment influences MZ and DZ twins similarly with respect to the phenotype of interest. Prior studies have demonstrated that the EEA holds true for most behavioral phenotypes (Evans et al., 2002); although there are no data on the EEA for cortical thickness, it is likely that the EEA would also hold in this case. A second limitation is the potential for epistasis, gene × environment interactions or epigenetic factors (e.g. DNA methylation) to influence estimates of additive genetic covariance. Both epistatic effects as well as gene by environmental interactions would be included in the estimates of genetic covariance, while epigenetic effects would be included in estimates of nongenetic variance. Third, it is important to keep in mind that variance components analyses are substantially less powerful for a given sample size compared to analyses of the means or other more commonly-used statistics; although our sample is large by imaging standards, it is small by the standards of population genetics. The interpretation of the present data must be made with consideration of these limitations and the likelihood of some false positive results given the lenient FDR threshold used and the multiple analyses performed.
Image processing also may produce several potential biases. One limitation of particular importance to the present study was that the use of a smoothing kernel could be partially responsible for local environmental correlations between the seed ROIs and individual vertices. Further, as the raw imaging data are rotated into standardized space prior to measurement, increased similarities in brain morphology between family members may influence measures of cortical thickness. However, the limitations of transforming raw imaging data to a template image in an automated fashion is not specific to twin and family studies, although in general the problem is reversed (e.g. group differences in brain morphology may theoretically influence alignment to the template images and produce group differences in cortical thickness). In the case of the present study, however, the image processing methodologies have been well tested (Lerch and Evans, 2005).
Finally, as our sample was entirely derived from a pediatric population, its generalizability to other ages is unclear. Indeed it is likely that future work on adults may find distinctly different patterns of genetic covariance, as childhood brain structure may be more strongly influenced by ontogenetic processes underlying brain formation itself, while adult brains will have had more time for these effects to attenuate, as well as time for novel genetic and experiential effects on covariance to manifest. Future directions for this work include expanding the models reported here to address more subtle questions about genetic and environmental etiology, such as how age, sex, or other moderators affect covariance patterns, as well as to explore how intracortical relationships influence behavioral measures.
Acknowledgments
This research was supported by NIH grants MH-65322, MH-20030, and DA-18673.
Footnotes
Publisher's Disclaimer: This is a PDF file of an unedited manuscript that has been accepted for publication. As a service to our customers we are providing this early version of the manuscript. The manuscript will undergo copyediting, typesetting, and review of the resulting proof before it is published in its final citable form. Please note that during the production process errors may be discovered which could affect the content, and all legal disclaimers that apply to the journal pertain.
Reference List
- Achenbach TM, Ruffle TM. The Child Behavior Checklist and related forms for assessing behavioral/emotional problems and competencies. Pediatr Rev. 2000;21:256–271. doi: 10.1542/pir.21-8-265. [DOI] [PubMed] [Google Scholar]
- Boddaert N, De Leersnyder H, Bourgeois M, Munnich A, Brunelle F, Zilbovicius M. Anatomical and functional brain imaging evidence of lenticulo-insular anomalies in Smith Magenis syndrome. Neuroimage. 2004;21:1021–1025. doi: 10.1016/j.neuroimage.2003.10.040. [DOI] [PubMed] [Google Scholar]
- Buckholtz JW, Meyer-Lindenberg A, Honea RA, Straub RE, Pezawas L, Egan MF, Vakkalanka R, Kolachana B, Verchinski BA, Sust S, Mattay VS, Weinberger DR, Callicott JH. Allelic variation in RGS4 impacts functional and structural connectivity in the human brain. J Neurosci. 2007;27:1584–1593. doi: 10.1523/JNEUROSCI.5112-06.2007. [DOI] [PMC free article] [PubMed] [Google Scholar]
- Collins DL, Neelin P, Peters TM, Evans AC. Automatic 3D Intersubject Registration of Mr Volumetric Data in Standardized Talairach Space. J Comput Assist Tomogr. 1994;18:192–205. [PubMed] [Google Scholar]
- Collins DL, Zijdenbos AP, Barre WFC, Evans AC. ANIMAL+INSECT: Improved cortical structure segmentation. In: Kuba A, Samal M, Todd-Pokropek A, editors. Proceedings; Information Processing in Medical Imaging: 16th International Conference, IPMI'99; Visegrad, Hungary. June/July 1999; Berlin: Springer Verlag; 1999. pp. 210–223. [Google Scholar]
- Edwards AWF. Likelihood. Cambridge, London: 1972. [Google Scholar]
- Evans DM, Gillespie NA, Martin NG. Biometrical genetics. Biol Psychol. 2002;61:33–51. doi: 10.1016/s0301-0511(02)00051-0. [DOI] [PubMed] [Google Scholar]
- Falconer DS, Mackay TFC. Introduction to quantitative genetics. Longman, Essex: 1996. [Google Scholar]
- Genovese CR, Lazar NA, Nichols T. Thresholding of statistical maps in functional neuroimaging using the false discovery rate. Neuroimage. 2002;15:870–878. doi: 10.1006/nimg.2001.1037. [DOI] [PubMed] [Google Scholar]
- Guerrini R, Marini C. Genetic malformations of cortical development. Exp Brain Res. 2006;173:322–333. doi: 10.1007/s00221-006-0501-z. [DOI] [PubMed] [Google Scholar]
- Gur RC, Turetsky BI, Matsui M, Yan M, Bilker W, Hughett P, Gur RE. Sex differences in brain gray and white matter in healthy young adults: Correlations with cognitive performance. J Neurosci. 1999;19:4065–4072. doi: 10.1523/JNEUROSCI.19-10-04065.1999. [DOI] [PMC free article] [PubMed] [Google Scholar]
- Gurling HMD, Critchley H, Datta SR, McQuillin A, Blaveri E, Thirumalai S, Pimm J, Krasucki R, Kalsi G, Quested D, Lawrence J, Bass N, Choudhury K, Puri V, O'Daly O, Curtis D, Blackwood D, Muir W, Malhotra AK, Buchanan RW, Good CD, Frackowiak RSJ, Dolan RJ. Genetic association and brain morphology studies and the chromosome 8p22 pericentriolar material 1 (PCM1) gene in susceptibility to schizophrenia. Arch Gen Psychiatry. 2006;63:844–854. doi: 10.1001/archpsyc.63.8.844. [DOI] [PMC free article] [PubMed] [Google Scholar]
- Hashimoto T, Lewis DA. BDNF Val66Met polymorphism and GAD(67) mRNA expression in the prefrontal cortex of subjects with schizophrenia. Am J Psychiatry. 2006;163:534–5U2. doi: 10.1176/appi.ajp.163.3.534. [DOI] [PubMed] [Google Scholar]
- He Y, Chen ZJ, Evans AC. Small-World Anatomical Networks in the Human Brain Revealed by Cortical Thickness from MRI. Cereb Cortex. 2007 doi: 10.1093/cercor/bhl149. In press. (Epub available ahead of print) [DOI] [PubMed] [Google Scholar]
- Kim JS, Singh V, Lee JK, Lerch J, Ad-Dab'bagh Y, MacDonald D, Lee JM, Kim SI, Evans AC. Automated 3-D extraction and evaluation of the inner and outer cortical surfaces using a Laplacian map and partial volume effect classification. Neuroimage. 2005;27:210–221. doi: 10.1016/j.neuroimage.2005.03.036. [DOI] [PubMed] [Google Scholar]
- Kriegstein A, Noctor S, Martinez-Cerdeno V. Patterns of neural stem and progenitor cell division may underlie evolutionary cortical expansion. Nat Rev Neurosci. 2006;7:883–890. doi: 10.1038/nrn2008. [DOI] [PubMed] [Google Scholar]
- Lenroot R, Schmitt JE, Ordaz S, Wallace GW, Neale MC, Lerch JP, Kendler KS, Evans AC, Giedd JN. Quantitative genetic analysis of cortical thickness in a pediatric twin population. Hum Brain Mapp. 2007 In press. (Epub available ahead of print) [Google Scholar]
- Lenroot R, Shaw P, Taylor K, Greenstein D, Clasen L, Evans A, Giedd JN. Gender-specific longitudinal changes in cortical thickness in children and adolescents. Neuropsychopharmacology. 2005;30:S156. [Google Scholar]
- Lerch JP, Evans AC. Cortical thickness analysis examined through power analysis and a population simulation. Neuroimage. 2005;24:163–173. doi: 10.1016/j.neuroimage.2004.07.045. [DOI] [PubMed] [Google Scholar]
- Lerch JP, Worsley K, Shaw WP, Greenstein DK, Lenroot RK, Gledd J, Evans AC. Mapping anatomical correlations across cerebral cortex (MACACC) using cortical thickness from MRI. Neuroimage. 2006;31:993–1003. doi: 10.1016/j.neuroimage.2006.01.042. [DOI] [PubMed] [Google Scholar]
- MacDonald D, Kabani N, Avis D, Evans AC. Automated 3-D extraction of inner and outer surfaces of cerebral cortex from MRI. Neuroimage. 2000;12:340–356. doi: 10.1006/nimg.1999.0534. [DOI] [PubMed] [Google Scholar]
- McIntosh AM, Baig B, Hall J, Job D, Whalley HC, Owens D, Miller P, Porteous D, Lawrie SM, Johnstone EC. Relationship of COMT variants to brain structure, function and risk of psychosis. Schizophr Res. 2006;81:192–193. [Google Scholar]
- Mochida GH. Cortical malformation and pediatric epilepsy: A molecular genetic approach. J Child Neurol. 2005;20:300–303. doi: 10.1177/08830738050200040501. [DOI] [PubMed] [Google Scholar]
- Molko N, Cachia A, Riviere D, Mangin JF, Bruandet M, LeBihan D, Cohen L, Dehaene S. Brain anatomy in Turner syndrome: Evidence for impaired social and spatial-numerical networks. Cereb Cortex. 2004;14:840–850. doi: 10.1093/cercor/bhh042. [DOI] [PubMed] [Google Scholar]
- Neale MC, Boker SM, Xie G, Maes HH. Mx: Statistical Modeling. Department of Psychiatry, Medical College of Virginia, Virginia Commonwealth University; Richmond, VA: 2002. [Google Scholar]
- Neale MC, Cardon LR. Methodology for Genetic Studies of Twins and Families. Kluwer Academic; Dordrecht, the Netherlands: 1992. [Google Scholar]
- Nemoto K, Ohnishi T, Mori T, Moriguchi Y, Hashimoto R, Asada T, Kunugi H. The Val66Met polymorphism of the brain-derived neurotrophic factor gene affects age-related brain morphology. Neurosci Lett. 2006;397:25–29. doi: 10.1016/j.neulet.2005.11.067. [DOI] [PubMed] [Google Scholar]
- Ono M, Kubik S, Abernathey CD. Atlas of the Cerebral Sulci. Thieme; Stuttgart/New York: 1990. [Google Scholar]
- Piao XH, Chang BS, Bodell A, Woods K, BenZeev B, Topcu M, Guerrini R, Goldberg-Stern H, Sztriha L, Dobyns WB, Barkovich AJ, Walsh CA. Genotype-phenotype analysis of human frontoparietal polymicrogyria syndromes. Ann of Neurol. 2005;58:680–687. doi: 10.1002/ana.20616. [DOI] [PubMed] [Google Scholar]
- Posthuma D, Boomsma DI. A note on the statistical power in extended twin designs. Behav Genet. 2000;30:147–158. doi: 10.1023/a:1001959306025. [DOI] [PubMed] [Google Scholar]
- Posthuma D, De Geus EJ, Neale MC, Hulshoff Pol HE, Baare WEC, Kahn RS, Boomsma D. Multivariate genetic analysis of brain structure in an extended twin design. Behav Genet. 2000;30:311–319. doi: 10.1023/a:1026501501434. [DOI] [PubMed] [Google Scholar]
- Rakic P. A Small Step for the Cell, A Giant Leap for Mankind - A Hypothesis of Neocortical Expansion During Evolution. Trends Neurosci. 1995;18:383–388. doi: 10.1016/0166-2236(95)93934-p. [DOI] [PubMed] [Google Scholar]
- Ramnani N, Behrens TEJ, Penny W, Matthews PM. New approaches for exploring anatomical and functional connectivity in the human brain. Biol Psychiatry. 2004;56:613–619. doi: 10.1016/j.biopsych.2004.02.004. [DOI] [PubMed] [Google Scholar]
- Robbins S, Evans AC, Collins DL, Whitesides S. Tuning and comparing spatial normalization methods. Med Image Anal. 2004;8:311–323. doi: 10.1016/j.media.2004.06.009. [DOI] [PubMed] [Google Scholar]
- Schmitt JE, Wallace GW, Rosenthal MA, Molloy EA, Ordaz S, Lenroot R, Clasen LS, Blumenthal J, Kendler KS, Neale MC, Giedd JN. A multivariate analysis of neuroanatomic relationships in a genetically informative pediatric sample. Neuroimage. 2007;35:70–82. doi: 10.1016/j.neuroimage.2006.04.232. [DOI] [PubMed] [Google Scholar]
- Schmitt JE, Lenroot RK, Wallace GL, Ordaz S, Taylor KN, Kabani N, Greenstein D, Lerch JP, Kendler KS, Neale MC, Giedd JN. Identification of Genetically Mediated Cortical Networks: A Multivariate Study of Pediatric Twins and Siblings. Cereb Cortex. 2008 doi: 10.1093/cercor/bhm211. In press. (Epub available ahead of print) [DOI] [PMC free article] [PubMed] [Google Scholar]
- Sled JG, Zijdenbos AP, Evans AC. A nonparametric method for automatic correction of intensity nonuniformity in MRI data. IEEE Trans Med Imaging. 1998;17:87–97. doi: 10.1109/42.668698. [DOI] [PubMed] [Google Scholar]
- Storey JD. A direct approach to false discovery rates. Journal of the Royal Statistical Society B. 2002;64:479–498. [Google Scholar]
- Watkins KE, Vargha-Khadem F, Ashburner J, Passingham RE, Connelly A, Friston KJ, Frackowiak RSJ, Mishkin M, Gadian DG. MRI analysis of an inherited speech and language disorder: structural brain abnormalities. Brain. 2002;125:465–478. doi: 10.1093/brain/awf057. [DOI] [PubMed] [Google Scholar]
- Wishart HA, Saykin AJ, McAllister TW, Rabin LA, McDonald BC, Flashman LA, Roth RM, Mamourian AC, Tsongalis GJ, Rhodes CH. Regional brain atrophy in cognitively intact adults with a single APOE epsilon 4 allele. Neurology. 2006;67:1221–1224. doi: 10.1212/01.wnl.0000238079.00472.3a. [DOI] [PubMed] [Google Scholar]
- Wolf DH, Loughead J, Elliott MA, Pratiwadi R, Gur RC, Turetsky BI, Gur RE. Neural response to novelty in schizophrenia: Relationship to positive and negative symptoms. Biol Psychiatry. 2007;61:255S. [Google Scholar]
- Worsley KJ, Chen JI, Lerch J, Evans AC. Comparing functional connectivity via thresholding correlations and singular value decomposition. Philos Trans R Soc Lond B Biol Sci. 2005;360:913–920. doi: 10.1098/rstb.2005.1637. [DOI] [PMC free article] [PubMed] [Google Scholar]
- Zijdenbos AP, Forghani R, Evans AC. Automatic "pipeline" analysis of 3-D MRI data for clinical trials: Application to multiple sclerosis. IEEE Trans Med Imaging. 2002;21:1280–1291. doi: 10.1109/TMI.2002.806283. [DOI] [PubMed] [Google Scholar]