Abstract
Coenzyme Q10 (CoQ10) is essential for electron transport in the mitochondrial respiratory chain and antioxidant defense. The relative importance of respiratory chain defects, ROS production, and apoptosis in the pathogenesis of CoQ10 deficiency is unknown. We determined previously that severe CoQ10 deficiency in cultured skin fibroblasts harboring COQ2 and PDSS2 mutations produces divergent alterations of bioenergetics and oxidative stress. Here, to better understand the pathogenesis of CoQ10 deficiency, we have characterized the effects of varying severities of CoQ10 deficiency on ROS production and mitochondrial bioenergetics in cells harboring genetic defects of CoQ10 biosynthesis. Levels of CoQ10 seem to correlate with ROS production; 10–15% and >60% residual CoQ10 are not associated with significant ROS production, whereas 30–50% residual CoQ10 is accompanied by increased ROS production and cell death. Our results confirm that varying degrees of CoQ10 deficiency cause variable defects of ATP synthesis and oxidative stress. These findings may lead to more rational therapeutic strategies for CoQ10 deficiency.—Quinzii, C. M., López, L. C., Gilkerson, R. W., Dorado, B., Coku, J., Naini, A. B., Lagier-Tourenne, C., Schuelke, M., Salviati, L., Carrozzo, R., Santorelli, F., Rahman, S., Tazir, M., Koenig, M., DiMauro, S., Hirano, M. Reactive oxygen species, oxidative stress, and cell death correlate with level of CoQ10 deficiency.
Keywords: mitochondria, respiratory chain, ATP, ubiquinone, mitochondrial disease
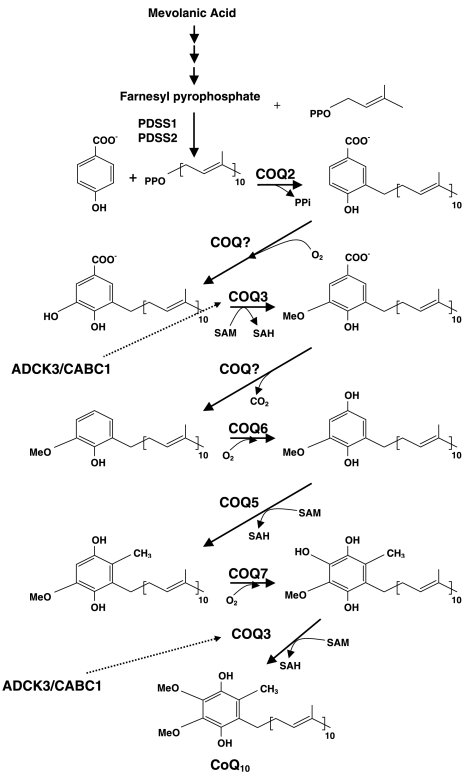
Coenzyme Q10 (CoQ10), the predominant form of ubiquinone in humans, is synthesized in the mitochondrial inner membrane and is composed of a benzoquinone and a decaprenyl side chain. Whereas the quinone ring is derived from tyrosine or phenylalanine, the isoprenoid side chain is produced by addition of isopentenyl diphosphate molecules, derived from the mevalonate pathway, to farnesyl diphosphate in multiple steps catalyzed by decaprenyl diphosphate synthase (1). Decaprenyl diphosphate and parahydroxybenzoate (PHB) are condensed in a reaction catalyzed by PHB-polyprenyl transferase or COQ2, and the benzoate ring is then modified by at least 6 enzymes, which catalyze methylation, decarboxylation, and hydroxylation reactions to synthesize CoQ10 (Fig. 1).
Figure 1.
CoQ10 biosynthesis pathway. CoQ10 is composed of a benzoquinone and a decaprenyl side chain. ADCK3 (CABC1) is a kinase that modulates CoQ10 synthesis possibly through phosphorylation of COQ3 (30). The function of COQ9 is unknown.
In addition to its central role in the mitochondrial respiratory chain as the carrier of electrons from complexes I and II to complex III, CoQ10 participates in other cellular functions (2). The reduced form of CoQ10, ubiquinol, is one of the most potent lipophilic antioxidants in all cell membranes (3). CoQ10 is also required for pyrimidine nucleoside biosynthesis and may modulate apoptosis and mitochondrial uncoupling protein (2).
Although CoQ10 deficiency has been associated with a wide spectrum of phenotypes in more than 50 patients, the molecular genetic bases have been identified in only a few patients and the pathophysiological consequences of human CoQ10 deficiency at the cellular level remain largely unknown (4–6). Studies of cultured fibroblasts from two siblings with infantile-onset CoQ10 deficiency of unknown genetic etiology showed mild respiratory chain defects without evidence of excessive superoxide anion accumulation, lipid peroxidation, or apoptosis-mediated cell death (7). Lopez-Martin et al. (8) showed that fibroblasts from a patient with a homozygous mutations in COQ2 require uridine to maintain cell growth and proposed that deficiency of CoQ10 impaired pyrimidine biosynthesis because of the dependence of dihydro-orotate dehydrogenase on ubiquinol. Moreover, evidence of mitophagy has been reported in the same mutant COQ2 cell lines, as well as in two other cell lines with CoQ10 deficiency and unknown molecular defects (9).
In a previous study, we investigated the consequences of severe primary CoQ10 deficiencies on bioenergetics, oxidative stress, and antioxidant defenses in cultured skin fibroblasts harboring mutations in COQ2 and PDSS2 (encoding decaprenyl diphosphate synthase subunit 2) (10). To further understand the pathogenesis of CoQ10 deficiency and to confirm the findings that we had obtained in a limited number of cell lines, we have now characterized the effect of varying degrees of CoQ10 deficiency on matrix oxidant burden, cell viability, and mitochondrial functions in skin fibroblasts with CoQ10 deficiency due to different molecular defects, including mutations in COQ2 (11), ADCK3/CABC1 (12), and COQ9 (13).
MATERIALS AND METHODS
Cell culture
Mitochondrial bioenergetic and oxidative stress experiments were performed on skin fibroblasts from 5 controls (C1–C5) and 5 patients (P1–P5) (Table 1). Cell death studies were also performed in two previously characterized fibroblast lines (P6 and P7) (Table 1).
Table 1.
Summary of CoQ10 levels in fibroblasts, molecular defects of patients studied, and mitochondrial bioenergetics and oxidative stress assessment in CoQ10-deficient fibroblasts cultured in galactose medium with 10% regular FBS
| Patient | CoQ10 [ng/mg protein (% of normal)] | Gene | Mutation | ↓ ATP | ↑ Matrix burden/LPO/↑ protein oxidation | ↓ΔΨ | Cell death | MnSOD | Ref. |
|---|---|---|---|---|---|---|---|---|---|
| P1 | 10.4 (17.9) | COQ9 | R244X homozygous | + | −/−/− | − | − | − | 13 |
| P2 | 20.9 (36) | COQ2 | R197H, N228S | + | +/+/+ | − | + | − | 11 |
| P3 | 29.7 (51.2) | ADCK3 | Y514C,T584 del | − | −/−/− | − | − | − | 12 |
| P4 | 36.9 (63.4) | ADCK3 | Q167LfsX36 homozygous | − | −/−/− | − | − | − | 12 |
| P5 | 69 (119) | ADCK3 | D420WfsX40 or I467AfsX22 | − | −/−/− | − | − | − | 12 |
| P6 | 24.8 (42.7) | COQ2 | Y297C homozygous | + | +/+/+ | − | + | + | 5 |
| P7 | 13 (22.4) | PDDS2 | Q322X, S382L | + | −/−/− | − | − | − | 4 |
| Controls | 58 ± 10 | − | −/−− | − | − | − |
Oxidative stress and mitochondrial bioenergetics studies on P6 and P7 fibroblasts were reported previously (10). CoQ10 levels in controls are means ± sd (n = 5). ΔΨ, mitochondrial membrane potential; −, absence; +, presence.
Cells were initially grown in DMEM supplemented with 10% FBS, 1× MEM vitamin solution (choline chloride, D-calcium pantothenate, folic acid, nicotinamide, pyridoxal hydrochloride, riboflavin, thiamine hydrochloride, and i-inositol), 1× MEM nonessential amino acid solution, 1ml of Fungizone (2.5 μg/ml amphotericin B), 50 U/ml penicillin, and 50 μg/ml streptomycin until 80% confluent.
Experiments of mitochondrial bioenergetics and oxidative stress were performed after 48 h of incubation in RPMI 1640 glucose-free medium supplemented with 25 mM HEPES, 1.5 mM Glutamax, 25 mM galactose, Fungizone, penicillin, and streptomycin plus either 10% regular FBS (85–245 μg of glucose/ml) or 10% dialyzed FBS (<5 μg glucose/ml). We performed experiments in glucose free-medium to force energy production through oxidative phosphorylation because fibroblasts with mitochondrial respiratory chain defects maintain energy primarily by doubling the rate of anaerobic conversion of glucose to lactic acid (14). In contrast, slow metabolism of galactose to glucose 1-phosphate is not sufficient to fulfill ATP requirements by anaerobic glycolysis when oxidative metabolism is impaired (14).
Cell death studies were performed after 1 wk of growth in RPMI 1640 glucose-free medium supplemented with 10% regular FBS, HEPES, Glutamax, galactose, Fungizone, penicillin, and streptomycin.
All cell culture reagents were obtained from Invitrogen (Eugene, OR, USA). Patient and control cell lines at passages 7–10 were grown to replicate every experiment at least 3 times.
Cellular CoQ10 levels
CoQ10 in fibroblasts was extracted in a hexane-ethanol mixture. The lipid component of the extract was separated by HPLC on a reverse-phase Symmetry C18 column (3.5 mm, 4.6 × 150 mm; Waters, Milford, MA, USA), using a mobile phase consisting of methanol, ethanol, 2-propanol, acetic acid (500:500:15:15), and 50 mM sodium acetate at a flow rate of 0.9 ml/min. The electrochemical detector consisted of an ESA Coulochem II (ESA Inc., Chelmsford, MA, USA) with the following settings: guard cell (upstream of the injector) at +900 mV, conditioning cell at −600 mV (downstream of the column), followed by the analytical cell at +500 mV. The CoQ10 concentration was estimated by comparison of the peak area with those of standard solutions of known concentration (4).
Growth curves
Cells were plated in duplicate 6-well plates, trypsinized, and counted manually after 24, 48, and 72 h of incubation.
Mitochondrial bioenergetics assessment
To determine levels of adenine nucleotides, cells were grown in 15-cm-diameter plates until 90% confluent and then were collected in ice-cold PBS using a scraper. After centrifugation at 3000 g for 3 min at 4°C, pellets were suspended in 200 μl of ice-cold 0.5 M perchloric acid, vortexed for 30 s, and centrifuged at 11,000 g for 10 min at 4°C. The pellets were stored at −80°C for protein measurement. Adenine nucleotides in supernatants were measured in an Alliance high-performance liquid chromatograph (Waters) with an Alltima C18NUC reverse-phase column (Alltech Associates, Deerfield, IL, USA) (10). Adenine nucleotide levels were expressed as nanomoles per milligram of protein.
To estimate mitochondrial membrane potential, control and mutant cells were exposed to tetramethylrhodamine ethyl ester (TMRE) (Molecular Probes; Invitrogen, Carlsbad, CA, USA). Approximately 1 × 10⁶ cells were trypsinized, incubated with TMRE for 20 min at 37°C, washed twice with PBS, resuspended in 500 μl of PBS, and kept in ice.
Cytofluorometric analysis of stained cells was performed on a FACSCalibur cell analyzer (Becton Dickinson, Franklin Lakes, NJ, USA). Data were acquired using Cell Pro Quest and analyzed using FlowJo software (Becton Dickinson).
Oxidative stress analyses
To estimate production of reactive oxygen species (ROS), 80% confluent control and mutant cells were exposed to MitoSOX Red, a fluorochrome specific for anion superoxide produced in the inner mitochondrial compartment (Molecular Probes; Invitrogen) as described previously (10). Approximately 1 × 10⁶ cells were trypsinized, incubated with 1 ml of 5 μM MitoSOX for 20–30 min at 37°C in the dark, washed twice with PBS, and resuspended in 500 μl of PBS. Cytofluorometric analysis was performed using a FACSCalibur cell analyzer equipped with a 488-nm At-kt laser, and fluorescence was measured using the FL2 channel. Data were acquired using Cell Pro Quest and analyzed using FlowJo software.
MitoSOX intensity was also monitored by fluorescence microscopy (Olympus IX70 inverted system microscope; excitation/emission=550 nm/620 nm; Olympus, Tokyo, Japan). Cells grown on microscope slides in a 6-well plates for 24 h were incubated with MitoSOX for 20–30 min at 37°C, washed twice in PBS, fixed with 4% paraformaldehyde in PBS for 0.5–1 h at room temperature, and washed twice with PBS, incubated for 10 min at 37°C with MitoTracker Green (Molecular Probes; Invitrogen) to label mitochondria, and washed again before mounting (10). A control cell line treated with 0.5 mM antimycin A (complex III inhibitor) for 15 h before the MitoSOX staining was used as a positive control for increased ROS production.
To determine the level of oxidative damage of proteins, we performed Western blot analysis of carbonyl group content using the OxyBlot kit (Chemicon; Millipore Corp., Billerica, MA, USA) following the manufacturer's instructions (10). In brief, 20 μg of proteins were incubated with 2,4-dinitrophenylhydrazine to form 2,4-dinitrophenylhydrazone (DNP) derivatives. 2,4-Dinitrophenyl-derivatized proteins were separated on a 12% polyacrylamide gel and transferred to polyvinyl prolidone membranes for 30 min at 50 V in a Mini Trans-Blot cell apparatus (Bio-Rad Laboratories, Hercules, CA, USA). The blots were hybridized with rabbit anti-DNP antibody and goat anti-rabbit horseradish peroxidase-conjugated secondary antibody (Chemicon; Millipore) and visualized by autoradiography using SuperSignal West Dura extended duration substrate (Pierce, Rockford, IL, USA).
Blots were probed with an anti-calnexin antibody as a loading control. Quantitative analysis of the blots was carried out using ImageJ software (http://rsb.info.nih.gov/ij/).
For lipid peroxidation (LPO) measurements, confluent cells were collected in PBS from 15-cm plates using scrapers. After centrifugation at 3000 g for 5 min, cells were suspended in 20 mM Tris-HCl buffer, pH 7.4, containing 5 mM butylated hydroxytoluene and sonicated (power 3×10 s) to lyse the cells. To remove large particles, the samples were centrifuged at 3000 g for 10 min at 4°C. Aliquots of the supernatants were either stored at −80°C for total protein determination or used for LPO. A Bioxytech LPO-568 assay kit was used to determine both malondialdehyde and 4-hydroxyalkenals (Oxis International, Foster City, CA, USA). Concentrations of LPO were normalized per mg of protein (10).
Antioxidant defenses
Reduced and oxidized glutathione were measured using the GSH/GSSG Cuvette Assay (Oxford Biomedical Research, Oxford, MI, USA). Manganese superoxide dismutase (MnSOD) activity was measured using the NWLSS Superoxide Dismutase Activity Assay (Northwest Life Science Specialties, LLC, Vancouver, WA, USA)
Oxidative stress-induced death cell studies
After assessing cell viability in 7 mutant fibroblast lines incubated in galactose medium supplemented with regular FBS for 1 wk, further oxidative stress-induced cells death studies were performed only in COQ2 mutants. Cell viability was monitored by trypan blue. Numbers of living and dead cells were determined using a hemocytometer under a light microscope. Healthy nuclei from viable cells appeared round and phase bright, whereas nuclei from dead or dying cells appeared blue and irregularly shaped. All cells (∼1–2×10⁶) were counted, and results are expressed as ratio of dead vs. total cells (15).
We assessed the presence of apoptotic vs. necrotic cell death by staining control, P2, and P6 (COQ2 mutant) cells with 7-aminomycin (7-AAD) and PO-PRO-1 dye Vybrant apoptosis assay kits (Molecular Probes; Invitrogen). Cytofluorometric analysis was performed on a FACSCalibur cell analyzer. Data were acquired using Cell Pro Quest and analyzed using FlowJo software.
To confirm the presence of apoptosis, control, P2, and P6 fibroblasts were stained with 4′,6-diamidino-2-phenylindole (DAPI) (Molecular Probes, Invitrogen). Cells grown in 6-well plates were washed with PBS, fixed with 4% paraformaldehyde for 1 h at room temperature, washed with PBS, and stained with DAPI (1:100 in PBS) for 40 min at room temperature. After washing, cells were visualized using an LSM 510 NLO multiphoton confocal microscope (Carl Zeiss, Inc., Thornwood, NY, USA) with an Olympus Plan Neofluar ×100 objective (16).
To estimate mitochondrial membrane potential, control and P2 and P6 cells were exposed to TMRE as described above. To confirm the results of the TMRE staining and to determine mitochondrial integrity, cells were stained with MitoTracker Red (Molecular Probes; Invitrogen) for 30 min at 37°C, washed, and fixed with 4% paraformaldehyde for 1 h at room temperature. After washing, cells were visualized using an Olympus 1X70 microscope with an Olympus UPlanFI ×60 objective.
Mitochondrial DNA was quantified by real-time PCR using an ABI PRISM 7000 sequence detection system (Applied Biosystems, Foster City, CA, USA) as reported previously (5). Primers for mtDNA were forward, 5′-CCACGGGAAACAGCAGTGATT-3′ and reverse, 5′-CTATTGACTTGGGTTAATCGTGTGA-3′; the probe was FAM-TGCCAGCCACCGCG-MGB. TaqMan RNase P Control Reagents (Applied Biosystems) were used as primers and probes for nuclear DNA (17).
Statistical analysis
Control data are expressed as the means ± sd of 5 different samples in triplicate experiments. Patient data are expressed as the means ± sd of triplicate experiments. One-way ANOVA followed by a Student-Newman-Keuls multiple comparisons test was used. P < 0.05 was considered to be statistically significant.
RESULTS
CoQ10 levels
Skin fibroblasts from patients showed variable levels of CoQ10 deficiency, ranging from 18% of normal (P1, COQ9 mutant) to normal (P5, ADCK3 mutants), as reported previously (11–13). Intermediate deficiencies of CoQ10 were present in COQ2 mutant (P2) cells (36%) and in ADCK3 mutant (P3 and P4) cells (51 and 63%) (Table 1).
Cell growth
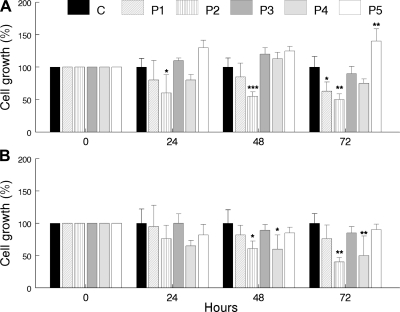
In galactose medium supplemented with regular FBS, growth was reduced in P2 (COQ2 mutant) cells after 24 h and in P1 (COQ9 mutant) cells after 72 h, but comparable to control cells in P3–P5 (ADCK3 mutant) cells (Fig. 2A). In galactose medium supplemented with dialyzed FBS (respiratory-dependent medium), growth was reduced in P2 (COQ2 mutant) and P4 (ADCK3 mutant) cells after 48 h (Fig. 2B).
Figure 2.
Cell growth rates over 24, 48, and 72 h in galactose medium supplemented with regular FBS (A) or galactose medium supplemented with dialyzed FBS (B). Values are means of ≥3 measurements. *P < 0.05, **P < 0.01, ***P < 0.001 vs. controls.
Mitochondria bioenergetic assessment
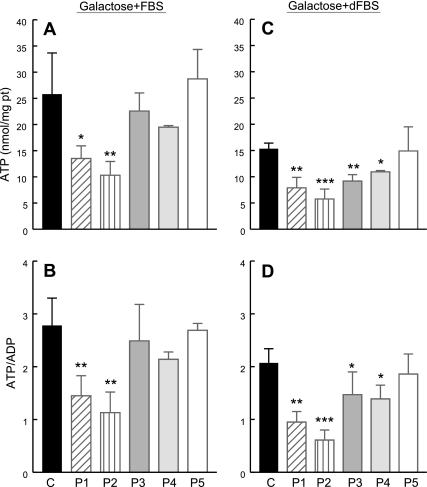
After 48 h in galactose medium supplemented with regular FBS, cells with the lowest CoQ10 levels, P1 (COQ9 mutant) and P2 (COQ2 mutant), showed decreased ATP levels and ATP/ADP ratios. In contrast, P3–P5 (ADCK3 mutant) cells showed normal ATP levels and ATP/ADP ratios (Fig. 3A). After 48 h in galactose medium supplemented with dialyzed FBS, all CoQ10-deficient fibroblasts, P1–P4 had low levels of ATP and ATP/ADP ratios, whereas P5, the fibroblast line with normal COQ10 levels, had normal ATP levels and ATP/ADP ratio (Fig. 3B). In both conditions (normal FBS and dialyzed FBS), P2 (COQ2 mutant) cells showed the lowest ATP levels and ATP/ADP ratios (Fig. 3).
Figure 3.
Adenine nucleotide levels in CoQ10-deficient skin fibroblasts and controls after 48 h in galactose medium supplemented with regular FBS (A, B) or dialyzed FBS (C, D). Values are means of ≥3 measurements. *P < 0.05, **P < 0.01, ***P < 0.001 vs. controls.
In galactose medium supplemented with regular FBS, quantitative analysis of TMRE staining demonstrated comparable mitochondrial membrane potentials in patient and control cells (Fig. 4A). In medium supplemented with dialyzed FBS, only P1 (COQ9 mutant) cells have a significantly reduced mitochondrial membrane potential (Fig. 4B).
Figure 4.
Assessment of mitochondrial membrane potential with TMRE in live cells cultured for 48 h in galactose medium with regular FBS (A) and dialyzed FBS (B). The y axis of the TMRE graph represents the relative percentage fluorescence intensity of each cell sample compared with control cells. Values are means of ≥3 measurements. *P < 0.05 vs. controls.
Oxidative stress analyses
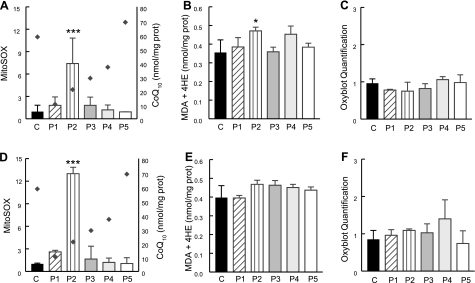
In cells incubated in galactose medium with regular FBS, quantitative analyses of MitoSOX Red and lipid peroxidation showed increased signal in only P2 (COQ2 mutant) cells compared with controls (Fig. 5A–C; Supplemental Fig. 1).
Figure 5.
Quantitation of MitoSOX staining by flow cytometry and oxidation of lipids and proteins in CoQ10-deficient skin fibroblasts and controls after 48 h in galactose medium with regular FBS (A–C) or dialyzed FBS (D–F). The y axis of the MitoSOX graphs represents the fluorescence intensities of MitoSOX cell samples relative to unstained fibroblasts (units listed on left y axis). Diamonds indicate cellular CoQ10 levels (units listed on right y axis). Values are means of ≥3 measurements. *P < 0.05, ***P < 0.001 vs. controls. MDA, malondialdehyde; 4HE, 4-hydroxyalkenals.
Supplementation of galactose medium with dialyzed FBS rather than regular FBS significantly increased matrix oxidant burden in P2 (COQ2 mutant) cells (Fig. 5D–F).
Antioxidant defenses
Assessment of the glutathione system did not show an altered proportion of oxidized glutathione (glutathione disulfide, GSSG) to total glutathione (GSH) in any mutant fibroblasts relative to controls (Supplemental Table 1). Assessment of the MnSOD activity showed a significant increase in P6 (COQ2 mutant) cells, trends toward elevated activities in cells with <51% CoQ10 levels (P1–P3 and P6), and no changes in P4 and P5 cells with >63% CoQ10 (Table 2).
Table 2.
MnSOD activity
| Patient | MnSOD |
|---|---|
| P1 | 1538 ± 14 |
| P2 | 1428 ± 504 |
| P3 | 1771 ± 147 |
| P4 | 1136 ± 44 |
| P5 | 1250 ± 176 |
| P6 | 2500 ± 544*** |
| P7 | 1803 ± 227 |
| Controls | 1197 ± 122 |
Data are means ± sd Experiments were performed in triplicate.
P < 0.001.
Oxidative stress-induced cell death studies
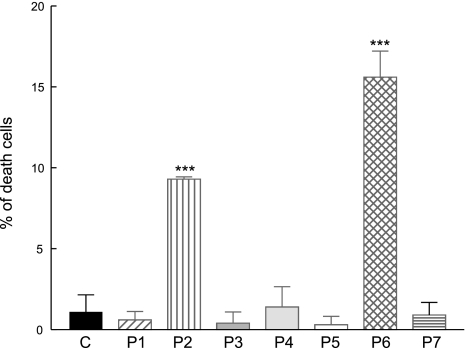
To assess the consequences of ROS production and oxidative stress in COQ2 mutant fibroblasts, which showed significantly increased MitoSOX staining, we studied cell viability after 1 wk of growth in galactose with regular FBS. Trypan blue staining showed higher proportions of dead cells in COQ2 mutant lines (P2 and P6) than in controls (Fig. 6).
Figure 6.
Trypan blue staining of CoQ10-deficient skin fibroblasts and controls after 1 wk in galactose medium with regular FBS. Bars represent means of ≥3 values. ***P < 0.001 vs. controls.
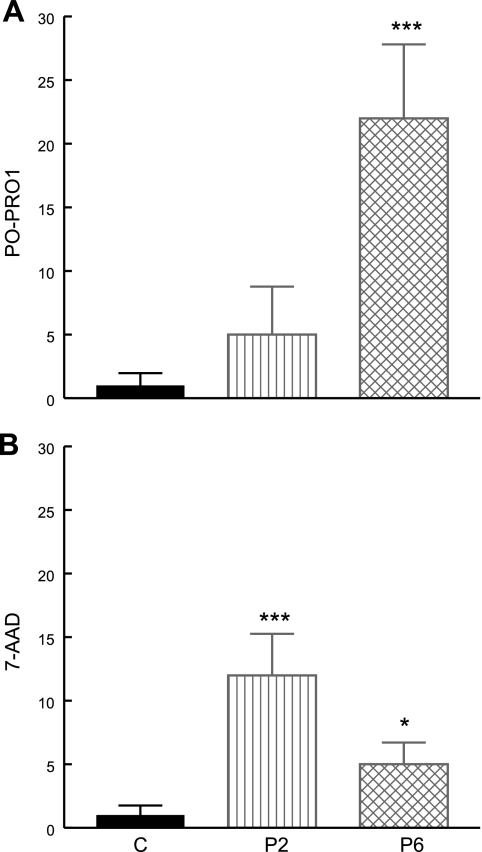
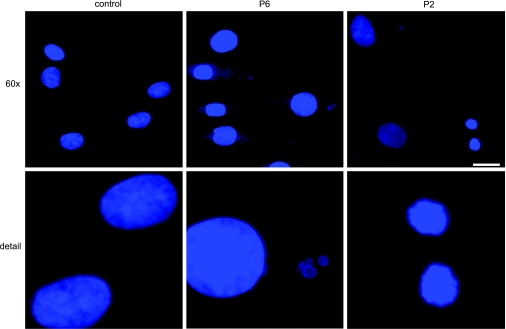
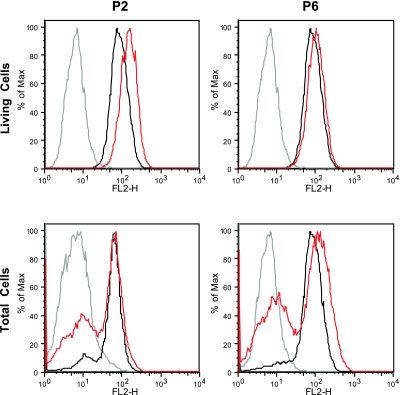
Quantitative analysis by flow cytometry of 7-AAD and PO-PRO-1 staining of the P2 and P6 cell lines showed increased proportions of both necrotic (increased 7-AAD in P2>P1) and apoptotic cells (increased PO-PRO-1 in P6) compared with controls (Fig. 7). In addition, apoptosis was supported by fluorescence microscopic imaging of DAPI-stained cells showing fragmentation of the nuclei in both P2 and P6 (Fig. 8). Quantitative analysis of TMRE staining showed that live P2 and P6 cells had normal or increased mitochondrial membrane potentials, whereas analysis of all cells, dead and alive, showed increased subsets of P2 and P6 cells with low mitochondrial membrane potential (i.e., dead cells) compared with controls (P2=40.3±10.8%, P6=57.7±3.5%, control=16.2±0.6%) (Fig. 9).
Figure 7.
Vybrant apoptosis assay was used to assess apoptosis (PO-PRO1; A) and necrosis (7-AAD; B) in COQ2 mutant fibroblasts after 1 wk in galactose medium supplemented with regular FBS. Bars represent means of ≥3 measurements. Red fluorescence 7-AAD labels necrotic cells. PO-PRO-1 dye, a violet-fluorescent nucleic acid stain, is permeant to apoptotic cells, but not live cells. *P < 0.05, ***P < 0.001 vs. controls.
Figure 8.
Morphology of nuclei by DAPI staining in COQ2 mutant fibroblasts after 1 wk in galactose medium supplemented with regular FBS. Normal nuclei are seen in the left upper and lower panels (control); fragmented nuclei are seen in P6 (center) and in P2 (right). Original view: top panels, ×60; bottom panels, ×200. Figure shows an experiment representative of ≥3 different experiments. Scale bar = 20 μm.
Figure 9.
Assessment of mitochondrial membrane potential by TMRE in COQ2 mutant fibroblasts after 1 wk in galactose medium supplemented with regular FBS. The y axis of the TMRE graph represents the fluorescence intensity of the samples (red trace, patients; black trace, controls) relative to the background intensity (gray trace, unstained fibroblasts). Values are means of ≥3 measurements.
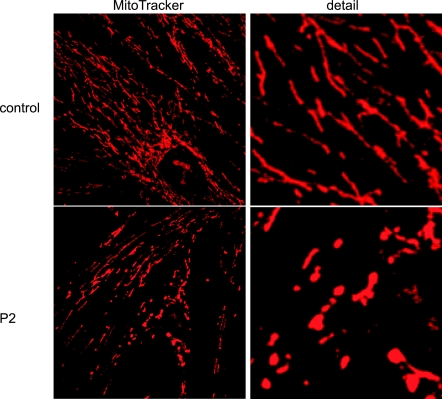
When analyzed by fluorescence microscopy using MitoTracker Red staining, P1, P3–P7, and control fibroblasts displayed the reticular mitochondrial network (data not shown) typical of cultured human cells with full mitochondrial bioenergetic function (16). In contrast, P2 comprised two morphologically distinct subpopulations of cells, most of which had normal reticular networks, whereas 25–30% showed blebbed and fragmented mitochondria (Fig. 10). This qualitative observation corresponds with the different membrane potentials shown in two P2 subpopulations by quantitative analysis of TMRE staining (Fig. 9) and suggests that the cells with lower membrane potential have blebbed, fragmented mitochondria.
Figure 10.
Mitochondria morphology by MitoTracker Red in COQ2 mutant cells after 1 wk in galactose medium supplemented with regular FBS. Top panels: normal reticular mitochondria (control). Bottom panels: abnormal blebbed and fragmented mitochondria (P2). Original detail view: ×100 (right panels). Figure shows an experiment representative of ≥3 different experiments.
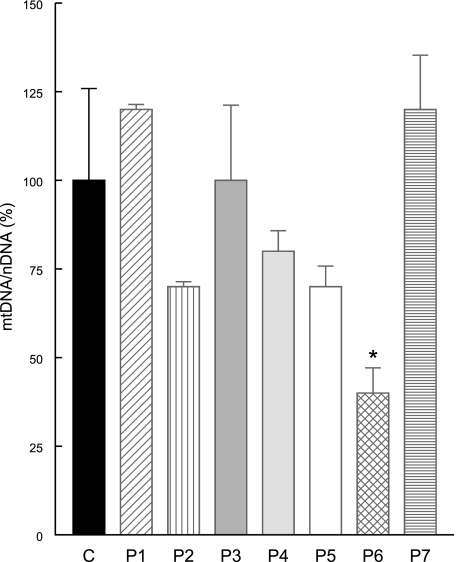
Because oxidative stress can cause loss of mitochondrial DNA (mtDNA) due to 8-oxoguanosine accumulation and impaired mtDNA damage repair (18, 19), we performed real-time PCR to quantify mtDNA and we did observe significant depletion of mtDNA in P6 (Fig. 11).
Figure 11.
Quantitative real-time PCR showing mtDNA depletion in P6 fibroblasts after 1 wk in galactose medium supplemented with regular FBS. Bars represent means ± sd of ≥3 experiments. *P < 0.05 vs. controls.
DISCUSSION
Increasing numbers of patients with CoQ10 deficiency and harboring distinct mutations in CoQ10 biosynthetic genes are being reported (6), but little is known about the pathophysiology of the disorders. Our previous studies in cell lines harboring COQ2 and PDSS2 mutations (P6 and P7 cells in this report) showed that these two molecular defects are associated with different mitochondria bioenergetic and oxidative stress phenotypes when cultured in galactose medium (10). We demonstrated that the PDSS2 mutant fibroblasts with severe CoQ10 deficiency (12% of controls) had marked reductions in CII + III activity (28% of controls) and ATP synthesis (50% of controls), but no increase in ROS production or antioxidant defense markers, whereas COQ2 mutant fibroblasts with milder CoQ10 deficiency (30% of controls) had significantly increased ROS production and oxidation of lipids and proteins (10). To better understand the relationship between level of CoQ10, increases in ROS production, and pathogenic mechanisms, we studied 5 additional fibroblast lines with varying degrees of CoQ10 deficiency caused by mutations in 3 different genes (COQ2, ADCK3/CABC1, and COQ9) in galactose medium.
Our results in a new COQ2 mutant cell line confirm our previous findings that mutations in this gene cause significant CoQ10 deficiency (36% of normal) and, when the cells are dependent on oxidative phosphorylation, reduced ATP level and ATP/ADP ratio, increased ROS production and oxidative stress, and impaired cell growth (Table 1). In contrast, COQ9 mutant fibroblasts showed characteristics similar to those we observed in PDSS2 mutant cells exposed to respiratory-dependent medium: severe CoQ10 deficiency (18% of normal) with markedly decreased aerobic ATP synthesis, but no signs of oxidative damage to proteins or lipids and normal growth. A different pattern was shown by 2 of the 3 cell lines with ADCK3 mutations and moderate CoQ10 deficiency (51 and 63%). In respiratory-dependent medium only, these cells revealed reduced ATP and ATP/ADP ratios as well as slightly increased ROS and protein and lipid peroxidation. The third fibroblast line with ADCK3 mutations had a normal CoQ10 concentration and showed no signs of bioenergetic or oxidative stress dysfunction (Table 1). Taken together, these results confirm our prior observation that cultured fibroblasts with severe CoQ10 deficiency (<20% of normal) have marked bioenergetic defects without significant oxidative stress, whereas intermediate CoQ10 deficiency (30–40% of normal) causes moderate bioenergetic defects but marked increases in ROS production and lipid oxidation that correlate with increased cell death. Not too surprisingly, cells with residual CoQ10 levels >60% have neither increased ROS production nor oxidative damage.
In further support of our conclusion that partial CoQ10 deficiency causes oxidative stress is the observation that Pdss2kd/kd mutant mice showed partial CoQ deficiency in the kidney during the period of symptomatic nephrotic syndrome without significant decreases in biochemical activities of CoQ-dependent respiratory chain enzymes (complexes I+III and II+III) (20, 21). Furthermore, CoQ supplementation seemed to rescue the renal phenotype by acting as an antioxidant (21).
In both COQ2 mutant cell lines, markers of oxidative stress were associated with increased cell death with features of apoptosis and necrosis. These may represent different processes or different stages of the same process (22–24). Despite differences in cell death pathways, both COQ2 mutant fibroblasts showed increases in ROS production and oxidative stress associated with normal mitochondrial membrane potential (after 48 h in galactose), and, subsequently, live cells showed normal or slightly increased mitochondrial membrane potentials, whereas other cells showed mitochondrial membrane depolarization and cell death (after 1 wk in galactose). Based on these results, we hypothesize that subsets of CoQ10-deficient cells with increased ROS, morphologically abnormal mitochondria, and decreased mitochondrial membrane potentials may be shifting to a low mitochondrial energy state and eventual death. The protective effects of antioxidants against superoxide production and cell death support the notion that ROS production triggers cell death (unpublished results).
Hyperpolarization of mitochondria and increased cell death have been observed in cultured cells with complex I deficiencies (25, 26). It has been suggested that, under these circumstances, ATP synthase is hydrolyzing rather than synthesizing ATP before decompensation with collapse of the membrane potential (25, 26).
Our experiments, as well as work from other groups, suggest that oxidative stress is not the sole deleterious factor in the pathogenesis of CoQ10 deficiency. Geromel et al. (7) reported impaired mitochondrial bioenergetics but no signs of oxidative stress or apoptosis in fibroblasts with severe CoQ10 deficiency of unknown origin, similar to our prior findings that fibroblasts with 13% CoQ10 (P7 PDSS2 mutant fibroblasts) do not have oxidative stress but have marked bioenergetic defects (10). We have now confirmed these findings in COQ9 mutants under the same or even more stressful conditions (galactose medium supplemented with dialyzed FBS). Although it is not surprising that severe CoQ10 deficiencies in COQ9 and PDSS2 mutant cells are associated with marked bioenergetic defects, unexpectedly, both cell lines show normal growth after 1 wk in respiratory-dependent medium (unpublished results). Resilience of cells with severe CoQ10 deficiency may be explained, in part, by the observation that lack of the mitochondrial respiratory chain (and possibly severe respiratory chain deficiencies) confers resistance to mitochondrial and endoplasmic reticulum stress-induced apoptosis, compared with partial blockage of respiratory chain electron flux that is associated with heightened sensitivity to death pathways (27–29).
To explain the absence of oxidative stress and cell death in PDSS2, COQ9, and ADCK3 mutant fibroblasts, we must consider the roles of tissue-specific effects, including a possible resistance of cultured skin fibroblasts to the effects of CoQ10 deficiency. Furthermore, as we have compared fibroblasts with different molecular defects, factors other than CoQ10 deficiency may be contributing to their phenotype. PDSS2 and COQ2 mutants are defective in the genes encoding enzymes required for the first two dedicated steps of CoQ10 biosynthesis, whereas the functions of ADCK3/CABC1 and COQ9 are still unclear. ADCK3/CABC1 is a putative protein kinase, and the yeast homolog, Coq8p, may phosphorylate Coq3p (30). In Saccharomyces cerevisiae, Coq9p has been characterized as a mitochondrial protein that may catalyze a reaction in the ubiquinone biosynthetic pathway or may have a regulatory role similar to that of coq8 (ADCK3) (31). Thus, defects of different components of ubiquinone biosynthesis may produce divergent effects due to accumulation of alternative metabolites or alternative functions of the defective protein.
In summary, our observations reveal the diverse biochemical consequences of CoQ10 deficiency in cells and suggest that oxidative stress plays an important role in the demise of COQ2 mutant fibroblasts by activating cell death-related pathways. Our findings in CoQ10-deficient cells also indicate that partial CoQ10 deficiency (30–40% of normal), leading to moderately reduced activity of the respiratory chain is more deleterious than a severe respiratory chain deficiency for some cellular functions, as described previously in other models of respiratory chain defects (32, 33). Further elucidation of the pathological mechanism of CoQ10 deficiency may lead to more rational therapeutic approaches in patients with different genetic CoQ10 deficiencies and shed light on the pathogenesis of neurological diseases in which ROS production and mitochondrial dysfunction have been implicated.
Supplementary Material
Acknowledgments
This work was supported by U.S. National Institutes of Health (NIH) grant HD32062. M.H. is also supported by grants from the NIH (NS11786), the Muscular Dystrophy Association, and the Marriott Mitochondrial Disorder Clinical Research Fund (MMDCRF). C.M.Q. was supported by the Muscular Dystrophy Association. L.C.L. was supported by a postdoctoral fellowship from the Ministerio de Educación y Ciencia, Spain. L.S. is supported by Telethon grant GGP09207.
REFERENCES
- 1.Kawamukai M. (2009) Biosynthesis and bioproduction of coenzyme Q10 by yeasts and other organisms. Biotechnol. Appl. Biochem. 53, 217–226 [DOI] [PubMed] [Google Scholar]
- 2.Turunen M., Olsson J., Dallner G. (2004) Metabolism and function of coenzyme Q. Biochim. Biophys. Acta 1660, 171–199 [DOI] [PubMed] [Google Scholar]
- 3.Bentinger M., Brismar K., Dallner G. (2007) The antioxidant role of coenzyme Q. Mitochondrion 7(Suppl.), S41–S50 [DOI] [PubMed] [Google Scholar]
- 4.Lopez L. C., Schuelke M., Quinzii C. M., Kanki T., Rodenburg R. J., Naini A., DiMauro S., Hirano M. (2006) Leigh syndrome with nephropathy and CoQ10 deficiency due to decaprenyl diphosphate synthase subunit 2 (PDSS2) mutations. Am. J. Hum. Genet. 79, 1125–1129 [DOI] [PMC free article] [PubMed] [Google Scholar]
- 5.Quinzii C., Naini A., Salviati L., Trevisson E., Navas P., DiMauro S., Hirano M. (2006) A mutation in para-hydroxybenzoate-polyprenyl transferase (COQ2) causes primary coenzyme Q10 deficiency. Am. J. Hum. Genet. 78, 345–349 [DOI] [PMC free article] [PubMed] [Google Scholar]
- 6.Quinzii C. M., López L. C., Naini A., DiMauro S., Hirano M. (2008) Human CoQ10 deficiencies. Biofactors 32, 113–118 [DOI] [PMC free article] [PubMed] [Google Scholar]
- 7.Geromel V., Kadhom N., Ceballos-Picot I., Chretien D., Munnich A., Rötig A., Rustin P. (2001) Human cultured skin fibroblasts survive profound inherited ubiquinone depletion. Free Radic. Res. 35, 11–21 [DOI] [PubMed] [Google Scholar]
- 8.Lopez-Martin J. M., Salviati L., Trevisson E., Montini G., DiMauro S., Quinzii C., Hirano M., Rodriguez-Hernandez A., Cordero M. D., Sanchez-Alcazar J. A., Santos-Ocana C., Navas P. (2007) Missense mutation of the COQ2 gene causes defects of bioenergetics and de novo pyrimidine synthesis. Hum. Mol. Genet. 16, 1091–1097 [DOI] [PMC free article] [PubMed] [Google Scholar]
- 9.Rodríguez-Hernández A., Cordero M. D., Salviati L., Artuch R., Pineda M., Briones P., Gómez Izquierdo L., Cotán D., Navas P., Sánchez-Alcázar J. A. (2009) Coenzyme Q deficiency triggers mitochondria degradation by mitophagy. Autophagy 5, 19–32 [DOI] [PubMed] [Google Scholar]
- 10.Quinzii C. M., Lopez L. C., Von-Moltke J., Naini A., Krishna S., Schuelke M., Salviati L., Navas P., DiMauro S., Hirano M. (2008) Respiratory chain dysfunction and oxidative stress correlate with severity of primary CoQ10 deficiency. FASEB J. 22, 1874–1885 [DOI] [PMC free article] [PubMed] [Google Scholar]
- 11.Diomedi-Camassei F., Di Giandomenico S., Santorelli F. M., Caridi G., Piemonte F., Montini G., Ghiggeri G. M., Murer L., Barisoni L., Pastore A., Muda A. O., Valente M. L., Bertini E., Emma F. (2007) COQ2 nephropathy: a newly described inherited mitochondriopathy with primary renal involvement. J. Am. Soc. Nephrol. 18, 2773–2780 [DOI] [PubMed] [Google Scholar]
- 12.Lagier-Tourenne C., Tazir M., Lopez L. C., Quinzii C. M., Assoum M., Drouot N., Busso C., Makri S., Ali-Pacha L., Benhassine T., Anheim M., Lynch D. R., Thibault C., Plewniak F., Bianchetti L., Tranchant C., Poch O., DiMauro S., Mandel J. L., Barros M. H., Hirano M., Koenig M. (2008) ADCK3, an ancestral kinase, is mutated in a form of recessive ataxia associated with coenzyme Q10 deficiency. Am. J. Hum. Genet. 82, 661–672 [DOI] [PMC free article] [PubMed] [Google Scholar]
- 13.Duncan A. J., Bitner-Glindzicz M., Meunier B., Costello H., Hargreaves I. P., Lopez L. C., Hirano M., Quinzii C. M., Sadowski M. I., Hardy J., Singleton A., Clayton P. T., Rahman S. (2009) A nonsense mutation in COQ9 causes autosomal-recessive neonatal-onset primary coenzyme Q10 deficiency: a potentially treatable form of mitochondrial disease. Am. J. Hum. Genet. 84, 558–566 [DOI] [PMC free article] [PubMed] [Google Scholar]
- 14.Robinson B. H., Petrova-Benedict R., Buncic J. R., Wallace D. C. (1992) Nonviability of cells with oxidative defects in galactose medium: a screening test for affected patient fibroblasts. Biochem. Med. Metab. Biol. 48, 122–126 [DOI] [PubMed] [Google Scholar]
- 15.Blanchard-Fillion B., Prou D., Polydoro M., Spielberg D., Tsika E., Wang Z., Hazen S. L., Koval M., Przedborski S., Ischiropoulos H. (2006) Metabolism of 3-nitrotyrosine induces apoptotic death in dopaminergic cells. J. Neurosci. 26, 6124–6130 [DOI] [PMC free article] [PubMed] [Google Scholar]
- 16.Gilkerson R. W., Margineantu D. H., Capaldi R. A., Selker J. M. (2000) Mitochondrial DNA depletion causes morphological changes in the mitochondrial reticulum of cultured human cells. FEBS Lett. 474, 1–4 [DOI] [PubMed] [Google Scholar]
- 17.Nishigaki Y., Martí R., Hirano M. (2004) ND5 is a hot-spot for multiple atypical mitochondrial DNA deletions in mitochondrial neurogastrointestinal encephalomyopathy. Hum. Mol. Genet. 13, 91–101 [DOI] [PubMed] [Google Scholar]
- 18.Oka S., Ohno M., Tsuchimoto D., Sakumi K., Furuichi M., Nakabeppu Y. (2008) Two distinct pathways of cell death triggered by oxidative damage to nuclear and mitochondrial DNAs. EMBO J. 27, 421–432 [DOI] [PMC free article] [PubMed] [Google Scholar]
- 19.Shokolenko I., Venediktova N., Bochkareva A., Wilson G. L., Alexeyev M. F. (2009) Oxidative stress induces degradation of mitochondrial DNA. Nucleic Acids Res. 37, 2539–2548 [DOI] [PMC free article] [PubMed] [Google Scholar]
- 20.Peng M., Falk M. J., Haase V. H., King R., Polyak E., Selak M., Yudkoff M., Hancock W. W., Meade R., Saiki R., Lunceford A. L., Clarke C. F., Gasser D. L. (2008) Primary coenzyme Q deficiency in Pdss2 mutant mice causes isolated renal disease. PLoS Genet. 4, e1000061. [DOI] [PMC free article] [PubMed] [Google Scholar]
- 21.Saiki R., Lunceford A. L., Shi Y., Marbois B., King R., Pachuski J., Kawamukai M., Gasser D. L., Clarke C. F. (2008) Coenzyme Q10 supplementation rescues renal disease in Pdss2kd/kd mice with mutations in prenyl diphosphate synthase subunit 2. Am. J. Physiol. Renal Physiol. 295, F1535–F1544 [DOI] [PMC free article] [PubMed] [Google Scholar]
- 22.Green D. R., Reed J. C. (1998) Mitochondria and apoptosis. Science 281, 1309–1312 [DOI] [PubMed] [Google Scholar]
- 23.Kroemer G., Reed J. C. (2000) Mitochondrial control of cell death. Nat. Med. 6, 513–519 [DOI] [PubMed] [Google Scholar]
- 24.Krysko D. V., Vanden Berghe T., Parthoens E., D'Herde K., Vandenabeele P. (2008) Methods for distinguishing apoptotic from necrotic cells and measuring their clearance. Methods Enzymol. 442, 307–341 [DOI] [PubMed] [Google Scholar]
- 25.Abramov A. Y., Smulders-Srinivasan T. K., Kirby D. M., Acin-Perez R., Enriquez J. A., Lightowlers R. N., Duchen M. R., Turnbull D. M. (2010) Mechanism of neurodegeneration of neurons with mitochondrial DNA mutations. Brain 133, 797–807 [DOI] [PMC free article] [PubMed] [Google Scholar]
- 26.McKenzie M., Liolitsa D., Akinshina N., Campanella M., Sisodiya S., Hargreaves I., Nirmalananthan N., Sweeney M. G., Abou-Sleiman P. M., Wood N. W., Hanna M. G., Duchen M. R. (2007) Mitochondrial ND5 gene variation associated with encephalomyopathy and mitochondrial ATP consumption. J. Biol. Chem. 282, 36845–36852 [DOI] [PubMed] [Google Scholar]
- 27.Dey R., Moraes C. T. (2000) Lack of oxidative phosphorylation and low mitochondrial membrane potential decrease susceptibility to apoptosis and do not modulate the protective effect of Bcl-xL in osteosarcoma cells. J. Biol. Chem. 275, 7087–7094 [DOI] [PubMed] [Google Scholar]
- 28.Lee M. S., Kim J. Y., Park S. Y. (2004) Resistance of rho0 cells against apoptosis. Ann. N. Y. Acad. Sci. 1011, 146–153 [DOI] [PubMed] [Google Scholar]
- 29.Park S. Y., Chang I., Kim J. Y., Kang S. W., Park S. H., Singh K., Lee M. S. (2004) Resistance of mitochondrial DNA-depleted cells against cell death: role of mitochondrial superoxide dismutase. J. Biol. Chem. 279, 7512–7520 [DOI] [PubMed] [Google Scholar]
- 30.Tauche A., Krause-Buchholz U., Rodel G. (2008) Ubiquinone biosynthesis in Saccharomyces cerevisiae: the molecular organization of O-methylase Coq3p depends on Abc1p/Coq8p. FEMS Yeast Res. 8, 1263–1275 [DOI] [PubMed] [Google Scholar]
- 31.Johnson A., Gin P., Marbois B. N., Hsieh E. J., Barros M. H., Clarke C. F., Tzagoloff A. (2005) COQ9, a new gene required for the biosynthesis of coenzyme Q in Saccharomyces cerevisiae. J. Biol. Chem. 280, 397–404 [DOI] [PubMed] [Google Scholar]
- 32.Baracca A., Sgarbi G., Mattiazzi M., Casalena G., Pagnotta E., Valentino M. L., Moggio M., Lenaz G., Carelli V., Solaini G. (2007) Biochemical phenotypes associated with the mitochondrial ATP6 gene mutations at nt8993. Biochim. Biophys. Acta 1767, 913–919 [DOI] [PubMed] [Google Scholar]
- 33.Barrientos A., Moraes C. T. (1999) Titrating the effects of mitochondrial complex I impairment in the cell physiology. J. Biol. Chem. 274, 16188–16197 [DOI] [PubMed] [Google Scholar]
Associated Data
This section collects any data citations, data availability statements, or supplementary materials included in this article.


