

Abstract
Purpose
To propose and test the feasibility of a novel method for quantifying 3-D regional pulmonary kinematics from hyperpolarized helium-3 tagged MRI in human subjects using a tailored image processing pipeline and a recently developed nonrigid registration framework.
Materials and Methods
Following image acquisition, inspiratory and expiratory tagged helium-3 MR images were preprocessed using various image filtering techniques to enhance the tag surfaces. Segmentation of the three orthogonal sets of tag planes in each lung produced distinct point-set representations of the tag surfaces. Using these labeled point-sets, deformation fields and corresponding strain maps were obtained via nonrigid point-set registration. Kinematic analysis was performed on three volunteers.
Results
Tag lines in inspiratory and expiratory images were co-registered producing a continuous 3-D correspondence mapping. Average displacement and directional strains were calculated in three subjects in the inferior, mid, and superior portions of the right and left lungs. As expected, the predominant direction of displacements with expiration is from inferior to superior.
Conclusion
Kinematic quantitation of pulmonary motion using tagged helium-3 MRI is feasible using the applied image preprocessing filtering techniques and nonrigid point-set registration. Potential benefits from regional pulmonary kinematic quantitation include the facilitation of diagnosis and local assessment of disease progression.
Keywords: helium-3, registration, pulmonary kinematics, tagging
Quantification of cyclical respiratory lung deformation using MRI enables in vivo assessment of lung physiology with high spatiotemporal resolution. Several studies have demonstrated the effects of lung disease on the compliance of the lung, some globally and others regionally (1,2). Such studies assume that determination of the mechanical characteristics of the lungs may facilitate the diagnosis of the severity of disease and the predicted extent of recovery in the afflicted lung. Recent developments in lung MRI using hyperpolarized helium-3 and MR tagging techniques have paved novel investigatory avenues for quantifying pulmonary kinematics (3-6).
Invented in the late 1980’s, magnetic resonance tagging techniques have proven useful for the noninvasive visualization of the dynamic behavior of transmural myocardial tissue (7,8). Such techniques are invaluable for researching the effects of myocardial diseases on cardiac function. At a specific time point of the cardiac cycle saturation patterns are generated within the myocardium using selective radiofrequency excitation, typically at end-diastole. These saturation patterns are typically arranged in thin planar regions of the myocardium perpendicular to the imaging planes and generally last through systole and most, if not all, of diastole. Such planes of hypointense signal are known as tag planes. Imaging geometry permits visualization of myocardial contractility via the set of tag plane / imaging plane intersections known as tag lines.
Application of tagging technology to the lungs is difficult due to technical issues associated with conventional proton lung MRI, such as the low proton density of inflated lung tissue. Attempting to overcome such difficulties, a fast sequence was developed in which tag lines demonstrate greater permanency and contrast than conventional tagging sequences (9). Similar work using a modified SPAMM sequence was used to calculate regional measurements during respiration (10). However, identical MR technical issues (e.g. low proton density and local magnetic field inhomogeneities) limit the analysis to relatively short periods and to two dimensions.
In contrast, hyperpolarized helium-3 MR lung imaging does not suffer from the same technical difficulties as conventional MR lung imaging making it possible to visualize pulmonary deformation over the end-inspiration-to-end-expiration portion of the respiratory cycle (3). However, tagged helium-3 MRI of the lung is characterized by indistinct boundaries with no reliable anatomical features. Thus tracking of the tagging features is essential for reliable calculation of kinematic quantities.
Original forays into developing motion tracking algorithms for tagged pulmonary hyperpolarized helium-3 imaging data were limited primarily to 2-D analysis in considering only the correspondences between grid centers of subsequent frames for interpolating a continuous deformation field (4-6). We propose a new framework for assessing pulmonary deformation from tagged helium-3 MRI using various image processing techniques in conjunction with a recently developed non-rigid point-set registration framework.
MATERIALS AND METHODS
Given two configurations of a deformable body, such as the lung, extraction of kinematic quantities requires the establishment of a continuous mapping between the two configurations. Figure 1 illustrates two sample tagged helium-3 MR coronal slices at end-inspiration and end-expiration extracted from their corresponding image volumes. A continuous transformation between the two configurations is established by finding the correspondence between the sets of tag planes in the end-inspiratory/end-expiratory image pair where the end-inspiratory phase image serves as the reference configuration.
Figure 1.
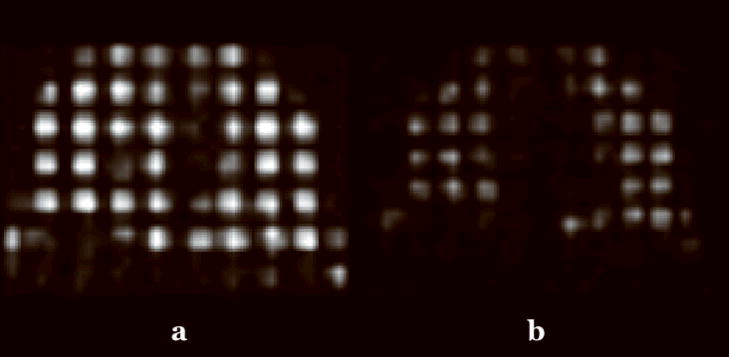
Mid-coronal tagged helium-3 images at (a) inspiration and (b) expiration from a normal human volunteer.
The basic processing pipeline consists of five major steps. Following image acquisition, image processing techniques (detailed below) are applied to the end-inspiratory images for segmentation of both right and left lungs in addition to all three sets of tag planes. Second, each individual lung at end-expiration is registered to its corresponding configuration at end-inspiration using an affine transformation. The registered end-expiratory images are then passed through the same image processing pipeline originally applied to the end-inspiratory images to segment the three sets of expiratory tag planes. Using a non-rigid point set registration framework, the deformed end-expiratory images are registered to the end-inspiratory images. Finally, the composition of the transformations provides a total deformation field from which kinematic quantities, such as strain and displacement, are calculated.
Image Acquisition
Three subjects participated in this feasibility study approved by the local institutional review board. Imaging with hyperpolarized helium-3 was performed under a physician’s Investigational New Drug application (IND 57866) with informed consent obtained from each subject. Subject 1 was a normal male. Subject 2 was a diagnosed asthmatic. Subject 3 was a female who had previously undergone right lung transplant for advanced pulmonary fibrosis and thus had a normal right lung and a fibrotic left lung. MR imaging was performed using a 1.5 T whole-body scanner (Siemens Sonata), and helium-3 gas was polarized to approximately 40% using a commercial system (Model 9600, MITI). Following inhalation of a 1 L mixture of ~400 ml hyperpolarized helium-3 and ~600 ml N2, 3-D tagging grids were created at maximum inspiration by applying sinc-modulated RF-pulse trains consecutively along all three principal axes. Tag spacing was 22 mm. The grid-tagging preparation was applied first, followed by a FLASH-based 3-D image acquisition at full inspiration with the following parameters: TR/TE = 2.0/ 0.7 ms; FOV= 340×280×198 mm; matrix = 64×64×22; flip angle = 1°. The subject was then instructed to exhale completely, and the FLASH-based acquisition was repeated following a pause of 2-3 seconds. Total scan time was 7.4 seconds. The short TE of the FLASH sequence was achieved by using the asymmetric readout, yielding a partial k-space acquisition.
Image Preprocessing
A flowchart describing the algorithmic workflow used to preprocess the end-inspiratory images and warped end-expiratory images is illustrated in Figure 2. The end-inspiratory image is initially filtered via the image preprocessing pipeline. First, a retrospective bias field correction algorithm, known as N3 (nonparametric nonuniform intensity normalization) (11, 12), is used to correct potential bias field effects in the hyperpolarized helium-3 images caused by instrumentation issues such as RF nonuniformity, static field inhomogeneity, and/or subject motion.
Figure 2.
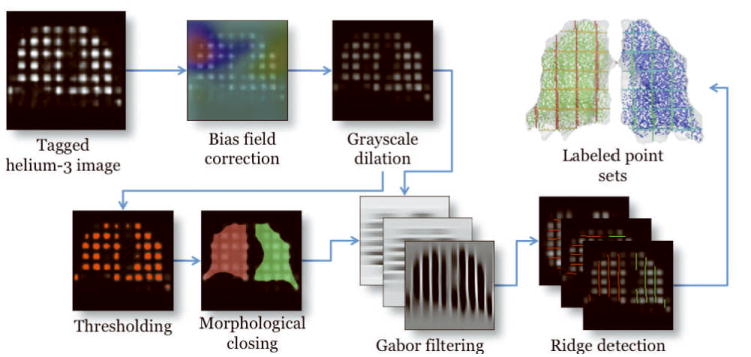
Image preprocessing pipeline illustrating the algorithmic workflow from the acquired tagged helium-3 image to the labeled point sets which are used for non-rigid registration.
Following bias field correction, a grayscale dilation operation with a 3 × 3 × 3 cubic structuring element is applied to the end-inspiratory image (13). Sample results are illustrated in Figure 2. This operation smoothes out the intensity peaks associated with each tagging grid element and accentuates the cubic structure of each element. The output of the grayscale dilation operation is automatically thresholded (14) to separate the grid elements from the image background. This is an intermediate step to creating a lung mask which labels the right and left lungs.
A binary morphological closing operation with a ball structuring element of radius 5 voxels is used to join the segmented tagging elements (13). Due to the anatomical proximity of the anterior portions of the right and left lungs, this step might result in a single connected component. To ensure a separation of the right and left lungs, we perform the following set of operations on each image. Starting at the apex of the lung we proceed in the axial direction processing each individual axial slice. At each axial slice, the minimum path separating the image into two left/right components is found (15). The technique discussed in (16) is used to fit a smooth surface to all the minimum axial paths. This surface is used to separate and identify the right and left lungs.
Once the right and left lung image masks have been identified, the tag planes are subsequently segmented. A Gabor filter bank strategy (17) originally used for cardiac MRI is used to accentuate the tag planar structures in the three orthogonal directions (one for each tagging direction) in the grayscale dilation image. Hard segmentations of the tag planes are obtained by finding the zero-crossings of the first derivative of the filtered image in each of the three tag plane directions. The result is a set of labeled sampled points corresponding to the three orthogonal tag planes for both the right and left lungs. Sample results of this segmentation are shown in Figure 2.
As mentioned previously, the set of points for the end-expiratory image is obtained in identical fashion using the previously described algorithmic pipeline. However, this is preceded by a piecewise affine image registration where each lung of the end-expiratory image is warped to the corresponding lung of the end-inspiratory image. The two affine registrations are combined into a single quasi piecewise affine deformation by fitting to a single B-spline deformation field (18) which “pulls” the end-expiratory images into the space of the end-inspiratory images. These warped end-expiratory images are then processed through the same pipeline discussed in the previous section to obtain the corresponding segmented tag planes.
Non-rigid Lung Registration
At this stage there are three sets of tag planes for each lung for both the end-inspiratory and quasi-affine warped end-expiratory images producing two point sets for subsequent registration. Each point set is comprised of six labels (three labels corresponding to the axial, coronal, and sagittal for the right lung and the left lung) to which we apply a labeled point set registration algorithm developed by Tustison et al (18) which has also been made publicly available (19). This algorithm is based on the Jensen-Havrda-Charvat-Tsallis (JHCT) divergence which provides a similarity measure between two probability density functions (PDF). Each point set is modeled as a PDF via a Gaussian mixture model. Given a point set representing a set of tag planes defined by N points, X = {x1, x2,…, xN }, the corresponding PDF is defined as
| [1] |
where is a normalized Gaussian with mean and covariance evaluated at s. The JHCT divergence is calculated from K PDFs as follows:
| [2] |
where Hα (·) is the Havrda-Charvat-Tsallis entropy defined by
| [3] |
The prior weight, γk, of the kth point set is defined to be the ratio of the number of points in that point set to the total number of points.
The JHCT divergence measure and the transformation model are used to bring the tag planes into correspondence. The transformation model is a variant of the widely used free-form deformation approach, known as directly manipulated free-form deformation (20). This transformation model, composed with the affine transformation, provides a continuous mapping describing the non-rigid deformation of the lungs occurring between inspiration and expiration. Sample results showing the alignment before and after of a single set of tag lines in a coronal slice are given in Figure 3.
Figure 3.

Sample registration results for Subject 1. (a) Coronal view showing the misalignment of the tag lines at end-inspiration with the tag lines at end-expiration superimposed. The green and red lines denote the tag lines at end-expiration in the right and left lungs, respectively, whereas the grey lines correspond to end-inspiration. (b) After registration the tag lines are in correspondence.
Strain Calculation
Once the deformation field has been obtained from the point set registration, local strain is calculated from the deformation field. The 3-D deformation gradient tensor, F, is calculated using
| [4] |
where the displacement mapping, χ(μ, ν, ω), relates the coordinates of a material point at end-inspiration to its coordinates at end-expiration. From the deformation gradient tensor, the Lagrangian strain tensor, E, is then given by
| [5] |
where I is the identity matrix and T is the transpose operator. Calculation of the quantity nTEn provides the values of the normal strain given in the direction of the unit vector n.
RESULTS
Mid-coronal displacement fields for Subject 1, Subject 2, and Subject 3 are illustrated in Figure 4. As expected, the predominant direction of displacements occurring with expiration is from inferior to superior. There is a gradient of the magnitude of the displacement from inferior to superior with greater displacements near the diaphragm which moves significantly during respiration and lesser displacements near the apex.
Figure 4.

Frontal views of mid-coronal slices of the displacement fields for (a) Subject 1 (normal), (b) Subject 2 (asthmatic), and (c) Subject 3 (advanced pulmonary fibrosis with right lung transplant). The color bar indicates the magnitude of the displacement in millimeters.
Mean displacements were calculated from the total displacement fields in the superior, middle, and inferior portions of the lungs where the height of each of the three regions is derived from an equal partitioning of the distance between the extreme basal and apical points of the lung. These values are given in Table 1. In agreement with all the subjects, Subject 1 (normal) exhibited a decrease in mean displacement value in the apex of the lung relative to the mid and superior regions. However, the difference of the mean displacement values between the superior and inferior regions in both the right and left lungs (respectively 3.7 mm and 7.9 mm) was less than that of Subject 2 (asthmatic) who had a range of differences in mean displacement values of 20.2 mm and 18.1 mm in the right and left lungs, respectively. This was also the case when comparing the difference in mean displacement values between the superior and inferior portions of the lungs in Subject 1 with Subject 3 (idiopathic pulmonary fibrosis with right lung transplant) who exhibited a range in the right lung of 32.1 mm and in the left lung of 24.0 mm.
Table 1.
Average (± standard deviation) of kinematic quantities for Subject 1, Subject 2, and Subject 3 in the superior (sup.), mid, and inferior (inf.) portions of the left and right lungs.
| Displacement | Strain, εxx | Strain, εyy | Strain, εzz | ||||||
|---|---|---|---|---|---|---|---|---|---|
| Right | Left | Right | Left | Right | Left | Right | Left | ||
| Subject 1 | Sup. | 11.5±4.1 | 12.7±5.9 | 0.01±0.02 | 0.002±0.02 | 0.03±0.04 | 0.04±0.03 | 0.0002±0.01 | 0.01±0.01 |
| Mid | 12.8±4.0 | 16.6±6.0 | 0.006±0.02 | 0.01±0.02 | 0.07±0.03 | 0.07±0.03 | 0.003±0.01 | 0.003±0.01 | |
| Inf. | 15.2±3.7 | 20.6±6.4 | 0.009±0.07 | 0.01±0.01 | 0.07±0.05 | 0.07±0.03 | 0.01±0.05 | 0.004±0.02 | |
| Subject 2 | Sup. | 10.8±4.0 | 10.8±4.5 | 0.07±0.02 | 0.07±0.01 | 0.11±0.03 | 0.06±0.02 | 0.01±0.02 | 0.008±0.01 |
| Mid | 20.2±3.9 | 19.8±4.7 | 0.005±0.01 | 0.01±0.01 | 0.1±0.03 | 0.08±0.02 | 0.01±0.02 | 0.001±0.01 | |
| Inf. | 30.8±4.6 | 28.9±3.4 | 0.008±0.01 | 0.004±0.01 | 0.09±0.03 | 0.09±0.03 | 0.02±0.02 | 0.02±0.02 | |
| Subject 3 | Sup. | 9.5±3.8 | 7.2±2.1 | 0.02±0.02 | 0.002±0.01 | 0.09±0.05 | 0.06±0.03 | 0.002±0.02 | 0.002±0.02 |
| Mid | 18.8±5.0 | 17.0±5.0 | 0.001±0.02 | 0.003±0.01 | 0.12±0.08 | 0.14±0.05 | 0.005±0.04 | 0.001±0.02 | |
| Inf. | 41.6±8.5 | 31.2±3.2 | 0.006±0.02 | 0.02±0.05 | 0.17±0.1 | 0.11±0.07 | 0.007±0.02 | 0.04±0.02 | |
(a) Displacement is given in millimeters.
(b) For directional strains, x is in the left/right direction, y is in the inferior/superior direction, and z is in the posterior/anterior direction.
The mean directional strains in the axial, coronal, and sagittal directions were also calculated. A couple of interesting observations can be made from the mean axial strain (direction of predominant displacement), εyy, given in Table 1. With a minor difference in the apical portion of the lung, the mean axial strain of Subject 1 was relatively constant in both the right and left lungs. Similar mean axial strain quantities are demonstrated for Subject 2. Subject 3, in contrast, exhibited much larger strain variation throughout all portions of the lungs. For all three subjects, the strain in the inferior-superior direction was greater than the strain in the anterior-posterior or right-left directions indicating greater lung deformation in the inferior-superior direction.
DISCUSSION
Tagged MRI using hyperpolarized helium-3 has potential over conventional tagged MRI in the lung for pulmonary mechanics research. We presented a technique demonstrating the feasibility of calculating 3-D kinematic quantities from hyperpolarized helium-3 tagged MRI. We also point out that the principal components of the analysis pipeline have been made freely available to other researchers in the form of open source software. Displacement fields and strain results derived from one normal subject, one asthmatic subject, and one advanced pulmonary fibrosis patient who had undergone right lung transplant surgery were also provided.
Several significant differences exist between our proposed framework and previously reported methods for analyzing this type of lung image data. First, the tracking algorithms previously developed are primarily focused on 2-D analysis which, given certain assumptions, makes locating and tracking grid centers much more tractable. However, the full 3-D motion of the lungs in which grid centers move in and out of the 2-D image plane makes tracking grid centers difficult. This motivated our full 3-D algorithm in which tag planes are segmented and tracked using a novel labeled point set registration algorithm tailored for tagged MR imagery which provides a more continuous and robust feature set.
In conclusion the results demonstrate the potential utility of using our method to automatically quantify pulmonary kinematics with hyperpolarized helium-3 tagged MRI to determine the effects of various lung diseases on parenchymal elasticity. Given the established feasibility of our automated workflow based on the results from the three subjects, further clinical studies will be used to statistically characterize the effects of lung disease on compliance. In addition, we plan on investigating the adaptation of our proposed framework to analyzing tagged MRI of the heart for noninvasive cardiac kinematic quantification.
Acknowledgments
This work was supported by NIH grant R01 HL079077, Siemens Medical Solutions, and the Flight Attendant Medical Research Institute.
References
- 1.Gelb A, Zamel N, Krishnan A. Physiologic similarities and differences between asthma and chronic obstructive pulmonary disease. Curr Opin Pulm Med. 2008;14(1):24–30. doi: 10.1097/MCP.0b013e3282f197df. [DOI] [PubMed] [Google Scholar]
- 2.Gelb AF, Licuanan J, Shinar CM, Zamel N. Unsuspected loss of lung elastic recoil in chronic persistent asthma. Chest. 2002;121(3):715–721. doi: 10.1378/chest.121.3.715. [DOI] [PubMed] [Google Scholar]
- 3.Owers-Bradley JR, Fichele S, Bennattayalah A, McGloin CJ, Bowtell RW, Morgan PS, Moody AR. MR tagging of human lungs using hyperpolarized 3He gas. J Magn Reson Imaging. 2003;17(1):142–146. doi: 10.1002/jmri.10226. [DOI] [PubMed] [Google Scholar]
- 4.Cai J, Altes TA, Miller GW, Sheng K, Read PW, Mata JF, Zhong X, Cates GD, Jr, de Lange EE, Mugler JP, 3rd, Brookeman JR. MR grid-tagging using hyperpolarized helium-3 for regional quantitative assessment of pulmonary biomechanics and ventilation. Magn Reson Med. 2007;58(2):373–380. doi: 10.1002/mrm.21288. [DOI] [PubMed] [Google Scholar]
- 5.Cai J, Miller GW, Altes TA, Read PW, Benedict SH, de Lange EE, Cates GD, Brookeman JR, Mugler JP, 3rd, Sheng K. Direct Measurement of Lung Motion Using Hyperpolarized Helium-3 MR Tagging. Int J Radiat Oncol Biol Phys. 2007;68(3):650–653. doi: 10.1016/j.ijrobp.2007.02.011. [DOI] [PMC free article] [PubMed] [Google Scholar]
- 6.Cai J, Sheng K, Benedict SH, Read PW, Larner JM, Mugler JP, 3rd, de Lange EE, Cates GD, Jr, Miller GW. Dynamic MRI of Grid-Tagged Hyperpolarized Helium-3 for the Assessment of Lung Motion During Breathing. Int J Radiat Oncol Biol Phys. 2009 doi: 10.1016/j.ijrobp.2009.03.051. In Press. [DOI] [PMC free article] [PubMed] [Google Scholar]
- 7.Axel L, Dougherty L. MR Imaging of Motion with Spatial Modulation of Magnetization. Radiology. 1989;171:841–845. doi: 10.1148/radiology.171.3.2717762. [DOI] [PubMed] [Google Scholar]
- 8.Zerhouni E, Parish D, Rogers W, Yang A, Shapiro E. Human heart: Tagging with MR Imaging---a method for noninvasive assessment of myocardial motion. Radiology. 1988;169:59–63. doi: 10.1148/radiology.169.1.3420283. [DOI] [PubMed] [Google Scholar]
- 9.Chen Q, Mai VM, Bankier AA, Napadow VJ, Gilbert RJ, Edelman RR. Ultrafast MR grid-tagging sequence for assessment of local mechanical properties of the lungs. Magn Reson Med. 2001;45(1):24–28. doi: 10.1002/1522-2594(200101)45:1<24::aid-mrm1004>3.0.co;2-6. [DOI] [PubMed] [Google Scholar]
- 10.Voorhees A, An J, Berger KI, Goldring RM, Chen Q. Magnetic resonance imaging-based spirometry for regional assessment of pulmonary function. Magn Reson Med. 2005;54(5):1146–1154. doi: 10.1002/mrm.20682. [DOI] [PubMed] [Google Scholar]
- 11.Sled JG, Zijdenbos AP, Evans AC. A nonparametric method for automatic correction of intensity nonuniformity in MRI data. IEEE Trans Med Imaging. 1998;17(1):87–97. doi: 10.1109/42.668698. [DOI] [PubMed] [Google Scholar]
- 12.Tustison NJ, Gee JC. N4ITK: Nick’s N3 ITK Implementation for MRI Bias Field Correction. Insight Journal. 2009 Accepted. [Google Scholar]
- 13.Sonka M, Hlavac V, Boyle R. Image Processing: Analysis and Machine Vision: CL-Engineering. 1998:800. [Google Scholar]
- 14.Otsu N. A thresholding selection method from gray-scale histogram. IEEE Transactions on System Man Cybernetics. 1979;9:62–66. [Google Scholar]
- 15.Barrett WA, Mortensen EN. Interactive Live-Wire Boundary Extraction. Medical Image Analysis. 1997;1(4):331–341. doi: 10.1016/s1361-8415(97)85005-0. [DOI] [PubMed] [Google Scholar]
- 16.Tustison NJ, Gee JC. Generalized n-D Ck B-spline scattered data approximation with confidence values. Proceedings of the 3rd International Workshop on Medical Imaging and Augmented Reality (MIAR) 2006:76–83. [Google Scholar]
- 17.Qian Z, Metaxas DN, Axel L. Extraction and Tracking of MRI Tagging Sheets Using a 3D Gabor Filter Bank. Proceedings of the 28th Annual International Conference of the Engineering in Medicine and Biology Society (EMBS); 2006. pp. 711–714. [DOI] [PubMed] [Google Scholar]
- 18.Tustison NJ, Awate SP, Song G, Cook TS, Gee JC. A New Information-Theoretic Measure to Control the Robustness-Sensitivity Trade-Off for DMFFD Point-Set Registration. Proceedings of the 21st Biennial International Conference on Information Processing in Medical Imaging (IPMI); Williamsburg. 2009. pp. 215–226. [DOI] [PubMed] [Google Scholar]
- 19.Tustison NJ, Awate SP, Gee JC. A Novel Information-Theoretic Point-Set Measure Based on the Jensen-Havrda-Charvat-Tsallis Divergence. Insight Journal. 2008 Accepted. [Google Scholar]
- 20.Tustison NJ, Avants BB, Gee JC. Directly Manipulated Free-Form Deformation Image Registration. IEEE Trans Image Process. 2009;18(3):624–635. doi: 10.1109/TIP.2008.2010072. [DOI] [PubMed] [Google Scholar]