Figure 4.
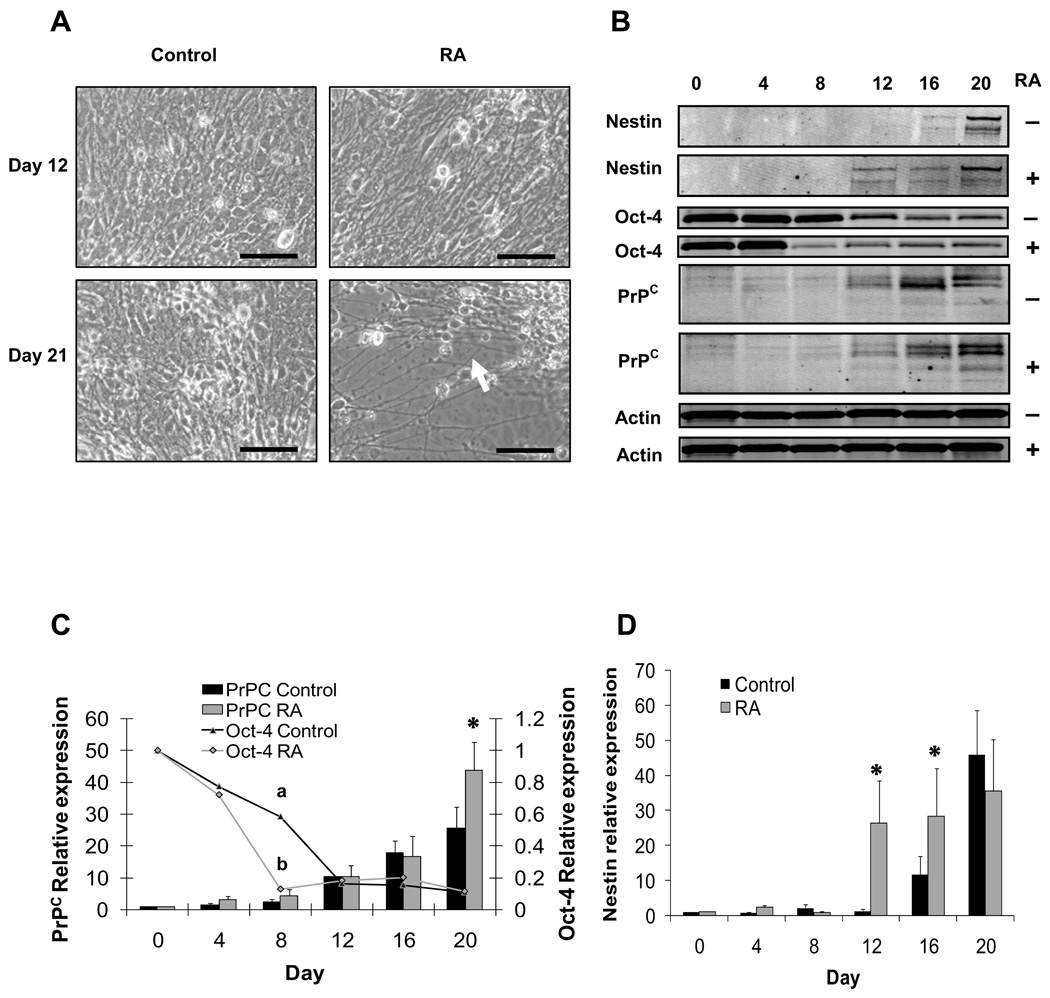
Expression of PrPC, Oct-4 and nestin in differentiating ES cell after induction with RA. (A) RA-treated ES cells showed intense neuritogenesis since Day 12 through Day 20 (white arrow). (B) PrPC displayed immunoreactive bands at 35, 32 and 27 kDa. Reactivity was also detected for Oct-4, β-actin and nestin at 43, 42, 120 kDa, respectively. (C) Computerized quantification of migration bands showed a higher (P < 0.05) expression of PrPC in RA-treated ES cells compared to the controls at Day 20 of differentiation. Oct-4 showed lower (P < 0.05) levels in RA-treated ES cells since Day 8 compared to untreated control. (D) RA-treated ES cells displayed greater (P < 0.05) levels of nestin at Days 12 and 16 compared to controls. For PrPC and Oct-4 levels, superscripts (a,b,*) represent significant (P < 0.05) differences between sampling days. Bar scale pictures: (Left) 100 µm; (Right) 200 µm.

