

1. INTRODUCTION
Individuals with schizophrenia (SCZ) often show impairments in their ability to monitor their ongoing behavior (Malenka, et al. 1982, 1986; Frith and Done, 1989), and to adjust their responses based on advance information or feedback (Elliott, et al. 1995). Detecting an error in performance is a critical component of evaluative functions that allow the flexible adjustment of behavior to optimize outcomes. Studies using single-unit recordings (Ito, et al. 2003, Niki and Watanabe, 1976), event-related potentials (e.g. Gehring, et al. 1993; Falkenstein, et al. 1991) and functional magnetic resonance imaging (e.g. Carter, et al. 1998, Ullsperger and von Cramon, 2004) present converging evidence in support of a specialized error-detection system in the brain, which heavily relies on the dorsal anterior cingulate cortex (dACC). In line with the view that impairments evaluating errors in schizophrenia may contribute to non-flexible behavior, decrements in error-related responses in the dACC have been repeatedly reported in the schizophrenia literature (for review see Mathalon, et al. 2009).
Consistent with the hypothesis that this error processing system is relevant for adjusting behavioral responses, a number of studies have associated dACC activation with post-error slowing, an error-based behavioral adjustment (Rabbitt, 1966), such that greater dACC responses predict larger increments in reaction time following error-commission (Gehring, et al. 1993; Debener, et al. 2005, Garavan, et al. 2002, Kerns, et al. 2004 but see Gehring and Fencsik, 2001; Luu, et al., 2000; Fellows and Farah, 2005). However, in contrast with the consistency of evidence for impairments in dACC responses to errors in schizophrenia, behavioral measures of error-based behavioral adjustments in SCZ have generated mixed results. A number of studies have reported intact post-error slowing (Laurens, et al. 2003, Mathalon, et al. 2002, Morris, et al. 2006, Polli, et al. 2006, 2008) but others have reported significantly less slowing of reaction time after error commission in SCZ (Alain, et al. 2002, Carter, et al. 2001, Kerns, et al. 2005, Kopp and Rist. 1999).
Although the dACC has received much attention in the error literature, accurate error-detection and subsequent behavioral adjustments are unlikely to rely on a single brain region. Accordingly, several studies have reported the activation of other regions in association with error-commission in healthy adults, including regions in the anterior insula, inferior parietal lobule, anterior prefrontal cortex (PFC), and thalamus (reviewed in Taylor, et al. 2007). Previous studies have linked error-related activity in anterior frontal and parietal regions with the awareness of making a mistake (Davies, et al. 2001, Falkenstein, et al. 1991, Falkenstein, et al. 2000, Hester, et al. 2005, Kaiser, et al. 1997, Mathalon, et al. 2003, Mathewson, et al. 2005, Murphy, et al. 2006, Nieuwenhuis, et al. 2001) While a number of studies have reported that post-error slowing occurs regardless of subjects’ awareness (Hester, et al. 2005, Murphy, et al. 2006; Kaiser, et al. 2007), evidence from lesion studies suggests that damage to lateral PFC (but not orbito-frontal or temporal) regions compromises neural responses associated with error commission in dACC (i.e. error-related negativity, Gehring, et al. 1993, Gehring and Knight, 2000, Ullsperger, et al. 2002, Ullsperger and von Cramon. 2006). This finding is consistent with the hypothesis that the interaction between the dACC and prefrontal regions plays a central role in the generation of error-commission related neural responses, which is consistent with theories proposing that the dACC signals the need to increase cognitive control and recruits lateral PFC regions (Botvinick, et al. 2001, Carter, et al. 1998, MacDonald, et al. 2000). Further, this finding suggests that it may be important to examine functional connectivity among regions involved in error-processing in addition to activation levels in responses to errors. Other work suggests that regions in the insula may signal uncertainty or more “affective” responses associated with errors (Menon, et al. 2001, Brazdil, et al. 2002, Garavan, et al. 2002, Polli, et al. 2005), which may be less directly involved in regulating cognitive control.
As with the basic science literature, the focus of studies of error processing in schizophrenia has also been centered on error-related dACC responses, though some studies have reported diminished error-related BOLD responses compared to healthy controls in other regions (Kerns, et al. 2005, Laurens, et al. 2003, Polli, et al. 2008). However, no study has specifically examined error related activity in schizophrenia across the brain regions identified in the basic science literature as being involved in error processing. Determining whether other regions besides dACC show altered error-related activation in schizophrenia, and whether their activity is related to behavioral adjustments may clarify mixed findings regarding the error-based behavioral adjustments in SCZ, and will expand our understanding of how impairments evaluating errors may contribute to rigid behavior in this illness. In addition, as individual differences and/or clinical conditions can represent a natural manipulation of a given system, the study of error processing in schizophrenia can offer a powerful tool to help us understand the significance of the different cognitive mechanisms involved in error-processing (error monitoring, error detection, error-based behavioral adjustments) and of the involvement of different brain regions in these processes.
In the current study, we sought to gain insight into the role of the core components of a network specialized in processing error-related signals to error detection and supporting error-based behavioral adjustments in SCZ and healthy controls (CON) by comparing BOLD responses between groups and examining how: 1) a network of regions specialized in processing error-related signals responds to error-commission during a cognitive task; 2) regions sensitive to error-commission integrate into a network; and 3) brain activity and brain network measures of functional segregation and integration among error-processing regions relate to behavioral performance (i.e. accuracy and post-error slowing).
We expected to replicate previous findings of reduced error-related dACC activity in SCZ, and we predicted that altered error-related brain activation would extend beyond the dACC into a distributed network. Based on previous studies, we expected to find a robust post-error slowing effect in CON but a less robust effect in SCZ. In light of literature discussed above, we predicted that we would find functional alterations in dACC and aPFC regions in SCZ compared to CON, reflecting a compromise in the generation of error-commission related neural responses and error-based behavioral adjustments. In addition, given that prior research has shown that regions responsive to error commission form an integrated network, it is also possible that the organization of this network may be altered in schizophrenia, reflecting a compromise in proper information integration and segregation. If so, we wished to determine whether reduced post-error behavioral adjustments would be associated with alterations in error-related brain activity and functional connectivity in dACC and aPFC.
2. METHODS
2.1 Participants
Participants were recruited through the clinical core of the Conte Center for the Neuroscience of Mental Disorders (CCNMD) at Washington University in St. Louis, and included: 1) 37 individuals with DSM-IV schizophrenia (SCZ); and 2) 32 healthy control participants (CON). Exclusion criteria included (a) substance abuse or any type of dependence within the past three months; (b) the presence of any clinically unstable or severe medical disorder; (c) present or past head injury with documented neurological sequelae, and/or causing loss of consciousness; (d) meeting DSM-IV criteria for mental retardation; and (e) pregnancy, or any contraindication to MR. Controls were excluded if they had any lifetime history of, or first-order family member with, an Axis I psychotic disorder, or any personal current mood or anxiety disorder other than Specific Phobias. All participants provided written informed consent in accordance with Washington University Human Subjects Committee’s criteria. The groups did not significantly differ in age, gender, ethnicity, handedness, or parental education (see Table 1). All individuals with schizophrenia were taking medications at the time of participation in the study. For details on clinical assessment and symptom ratings please see Supplemental Material.
Table 1.
Demographics and Clinical Characteristics
| Characteristics | SCZ (n=37) | CON (n=32) | t or X2 | p |
|---|---|---|---|---|
| Age (yrs) | 36.86 (9.14) | 36.19 (10.86) | 0.28 | 0.78 |
| Gender (%) | 0.03 | 0.86 | ||
| Female | 32% | 34% | ||
| Male | 68% | 66% | ||
| Ethnicity (%) | 0.02 | 0.88 | ||
| African American | 49% | 47% | ||
| Caucasian | 51% | 53 % | ||
| Handedness | 28R/4L/5LR | 28R/1L/2LR | 1.3 | 0.21 |
| Parental Education | 14.09 (3.19) | 13.03 (2.32) | 1.53 | 0.13 |
| Education Years | 13.3 (2.39) | 15.66 (4.23) | 1.87 | 0.07 |
| Smoker (%) | 57% | 16% | 11.69 | < 0.001 |
| Social Anhedonia Scores | 4.92 (2.1) | 2.35 (2.2) | 4.9 | < 0.001 |
| Physical Anhedonia Scores | 6.67 (4.17) | 3.71 (3.1) | 3.4 | < 0.001 |
| Negative Symptoms Rating | 1.84 (.95) | .26 (.31) | 8.8 | < 0.001 |
| Positive Symptoms Rating | 1.59 (1.4) | .02 (.09) | 6.4 | < 0.001 |
| Disorganization Symptoms Rating | 1.09 (.78) | .46 (.45) | 3.8 | < 0.001 |
| Age onset | 19.4 (7.7) | N/A | ||
| Illness duration (yrs) | 17.4 (11.2) | N/A | ||
| Atypical medications only (%) | 92 % | N/A | ||
| Combination typical/atypical (%) | 2.6 % | N/A |
Note: L= Left handed; R= Right handed; LR= Ambidextrous; N/A= does not apply
2.2 Tasks and materials
Participants performed three runs of a non-verbal “2-back” version of the “n-back” task while being scanned. Each run included 4 initial fixation trials followed by alternating “fixation” and “task” blocks in alternating order (3 task, 4 fixation). Stimuli consisted of unfamiliar faces displaying either happy, neutral or fearful expressions matched in lighting, location, distance, exposure, and arousal ratings (taken from Ekman and Friesen, 1975 and Gur et al., 2002). Stimuli appeared one at a time on a screen, and participants were instructed to press the target-button if the stimulus currently on the screen was the same as the one two trials previously, or the non-target button if it was any other stimulus. Participants did not receive feedback on their performance and error awareness was not measured. Emotional stimuli were presented interleaved with neutral stimuli and presented in three different emotional block-conditions: 1) fearful; 2) happy; and 3) neutral. During each task-block, participants saw 32 stimuli, each displayed for 2.5 s followed by a 500 ms inter-stimulus delay. 16 of these stimuli were always neutral fillers (occurring both as targets and non-targets). The remaining 16 (also occurring as both targets and non-targets) were either neutral, negative or positive, depending on task-condition (see Supplemental Material for task-diagram). For the current purposes, the type of stimuli (fearful, happy, neutral) were not relevant and this distinction was ignored in the analyses presented below, though we did confirm that the effects of interest did not differ as a function of stimulus type. During fixation-blocks (90 sec), a cross-hair appeared continuously, and subjects were told to fixate. Visual stimuli were generated by a G3 Macintosh computer and PsyScope, and projected onto a computer screen behind the subject’s head within the imaging chamber. Participants saw the screen through a mirror positioned approximately 8 cm above their face.
2.3 Behavioral data acquisition, processing and analysis
A fiber-optic, light-sensitive key press interfaced with a PsyScope button box was used to record subjects’ accuracy and reaction time (RT) while they performed the task in the scanner. To examine the effect of accuracy on RT, we categorized data into correct and incorrect response trials and into post-correct and post-incorrect response trials. For each group, we calculated the mean error rate and mean post-error slowing. RT data was examined using appropriately designed repeated measures ANOVAs.
2.4 fMRI data acquisition, processing and analysis
Functional scanning was performed on a 3T Siemens Allegra head-dedicated system at the Research Imaging Center of the Mallinckrodt Institute of Radiology at the Washington University Medical School. For details on scanning parameters, please see Supplemental Materials.
Each subject’s fMRI data was analyzed using a General Linear Model (GLM). Trials were coded for accuracy and estimates for each trial type (i.e. correct, incorrect) were modeled including a parameter for each timepoint (7 frames for each estimate, a total of 21 seconds given the 3 second TR) in the time course of each event type in the GLM, making no assumptions about the shape of the response. The estimates from the individual subject GLMs were then analyzed using repeated measures ANOVAs that treated participants as a random factor. These included accuracy (correct, incorrect) and timepoint within trial (frames 1–7) as within-subject factors and group as a between-subject factor. In some cases, voxels within the same regions showed multiple effects (e.g., accuracy × time, group × accuracy, group × accuracy × time). In such cases, results for lower order interactions are only presented when those voxels did not also show higher order interactions.
Regions of interest identification
To test our hypotheses, we defined as a priori regions of interest (ROIs) a network of regions previously shown to demonstrate robust error-related activity across a wide variety of tasks (Dosenbach, et al. 2006, 2007). We created an ROI mask by taking the coordinates reported by Dosenbach et al., 2007 as the center of spheres with a 10 mm radius (see Table 2). We conducted voxel-wise repeated measures ANOVAs at a whole-brain level, and masked the resulting z-maps with our ROI mask. Regions of significant task-related brain activation within this mask were identified using a threshold criterion of p<.01 in voxel-wise comparisons and a minimum cluster-size of 10 voxels. This cluster-size requirement provides further protection against type I error (Forman, et al. 1995, McAvoy, et al. 2001) and was chosen based on Monte-Carlo simulations.
Table 2.
Regions of interest
| Region Name | Talairach Coordinates | ||
|---|---|---|---|
| x | y | z | |
| Right Inferior Parietal Lobule | 51 | −47 | 42 |
| Left Inferior Parietal Lobule | −51 | −51 | 36 |
| Right Anterior Insula/ Frontal Operculum |
36 | 16 | 04 |
| Left Anterior Insula/ Frontal Operculum |
−35 | 14 | 05 |
| Dorsal Anterior Cingulate Cortex/ Medial Superior Frontal Cortex |
−01 | 10 | 46 |
| Right Anterior Prefrontal Cortex | 27 | 50 | 23 |
| Left Anterior Prefrontal Cortex | −28 | 51 | 15 |
| Right Anterior Thalamus | 10 | −15 | 08 |
| Left Anterior Thalamus | −12 | −15 | 07 |
| Right Lateral Cerebellum | 31 | −61 | −29 |
| Left Lateral Cerebellum | −32 | −66 | −29 |
| Right Inferior Cerebellum | 18 | −89 | −33 |
| Left Inferior Cerebellum | −19 | −80 | −33 |
Whole Brain Analyses
To look for non-predicted effects in regions outside the a priori ROIs, we conducted whole-brain voxel-wise repeated-measures ANOVAs. The resulting activation maps were thresholded for significance to obtain a whole-brain false positive rate of .05 based on Monte Carlo simulations.
Individual Difference Analyses
To examine the relationship between brain activity in response to error commission and behavioral adjustments, we analyzed the relationship between the magnitude of post-error slowing and functional brain responses to errors. To rule out confounds associated with lack of error-related responsivity in SCZ we focused our analyses on regions that showed significant effects of accuracy in SCZ as well as CON, even if there was also a group difference in the effects of accuracy. In addition, we examined whether individual differences in positive, negative or disorganization symptoms in SCZ (see Supplemental Material for details of symptom assessments) were associated with the magnitude of post-error slowing or brain activation in regions identified as showing significant effects of accuracy in both groups.
Functional Connectivity Analyses
To examine task-related functional connectivity, we extracted time-series data from our a priori defined ROIs showing significant error-related activity (6mm in radius spheres, see Table 2 for center coordinates, IPL not included). Before examining task-related functional connectivity, BOLD data was additionally preprocessed to remove task and nuisance related signals as possible sources of spurious correlations. Preprocessing, as well as further fcMRI analyses, were performed using in-house software implemented in Matlab 7.4 and were based on previously published fcMRI techniques (Fox et al., 2005; He et al., 2007). Briefly, (1) All images were spatially smoothed by 6 mm full-width half-maximum (FWHM) Gaussian filter. (2) Images were temporally filtered using high-pass filter with cutoff frequency of 0.009 Hz to remove low frequencies and scanner drift; (3) Modeled after the procedure employed by Fox et al. (2005), a set of nuisance regressors were removed from the signal using multiple regression: a) 6 rigid-body motion correction parameters; b) ventricle signal; c) deep white matter signal; and d) whole-brain signal. Further, to avoid correlations driven by the task structure itself, fixation epochs were excluded from the time-series. All subsequent analyses were based on the residual signal after removal was carried out for the listed nuisance regressors. (For more details on nuisance regressors, please see Supplemental Material). After preprocessing, we extracted time series data from each of our a priori ROIs and computed a correlation matrix reflecting the time-series correlation between each pair of ROIs for each subject (69×11×11). The ROI-ROI correlation coefficient represents the connectivity strength. To allow group-level analysis, correlations were converted to Fisher’s z values.
To examine network properties, we analyzed functional connectivity data using graph theory. Our ROI-ROI correlation matrix served as an adjacency matrix in which each ROI represents a node and the interaction between ROIs or nodes is represented by an edge. Connections between nodes (i.e. paths) can be determined using a threshold criterion as existing or non-existing (i.e. binary adjacency matrix), or in addition using the time-series correlation coefficient to gain information about the weight of an edge (i.e. weighted adjacency matrix). We took information regarding the weight of the edges into account for all measures of functional connectivity except efficiency (see below). Graph theory tools do not allow negative correlations to be examined, thus we analyzed network properties first using a correlation coefficient threshold of r=.1. This threshold was selected because it allows one to eliminate weak correlations that may obscure more physiologically relevant correlations, while still retaining a high degree of connections (Fair, et al. 2009). A less stringent threshold (e.g., less than .1) makes it difficult to observe any structure in the data. As higher threshold can sometimes be more informative as to the robustness of the network links, we used a threshold of r=.15 when testing for key connections that differ between groups. However, we did not examine even more conservative thresholds, as these may result in finding no cohesiveness in the network at all. To obtain a measure of functional integration in the network, we calculated the shortest path between nodes, and used the average inverse shortest path length as an index of global efficiency. The length of a path can be indicative of the potential for information integration between nodes, as communication between regions is more likely to be robust in shorter paths. To obtain a measure of functional segregation, we calculated the network’s clustering coefficient as the fraction of node's neighbors that are also neighbors of each other. In addition, we obtained an index of the centrality of each component by calculating the fraction of all shortest paths in the network traversing a given node (i.e. betweenness). This measure highlights which components play an important part in the network, as higher values indicate nodes participating in a large number of shortest paths. The indexes described obtained for each individual were then entered into second level analyses examining between group differences, as well as the relationship of these network properties with behavioral measures within each group (i.e. accuracy, post-error slowing and -in the case of SCZ- symptom ratings). All fcMRI analyses were conducted in MATLAB (The Mathworks, Inc., Natick, MA). Graph theory analyses were performed using scripts adapted from (Rubinov and Sporns (2009). Graph visualization was performed on NodeBox (De Bleser, et al., 2002).
3. RESULTS
3.1 Behavioral Results
Individuals with schizophrenia showed overall greater reaction times, SCZ: 879.6ms SD=168.2ms; CON: 814.4ms SD=134.9ms; F(1,67)= 3.1, p=.08, and committed significantly more mistakes than control subjects, SCZ: .85 SD= .08; CON: .93 SD=.07); F(1,67)= 16.9, p<.001. To examine behavioral adjustments after committing an error, the effect of accuracy on RT on the following trial was analyzed with a repeated-measures ANOVA using trial-type based on previous trial accuracy (i.e. post-correct, post-incorrect) as a within-subject factor and group (CON, SCZ) as a between-subject factor. We found a significant trial-type × group interaction, F(1,67)= 4.5, p<.05. Within-group analyses indicated that an error in the previous trial significantly slowed RT in the control group, F(1,31)= 4.5, p<.05, but not in the schizophrenia group, F(1,36)= .12, p= .73 (see Figure 1). See Supplemental Material for additional analyses that ruled out confounds of current trial type (e.g., Target versus Non-target) on post-error slowing. The severity of negative, positive and disorganization symptoms among individuals with schizophrenia were not significantly associated with the magnitude of post-error slowing (all p= .32).
Figure 1.
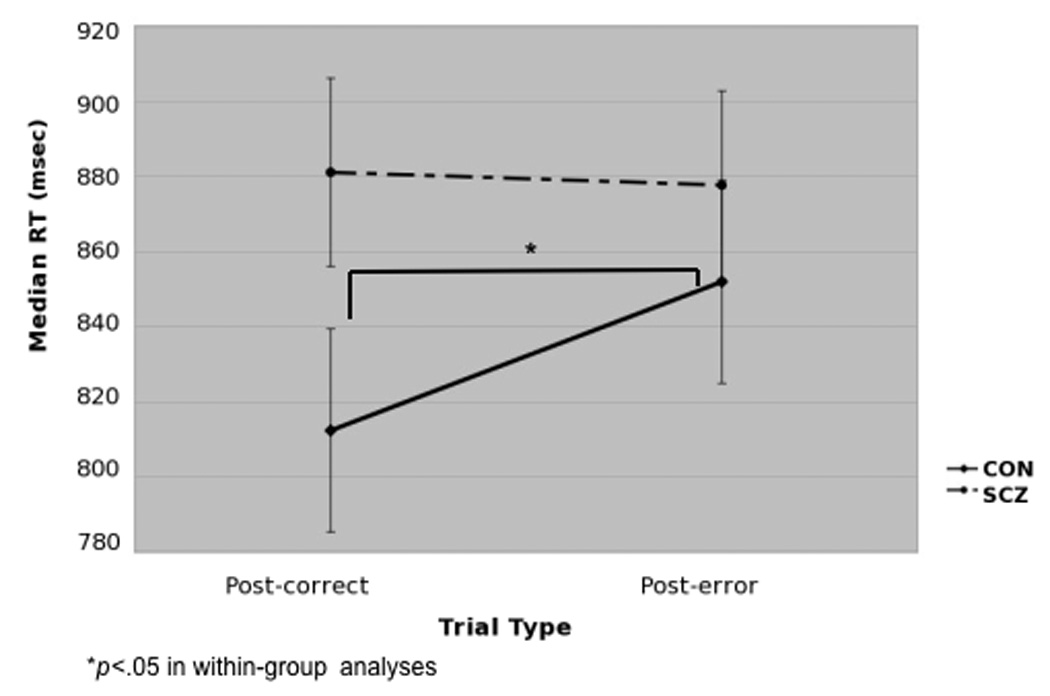
Effect of accuracy on previous trial on Median RTs
3.2 Neuroimaging results
3.2.1 fMRI Results: ROI-based Analyses
We computed voxel-wise ANOVAs using accuracy (correct, incorrect) and timepoint within trial (frames 1–7) as a within-subject factor and group (CON, SCZ) as a between-subject factor. A number of regions in the dACC/msFC, bilateral aI/fO, left aPFC and left cerebellum showed a significant effect of accuracy that interacted with time, but did not interact with group. As expected, these regions showed greater activity in error trials than on correct trials (see Table 3 and Figure 2). Within-group analyses indicated this effect was present in both groups, except in the aPFC in the case of controls and in the cerebellum in the case of individuals with schizophrenia.
Table 3.
fMRI Results of Accuracy Analysis Across Task
| Talairach Coordinates | |||||||
|---|---|---|---|---|---|---|---|
| Brain region | BA | x | y | z | Voxels | z-Value | Activity pattern |
| Accuracy × Time | |||||||
| dACC/msFC_1 | 6, 24/32 |
00 | 14 | 45 | 71 | 5.28 | error > correct |
| R aI/fO_1 | 33 | 21 | −01 | 16 | 7.39 | “ | |
| L aI/fO_1 | −32 | 18 | 09 | 33 | 4.32 | “ | |
| L Cerebellum | −32 | −69 | −32 | 70 | 3.30 | correct > error in CON not significant in SCZ alone |
|
| L aPFC | 9/10 | −25 | 45 | 16 | 24 | 2.74 | correct > error in SCZ but not significant in CON alone |
| Group × Accuracy | |||||||
| dACC/msFC_2 | 24,32 | 03 | 12 | 44 | 55 | 2.69 | CON: error > correct SCZ: error = correct |
| L aI/fO_2 | 13,45 | −39 | 13 | 07 | 113 | 2.95 | “ |
| R aI/fO_2 | 13,45 | 38 | 12 | 00 | 143 | 3.05 | “ |
| R inferior Cerebellum | 21 | −77 | −35 | 33 | 2.73 | “ | |
| L lateral Cerebellum | −28 | −66 | −29 | 118 | 3.22 | CON: error > correct SCZ: error < correct |
|
| R lateral Cerebellum | 27 | −57 | −27 | 49 | 2.92 | “ | |
| Group × Accuracy × Time | |||||||
| dACC/msFC_3 | 24/32 | 00 | 17 | 43 | 20 | 2.82 | CON: accuracy × time; error > correct SCZ: accuracy × time; error > correct |
| R aPFC | 10 | 24 | 52 | 23 | 76 | 3.15 | “ |
| R Thalamus | 15 | −18 | 11 | 66 | 3.09 | CON: accuracy × time; error > correct SCZ: NS |
|
| L Thalamus | −13 | −17 | 07 | 48 | 2.83 | CON: accuracy × time; error > correct SCZ: NS |
|
Note: BA = Brodmann area; L = Left; R = Right; dACC= dorsal anterior cingulate cortex; msFC= medial superior frontal cortex; aI=anterior insula; fO=frontal operculum; aPFC = anterior prefrontal cortex; “ = same as line above. Regions in bold showed significant error related activity in SCZ as well as CON and we examined in regression analyses with pos-error slowing.
Figure 2. Time-courses of regions within regions of interest showing a significant accuracy × time interaction.
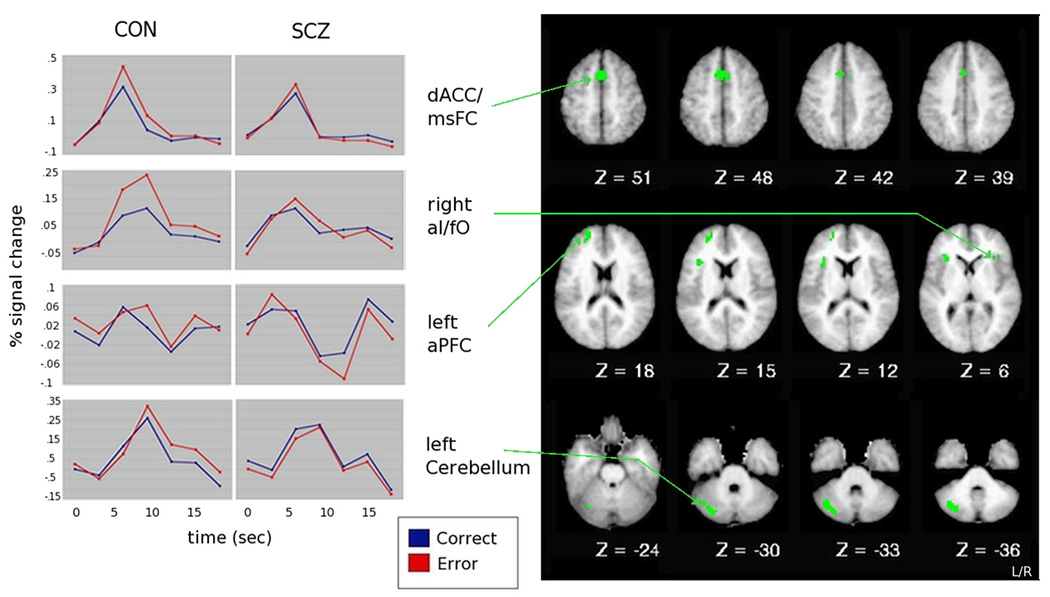
Note: dACC= dorsal anterior cingulate cortex; msFC= medial superior frontal cortex; aI= anterior insula; fO= frontal operculum; aPFC= anterior prefrontal cortex. Timecourses between homologous regions were highly correlated, thus, for simplicity, only right aI/fO timecourse is shown.
However, as shown in Table 3 and Figure 3, larger regions (non-overlapping with ones described above) in the dACC/msFC, bilateral aI/fO, and inferior cerebellum showed significant group × accuracy interactions, with a greater response in error trials compared to correct trials in controls, but not in SCZ. In addition, bilateral regions in the lateral cerebellum showed greater responses to errors than correct trials in controls, but the opposite in SCZ (greater responses in correct compared to error trials). Further, additional regions in the dACC/msFC, right aPFC and bilateral thalamus demonstrated group × accuracy × time interactions (see Table 3). In the dACC/msFC and thalamic regions, these interactions reflected greater error responsivity in controls than in patients. In right aPFC, the pattern of response differed between CON and SCZ, with a more sustained error response in CON. Our results support previous findings showing that both the dACC and regions outside the dACC are sensitive to error commission in healthy controls. Further, our results demonstrate that abnormalities in functional brain response to errors among individuals with schizophrenia extend beyond the dACC to almost all of the regions involved in error-related processing in healthy individuals, though the pattern of impairments differed somewhat across regions.
Figure 3. Time-courses of regions within the error-network showing a significant interaction with group.
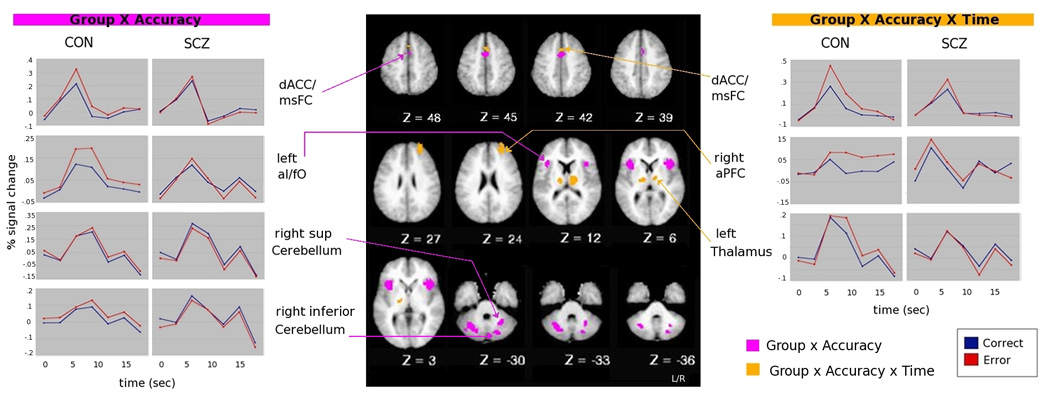
Note: dACC= dorsal anterior cingulate cortex; msFC= medial superior frontal cortex; aI= anterior insula; fO= frontal operculum; aPFC= anterior prefrontal cortex; sup= superior; inf= inferior. Timecourses between homologous regions were highly correlated, thus, for simplicity, only left aI/fO and right sup cerebellum time-courses are shown in group × accuracy interaction, and only left thalamus time-course is shown in group × accuracy × time interaction
3.2.2 fMRI Results: Individual Difference Analyses
We examined the relationship between the magnitude of post-error slowing and functional brain responses to errors, but only in regions that showed significant error related activity in SCZ as well as CON to rule out confounds associated with lack of error responsivity in SCZ (i.e., dACC/msFC_1, dACC/msFC_3, average of R al/fO_1 and L af/fO_1, R aPFC, see bolded regions in Table 3). We conducted linear regressions in which post-correct RT and group were entered in Step 1 to predict post-error RT; activity in regions showing significant effects of accuracy were entered in Step 2, and the interaction between group and activity in regions showing significant effects of accuracy were entered in Step 3 to determine any additional significant variance. This analysis yielded a significant model for step 1, F Change(2,66)= 88.02, p<.001 and for step 2, F Change(4,62)= 3.2, p=.019, but not for step 3, F Change(4,58)= 1.44, p.23 Within Step 2, greater activity in dACC_3 predicted greater post-error slowing, tdACC3= 2.97; p<.005. Conducting the same analysis for each region individually (to account for potential spurious interactions among regions) showed that the effect in dACC_3 was still present: step 2 F Change(1,65)= 4.25, p=.043; tdACC3= 1.07; p<.05. Adding the interaction between group and dACC activity in Step 3 did not account for any significant increase in variance, F Change(1,64)= .174, p= .68. As shown in Figure 4, greater ACC activity to errors predicted greater post-error slowing for both CON and SCZ. These results suggest the contribution of error-related dACC signals to post-error behavioral adjustments is blunted, but still semi-functional in SCZ. Further, including dACC_3 activity as a co-variate in the behavioral analysis eliminated the Trial-Type (post-correct; post-error) × Group interaction for post-error slowing, F(1,67)= 2.6, p=.1. This result suggests that the reduced post-error slowing effects in SCZ may indeed be mediated by reduced dACC responsivity to errors.
Figure 4.
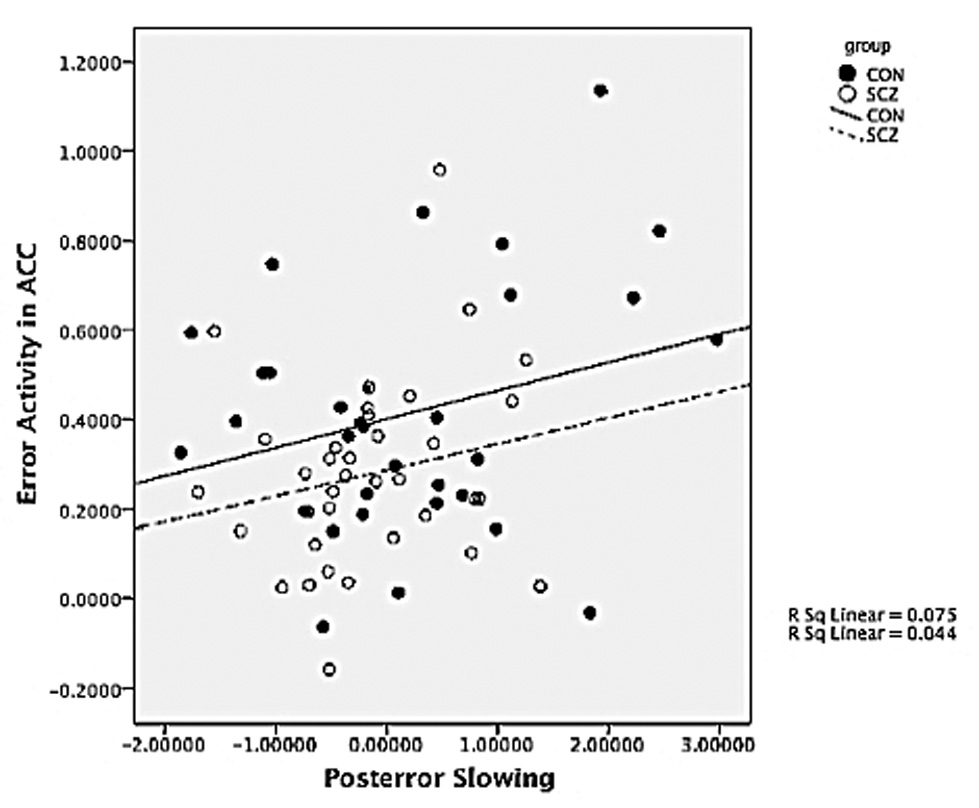
Post-error slowing and brain activity correlations
The severity of negative, positive and disorganization symptoms among individuals with schizophrenia were not significantly associated with the magnitude of activation in regions showing significant effects of accuracy in both groups.
3.2.3 fcMRI Results
Group differences in functional connectivity properties at a network level were tested using 2-tailed t-tests. As shown in Table 4, we found no evidence of between group differences in the network’s overall clustering coefficient, global efficiency or connectivity strength using threshold criterions of r=.1 and of r.15. However, as show in Figure 5, the integration of the error processing network does appear to differ somewhat between patients and controls, with the cerebellar regions less connected to the network among individuals with schizophrenia at a threshold of both r=.1 and r=.15, and the dACC less well connected at a threshold of r=.15.
Table 4.
Graph theory measures of network properties
| A. Overall Network Properties | |||||||||
|---|---|---|---|---|---|---|---|---|---|
| r = .1 Group |
Mean Network Clustering Coefficient (SEM) |
t | p | Mean Network Global Efficiency (SEM) |
t | p | |||
| CON | .18 (.01) | −1.4 | .16 5 |
.63 (.02) | 1.32 | .190 | |||
| SCZ | .21 (.01) | .60 (.02) | |||||||
|
r = .15 Group |
Mean Network Clustering Coefficient (SEM) |
t | p |
Mean Network Global Efficiency (SEM) |
t | p |
Network Overall Connectivity Strength |
t | p |
| CON | 61 (.03) | −.39 | .70 1 |
.51 (.03) | 1.1 | .272 | 11.49 (.89) | 1.05 | .30 |
| SCZ | 59 (.03) | .47 (.03) | 10.25 (.78) | ||||||
| B. Functional Connectivity Properties in regions showing qualitative group differences | |||||||||||
|---|---|---|---|---|---|---|---|---|---|---|---|
| Group | ROI | Clustering Coefficient (SEM) r = .15 |
t | p | Between ness (SEM) r=.15 |
t | p | ROI | Connectivity Strength (SEM) r=.15 |
t | p |
| CON | dACC/ msFC |
.14 (.02) .15 (.02) |
.22 | .83 | 1.68 (.48) 1.17 (.33) |
.90 | .37 | dACC/msFC to al/fO and aTh |
.16 (.02) .11 (.02) |
1.58 | .12 |
| SCZ | |||||||||||
| CON | Cerebellum | .26 (.02) | −.50 | .62 | 9.34 (.87) | .45 | .65 | Cerebellum to all ROIs |
.03 (.01) | 2.32 | .02* |
| SCZ | . 28 (.02) | 8.83 (.74) | −.007 (.01) | ||||||||
Note: dACC= dorsal anterior cingulate cortex; msFC= medial superior frontal cortex; al= anterior insula; fO= frontal operculum; aTh= anterior thalamus.
Figure 5. Error Network Graphs in healthy controls and in individuals with schizophrenia.

Each ROI is represented by a node. Significant connections between ROIs are represented by a weighted line (the greater the correlation coefficient, the thicker the line). Nodes in cyan represent the most interconnected ROIs.
Note: R= right; L= left; aPFC= anterior prefrontal cortex; aI= anterior insula; fO= frontal operculum; msFC= medial superior frontal cortex; aTh= anterior thalamus; dACC= dorsal anterior cingulate cortex; Cereb = cerebellum; lat= lateral; inf= inferior.
To examine these observations quantitatively, we compared the betweenness and clustering coefficient of the dACC and of the average of the four cerebellar regions between groups at threshold r=.15 using independent sample t-tests. However, as shown in Table 5, we found no evidence of significant differences between groups in these measures. In addition, we computed the average connectivity strength between the dACC and the bilateral al/fO, and aTh regions, as well as the average connectivity strengths of the four cerebellar regions to the rest of the network, and compared them across groups. As shown in - Table 5, the results indicated that both dACC and the cerebellar regions showed weaker connections in SCZ compared to CON, but only the cerebellar regions were significantly less integrated to the rest of the network in SCZ compared to CON.
3.3.4 fcMRI: Brain connectivity and behavioral measures correlations
To test whether the network organization properties of regions sensitive to error-commission contributed to behavioral performance, we used a linear regression model in which post-correct RT and group were entered in Step 1 to predict post-error RT; functional connectivity measures (i.e. network’s overall clustering coefficient, connectivity strength) were entered in Step 2, and the interaction between group and these measures were entered in Step 3 to determine any additional significant variance. To specifically test hypothesis regarding dACC and aPFC interactions, we used a similar model in which the connectivity strengths between the dACC and the aPFC were entered in step 2. However, no significant predictions were found for any of these models. In addition, we examined the relationship between network properties and accuracy, as well as with clinical symptoms of schizophrenia using correlation analyses. These analyses, however, yielded no significant associations.
4. DISCUSSION
The present study investigated how a network of brain regions previously identified as processing error-related signals responds to error-commission during a cognitive task in individuals with schizophrenia and healthy controls, as well as the characteristics of the network formed by these regions. In addition, we examined how error-related brain activity and network measures of functional segregation and integration among these error-processing regions related to accuracy and post-error slowing.
4.1 Error-based behavioral adjustments
Consistent with previous literature, we found a significant effect of prior trial accuracy in reaction times in CON, such that responses were overall slower in trials following an incorrect compared to a correct response. However, this effect was not present in SCZ. This result is consistent with the idea that errors set in motion behavioral adjustments, and with the hypothesis that impairments in the ability to evaluate errors in schizophrenia results in a compromised ability to adjust behavior according to environmental demands (Malenka et al., 1982, 1986, Ellliott, 1995). Given that individuals with schizophrenia performed more poorly than control subjects, one may ask whether the lack of behavioral adjustments after error commission is merely reflecting this difference in performance between groups. In this sense, however, it is important to note that although individuals with schizophrenia committed significantly more mistakes than control subjects, their performance was well above chance. Moreover, given that individuals with schizophrenia were actively engaged in the task –as evidenced by accuracy rates– the prediction might be to find greater error-related activity in individuals with schizophrenia compared to controls if they showed more errors. However, our results were in the opposite direction. In this context, we believe our findings can be clearly interpreted as a diminished responsivity to errors.
4.2 Error-related activity
We observed significantly greater activity during error compared to correct trials in a network of regions comprising regions in the dACC, aPFC, aI/fO, thalamus and cerebellum in CON, replicating prior work implicating these regions in signaling error-commission (Dosenbach, et al. 2006, 2007). Of note, the IPL did not demonstrate a significant effect of trial accuracy in the ROI analyses. However, in an exploratory whole brain analysis (see Supplemental Material), a slightly more caudal region in the right IPL demonstrated a significant accuracy × time interaction. As we expected, error-related dACC activity was reduced in SCZ compared to CON. Also in line with our predictions, we found that altered error-related brain activation in SCZ extended beyond the dACC into a distributed network that comprised all of the regions involved in error-related processing in CON. However, the alterations in error related brain responses in schizophrenia were somewhat complex. Specifically, we found regions in dACC, right al/fO, left aPFC, and left cerebellum that showed a significant effect of accuracy that did not differ significantly between groups. In these regions, both CON and SCZ demonstrated significantly greater responses to errors than to correct responses. However, we found additional regions of dACC, left al/fO, right aPFC, right cerebellum and left thalamus that clearly showed reduced or even absent error related responding in SCZ. On the surface, this might raise questions as to whether there are functional subdivisions within these regions that may differ in their responses to errors or their impairment in SCZ. Although this is possible, examination of the time-courses in Figure 2 suggests that the magnitudes of the error related responses were blunted in SCZ in all regions, even though their responses were not significantly different than controls in this specific ROIs. Thus, overall, we think the most parsimonious explanation of the results is that while there is still some responsivity to errors in SCZ, this functional activation response is clearly blunted across all regions involved in the error-processing network.
We found that the a region in the dACC/msFC (the one demonstrating a time × accuracy × group interaction) was predictive of post-error slowing, replicating prior work (Gehring, et al. 1993, Garavan, et al. 2002; Kerns, et al. 2004; Debener, et al. 2005). Importantly, this was the only region that was predictive of posterror slowing. This finding suggests a special role for dACC responses in generating error-based behavioral adjustments. Based on this finding, and given that the response in this region to errors was blunted in SCZ, one can speculate that the lack of post-error slowing in SCZ may be due to this reduced dACC response to errors. Although one cannot draw causal inferences from correlational data, the fact that the group differences in post-error slowing were eliminated after adjusting for the magnitude of dACC response is consistent with such a causal hypothesis. Overall, these results are consistent with the hypothesis that the dACC plays a central role increasing cognitive control to adjust behavioral responses (Carter, et al. 1998; MacDonald, et al. 2000, Yeung, et al. 2004), and that dACC impairments in SCZ play a major role in impaired behavioral adjustments in this illness. An important question to be addressed in future research is the degree to which impairments in error related processing in other regions of the network reflect a primary impairment in dACC responses. For example, if aI/fO activity reflects emotional responses associated with error-commission (Menon, et al. 2001, Brazdil, et al. 2002, Garavan, et al. 2002, Polli, et al. 2005), individuals with schizophrenia may show reduced al/fO responses because they fail to detect the errors, and not because they fail to have an emotional response to errors that are detected. As another example, it is possible that aPFC responses to errors are reduced in schizophrenia because the dACC fails to signal the need for an adjustment in cognitive control, though it is also possible that the a PFC may not be able to mount a cognitive control adjustment even when given appropriate cues (Botvinick, et al. 2001, Braver, et al. 2009). Future work using designs that allow for examination of trial-by-trial adjustments in brain activity (e.g., slow event-related design) or which utilize methods with finer grained temporal resolution (e.g., MEG) will be able to address such questions.
4.3 Measures of functional integration and functional segregation
We found that overall connectivity strength, clustering coefficient (a measure of global functional segregation), and efficiency (a measure of global functional integration) were comparable between groups. We did not find that dACC/msFC regions were significantly less connected to rest of the network in SCZ compared to CON, though the graph analyses provided some hints in this direction. However, cerebellar regions were significantly less connected to the rest of the network in SCZ. Although the later result was not predicted a priori, it is consistent with theories proposing that cortico-thalamic-cerebellar loops are affected in SCZ (Andreasen, et al. 1996). Our findings are overall consistent with theories proposing that alterations in the integration of information between brain regions play a central role in the pathophysiology of schizophrenia (Friston and Frith, 1995). At the same time, the pattern of results we observed suggests that rather than exhibiting global differences in network organization, alterations in functional connectivity in individuals with schizophrenia are greater for some nodes than others. However, it is possible that given that our ROIs constituted a relatively small network, graph theory measures were not optimally suited to detect differences in overall network organization. Nonetheless, our results indicated important differences at the individual node level, with interactions between dACC/msFC and cerebellar regions with the rest of the network specially affected in SCZ.
We had predicted dACC-PFC interactions would be central to implement cognitive control. However, we found no evidence for a relationship between dACC-aPFC connectivity and the magnitude of post-error adjustments. Interestingly, the organization of our network indicated that the PFC regions were more strongly connected to al/fO regions than to the dACC. In addition, we observed that connections between the insula and prefrontal regions and between the thalamus and cerebellum were the most vulnerable, in the sense that they broke off from the network when we increased the threshold. This suggests the speculative possibility that there are subnetworks within the global error processing network, and that the integration of subnetworks into a larger network may be particularly impaired in schizophrenia. Such a hypothesis needs to be explored in future research using large samples that would provide the necessary power to detect potential subtle effects.
A limitation of this study is that all participants with schizophrenia were taking antipsychotic medications, which may interact with task performance and brain activity. However, to control for the effect of medication, medication dosages were converted to chlorpromazine equivalents (Woods, 2003, Atkins, et al. 1997, Bai, et al. 2007, Bazire, 2009) and correlated with brain activation in regions showing error-related effects in both groups. We found no evidence of a significant association between medication and brain activation. Furthermore, an important proportion of individuals with schizophrenia are chronically medicated, thus, we believe it is important to assess the functioning of patients on medications if this is their typical state.
5. CONCLUSIONS
Individuals with schizophrenia demonstrated a significant compromise in post-error slowing, a type of error-based adjustment. Our imaging results supported previous findings showing that the ACC as well as regions outside the ACC are sensitive to error commission. Further, they demonstrated that abnormalities in brain responses to errors among SCZ extend beyond the dACC to almost all of the regions involved in error-related processing in CON. However, our results also highlight the central role of the dACC in behavioral adjustment, as this was the only brain region whose activity was predictive of individual differences in post-error slowing. Moreover, the integration of error-processing network of regions differed between groups, with the cerebellar regions and the dACC less connected to the network in SCZ compared to CON. Taken together, these results support the hypothesis that behavioral rigidity in SCZ may be linked to alterations in dACC function leading to a compromise in the implementation of cognitive control. Our findings highlight the importance of examining the integration of the dACC with other regions involved in error-related processing in more detail.
Supplementary Material
Acknowledgments
We thank Naomi Yodkovik and Lisa Dickman for help with data acquisition and processing, and Erin Dowd for help with analyses converting medication dosages to chlorpromazine equivalents. This work was supported by the National Institutes of Health [R01 MH06603101 to D.M.B.]; and the Conte Center for the Neuroscience of Mental Disorders [MH071616 to D.M.B.].
Footnotes
Publisher's Disclaimer: This is a PDF file of an unedited manuscript that has been accepted for publication. As a service to our customers we are providing this early version of the manuscript. The manuscript will undergo copyediting, typesetting, and review of the resulting proof before it is published in its final citable form. Please note that during the production process errors may be discovered which could affect the content, and all legal disclaimers that apply to the journal pertain.
REFERENCES
- Alain C, McNeely HE, He Y, Christensen BK, West R. Neurophysiological evidence of error-monitoring deficits in patients with schizophrenia. Cereb Cortex. 2002;12:840–846. doi: 10.1093/cercor/12.8.840. [DOI] [PubMed] [Google Scholar]
- Andreasen NC, O'Leary DS, Cizadlo T, Arndt S, Rezai K, Ponto LL, et al. Schizophrenia and cognitive dysmetria: A positron-emission tomography study of dysfunctional prefrontal-thalamic-cerebellar circuitry. Proc Natl Acad Sci U S A. 1996;93:9985–9990. doi: 10.1073/pnas.93.18.9985. [DOI] [PMC free article] [PubMed] [Google Scholar]
- Atkins M, Burgess A, Bottomley C, Riccio M. Chlorpromazine equivalents: a consensus of opinion for both clinical and research applications. Psychiatr Bull. 1997;21:224–226. [Google Scholar]
- Bai YM, Ting Chen T, Chen JY, et al. Equivalent switching dose from oral risperidone to risperidone long-acting injection: a 48-week randomized, prospective, single-blind pharmacokinetic study. J Clin Psychiatry. 2007;68:1218–1225. doi: 10.4088/jcp.v68n0808. [DOI] [PubMed] [Google Scholar]
- Bazire S. Psychotropic drug directory 2005. In: Kroken RA, Johnsen E, Ruud T, Wentzel-Larsen T, Jorgensen HA, editors. Treatment of schizophrenia with antipsychotics in Norwegian emergency wards, a cross-sectional national study. BMC Psychiatry; 2009. pp. 9–24. [DOI] [PMC free article] [PubMed] [Google Scholar]
- Botvinick MM, Braver TS, Barch DM, Carter CS, Cohen JD. Conflict monitoring and cognitive control. Psychol Rev. 2001;108:624–652. doi: 10.1037/0033-295x.108.3.624. [DOI] [PubMed] [Google Scholar]
- Braver TS, Paxton JL, Locke HS, Barch DM. Flexible neural mechanisms of cognitive control within human prefrontal cortex. Proc Natl Acad Sci U S A. 2009;106:7351–7356. doi: 10.1073/pnas.0808187106. [DOI] [PMC free article] [PubMed] [Google Scholar]
- Brazdil M, Roman R, Falkenstein M, Daniel P, Jurak P, Rektor I. Error processing--evidence from intracerebral ERP recordings. Exp Brain Res. 2002;146:460–466. doi: 10.1007/s00221-002-1201-y. [DOI] [PubMed] [Google Scholar]
- Carter CS, MacDonald AW, 3rd, Ross LL, Stenger VA. Anterior cingulate cortex activity and impaired self-monitoring of performance in patients with schizophrenia: An event-related fMRI study. Am J Psychiatry. 2001;158:1423–1428. doi: 10.1176/appi.ajp.158.9.1423. [DOI] [PubMed] [Google Scholar]
- Carter CS, Braver TS, Barch DM, Botvinick MM, Noll D, Cohen JD. Anterior cingulate cortex, error detection, and the online monitoring of performance. Science. 1998;280:747–749. doi: 10.1126/science.280.5364.747. [DOI] [PubMed] [Google Scholar]
- Davies PL, Segalowitz SJ, Dywan J, Pailing PE. Error-negativity and positivity as they relate to other ERP indices of attentional control and stimulus processing. Biol Psychol. 2001;56:191–206. doi: 10.1016/s0301-0511(01)00080-1. [DOI] [PubMed] [Google Scholar]
- De Bleser F, De Smedt T, Nijs L. NodeBox version 1.9.5 for Mac OS X. 2002 [Google Scholar]
- Debener S, Ullsperger M, Siegel M, Fiehler K, von Cramon DY, Engel AK. Trial-by-trial coupling of concurrent electroencephalogram and functional magnetic resonance imaging identifies the dynamics of performance monitoring. J Neurosci. 2005;25:11730–11737. doi: 10.1523/JNEUROSCI.3286-05.2005. [DOI] [PMC free article] [PubMed] [Google Scholar]
- Dosenbach NU, Visscher KM, Palmer ED, Miezin FM, Wenger KK, Kang HC, et al. A core system for the implementation of task sets. Neuron. 2006;50:799–812. doi: 10.1016/j.neuron.2006.04.031. [DOI] [PMC free article] [PubMed] [Google Scholar]
- Dosenbach NU, Fair DA, Miezin FM, Cohen AL, Wenger KK, Dosenbach RA, et al. Distinct brain networks for adaptive and stable task control in humans. Proc Natl Acad Sci U S A. 2007;104:11073–11078. doi: 10.1073/pnas.0704320104. [DOI] [PMC free article] [PubMed] [Google Scholar]
- Ekman P, Friesen WV. A Guide to Recognizing Emotions from Facial Clues. Englewood Cliffs, NJ: Prentice-Hall; 1975. Unmasking the Face. [Google Scholar]
- Elliott R, McKenna PJ, Robbins TW, Sahakian BJ. Neuropsychological evidence for frontostriatal dysfunction in schizophrenia. Psychol Med. 1995;25:619–630. doi: 10.1017/s0033291700033523. [DOI] [PubMed] [Google Scholar]
- Fair DA, Cohen AL, Power JD, Dosenbach NU, Church JA, Miezin FM, et al. Functional brain networks develop from a "local to distributed" organization. PLoS Comput Biol. 2009;5:e1000381. doi: 10.1371/journal.pcbi.1000381. [DOI] [PMC free article] [PubMed] [Google Scholar]
- Falkenstein M, Hoormann J, Christ S, Hohnsbein J. ERP components on reaction errors and their functional significance: A tutorial. Biol Psychol. 2000;51:87–107. doi: 10.1016/s0301-0511(99)00031-9. [DOI] [PubMed] [Google Scholar]
- Falkenstein M, Hohnsbein J, Hoormann J, Blanke L. Effects of crossmodal divided attention on late ERP components. II. error processing in choice reaction tasks. Electroencephalogr Clin Neurophysiol. 1991;78:447–455. doi: 10.1016/0013-4694(91)90062-9. [DOI] [PubMed] [Google Scholar]
- Fellows LK, Farah MJ. Is anterior cingulate cortex necessary for cognitive control? Brain. 2005;128:788–796. doi: 10.1093/brain/awh405. [DOI] [PubMed] [Google Scholar]
- Forman SD, Cohen JD, Fitzgerald M, Eddy WF, Mintun MA, Noll DC. Improved assessment of significant activation in functional magnetic resonance imaging (fMRI): Use of a cluster-size threshold. Magn Reson Med. 1995;33:636–647. doi: 10.1002/mrm.1910330508. [DOI] [PubMed] [Google Scholar]
- Friston KJ, Frith CD. Schizophrenia: A disconnection syndrome? Clin Neurosci. 1995;3:89–97. [PubMed] [Google Scholar]
- Frith CD, Done DJ. Experiences of alien control in schizophrenia reflect a disorder in the central monitoring of action. Psychol Med. 1989;19:359–363. doi: 10.1017/s003329170001240x. [DOI] [PubMed] [Google Scholar]
- Garavan H, Ross TJ, Murphy K, Roche RA, Stein EA. Dissociable executive functions in the dynamic control of behavior: Inhibition, error detection, and correction. Neuroimage. 2002;17:1820–1829. doi: 10.1006/nimg.2002.1326. [DOI] [PubMed] [Google Scholar]
- Gehring WJ, Fencsik DE. Functions of the medial frontal cortex in the processing of conflict and errors. J Neurosci. 2001;21:9430–9437. doi: 10.1523/JNEUROSCI.21-23-09430.2001. [DOI] [PMC free article] [PubMed] [Google Scholar]
- Gehring WJ, Goss B, Coles MGH, Meyer DE, Donchin E. A neural system for error detection and compensation. Psychological Sci. 1993;4:385–390. [Google Scholar]
- Gehring WJ, Knight RT. Prefrontal-cingulate interactions in action monitoring. Nat Neurosci. 2000;3:516–520. doi: 10.1038/74899. [DOI] [PubMed] [Google Scholar]
- Gur RC, Sara R, Hagendoorn M, et al. A method for obtaining 3-dimensional facial expressions and its standardization for use in neurocognitive studies. J Neurosci Methods. 2002;115:137–143. doi: 10.1016/s0165-0270(02)00006-7. [DOI] [PubMed] [Google Scholar]
- Hester R, Foxe JJ, Molholm S, Shpaner M, Garavan H. Neural mechanisms involved in error processing: A comparison of errors made with and without awareness. Neuroimage. 2005;27:602–608. doi: 10.1016/j.neuroimage.2005.04.035. [DOI] [PubMed] [Google Scholar]
- Ito S, Stuphorn V, Brown JW, Schall JD. Performance monitoring by the anterior cingulate cortex during saccade countermanding. Science. 2003;302:120–122. doi: 10.1126/science.1087847. [DOI] [PubMed] [Google Scholar]
- Kaiser J, Barker R, Haenschel C, Baldeweg T, Gruzelier JH. Hypnosis and event-related potential correlates of error processing in a stroop-type paradigm: A test of the frontal hypothesis. Int J Psychophysiol. 1997;27:215–222. doi: 10.1016/s0167-8760(97)00055-x. [DOI] [PubMed] [Google Scholar]
- Kerns JG, Cohen JD, MacDonald AW, 3rd, Cho RY, Stenger VA, Carter CS. Anterior cingulate conflict monitoring and adjustments in control. Science. 2004;303:1023–1026. doi: 10.1126/science.1089910. [DOI] [PubMed] [Google Scholar]
- Kerns JG, Cohen JD, MacDonald AW, 3rd, Johnson MK, Stenger VA, Aizenstein H, et al. Decreased conflict- and error-related activity in the anterior cingulate cortex in subjects with schizophrenia. Am J Psychiatry. 2005;162:1833–1839. doi: 10.1176/appi.ajp.162.10.1833. [DOI] [PubMed] [Google Scholar]
- Kopp B, Rist F. An event-related brain potential substrate of disturbed response monitoring in paranoid schizophrenic patients. J Abnorm Psychol. 1999;108:337–346. doi: 10.1037//0021-843x.108.2.337. [DOI] [PubMed] [Google Scholar]
- Laurens KR, Ngan ET, Bates AT, Kiehl KA, Liddle PF. Rostral anterior cingulate cortex dysfunction during error processing in schizophrenia. Brain. 2003;126:610–622. doi: 10.1093/brain/awg056. [DOI] [PubMed] [Google Scholar]
- Luu P, Flaisch T, Tucker DM. Medial frontal cortex in action monitoring. J Neurosci. 2000;20:464–469. doi: 10.1523/JNEUROSCI.20-01-00464.2000. [DOI] [PMC free article] [PubMed] [Google Scholar]
- MacDonald AW, 3rd, Cohen JD, Stenger VA, Carter CS. Dissociating the role of the dorsolateral prefrontal and anterior cingulate cortex in cognitive control. Science. 2000;288:1835–1838. doi: 10.1126/science.288.5472.1835. [DOI] [PubMed] [Google Scholar]
- Malenka RC, Angel RW, Hampton B, Berger PA. Impaired central error-correcting behavior in schizophrenia. Arch Gen Psychiatry. 1982;39:101–107. doi: 10.1001/archpsyc.1982.04290010073013. [DOI] [PubMed] [Google Scholar]
- Malenka RC, Angel RW, Thiemann S, Weitz CJ, Berger PA. Central error-correcting behavior in schizophrenia and depression. Biol Psychiatry. 1986;21:263–273. doi: 10.1016/0006-3223(86)90047-8. [DOI] [PubMed] [Google Scholar]
- Mathalon DH, Whitfield SL, Ford JM. Anatomy of an error: ERP and fMRI. Biol Psychol. 2003;64:119–141. doi: 10.1016/s0301-0511(03)00105-4. [DOI] [PubMed] [Google Scholar]
- Mathalon DH, Jorgensen KW, Roach BJ, Ford JM. Error detection failures in schizophrenia: ERPs and FMRI. Int J Psychophysiol. 2009;73:109–117. doi: 10.1016/j.ijpsycho.2009.02.005. [DOI] [PMC free article] [PubMed] [Google Scholar]
- Mathalon DH, Fedor M, Faustman WO, Gray M, Askari N, Ford JM. Response-monitoring dysfunction in schizophrenia: An event-related brain potential study. J Abnorm Psychol. 2002;111:22–41. [PubMed] [Google Scholar]
- Mathewson KJ, Dywan J, Segalowitz SJ. Brain bases of error-related ERPs as influenced by age and task. Biol Psychol. 2005;70:88–104. doi: 10.1016/j.biopsycho.2004.12.005. [DOI] [PubMed] [Google Scholar]
- McAvoy MP, Ollinger JM, Buckner RL. Cluster size thresholds for assessment of significant activation in fMRI. Neuroimage. 2001;13:198. [Google Scholar]
- Menon V, Adleman NE, White CD, Glover GH, Reiss AL. Error-related brain activation during a Go/NoGo response inhibition task. Hum Brain Mapp. 2001;12:131–143. doi: 10.1002/1097-0193(200103)12:3<131::AID-HBM1010>3.0.CO;2-C. [DOI] [PMC free article] [PubMed] [Google Scholar]
- Morris SE, Yee CM, Nuechterlein KH. Electrophysiological analysis of error monitoring in schizophrenia. J Abnorm Psychol. 2006;115:239–250. doi: 10.1037/0021-843X.115.2.239. [DOI] [PubMed] [Google Scholar]
- Murphy TI, Richard M, Masaki H, Segalowitz SJ. The effect of sleepiness on performance monitoring: I know what I am doing, but do I care? J Sleep Res. 2006;15:15–21. doi: 10.1111/j.1365-2869.2006.00503.x. [DOI] [PubMed] [Google Scholar]
- Nieuwenhuis S, Ridderinkhof KR, Blom J, Band GP, Kok A. Error-related brain potentials are differentially related to awareness of response errors: Evidence from an antisaccade task. Psychophysiology. 2001;38:752–760. [PubMed] [Google Scholar]
- Niki H, Watanabe M. Cingulate unit activity and delayed response. Brain Res. 1976;110:381–386. doi: 10.1016/0006-8993(76)90412-1. [DOI] [PubMed] [Google Scholar]
- Polli FE, Barton JJ, Vangel M, Goff DC, Iguchi L, Manoach DS. Schizophrenia patients show intact immediate error-related performance adjustments on an antisaccade task. Schizophr Res. 2006;82:191–201. doi: 10.1016/j.schres.2005.10.003. [DOI] [PubMed] [Google Scholar]
- Polli FE, Barton JJ, Cain MS, Thakkar KN, Rauch SL, Manoach DS. Rostral and dorsal anterior cingulate cortex make dissociable contributions during antisaccade error commission. Proc Natl Acad Sci U S A. 2005;102:15700–15705. doi: 10.1073/pnas.0503657102. [DOI] [PMC free article] [PubMed] [Google Scholar]
- Polli FE, Barton JJ, Thakkar KN, Greve DN, Goff DC, Rauch SL, et al. Reduced error-related activation in two anterior cingulate circuits is related to impaired performance in schizophrenia. Brain. 2008;131:971–986. doi: 10.1093/brain/awm307. [DOI] [PubMed] [Google Scholar]
- Rabbitt PM. Errors and error correction in choice-response tasks. J Exp Psychol. 1966;71:264–272. doi: 10.1037/h0022853. [DOI] [PubMed] [Google Scholar]
- Rubinov M, Sporns O. Complex network measures of brain connectivity: Uses and interpretations. Neuroimage. 2009 doi: 10.1016/j.neuroimage.2009.10.003. [DOI] [PubMed] [Google Scholar]
- Taylor SF, Stern ER, Gehring WJ. Neural systems for error monitoring: Recent findings and theoretical perspectives. Neuroscientist. 2007;13:160–172. doi: 10.1177/1073858406298184. [DOI] [PubMed] [Google Scholar]
- Ullsperger M, von Cramon DY. The role of intact frontostriatal circuits in error processing. J Cogn Neurosci. 2006;18:651–664. doi: 10.1162/jocn.2006.18.4.651. [DOI] [PubMed] [Google Scholar]
- Ullsperger M, von Cramon DY. Neuroimaging of performance monitoring: Error detection and beyond. Cortex. 2004;40:593–604. doi: 10.1016/s0010-9452(08)70155-2. [DOI] [PubMed] [Google Scholar]
- Ullsperger M, von Cramon DY, Muller NG. Interactions of focal cortical lesions with error processing: Evidence from event-related brain potentials. Neuropsychology. 2002;16:548–561. doi: 10.1037//0894-4105.16.4.548. [DOI] [PubMed] [Google Scholar]
- Woods SW. Chlorpromazine equivalent doses for the newer atypical antipsychotics. J Clin Psychiatry. 2003;64:663–667. doi: 10.4088/jcp.v64n0607. [DOI] [PubMed] [Google Scholar]
- Yeung N, Botvinick MM, Cohen JD. The neural basis of error detection: Conflict monitoring and the error-related negativity. Psychol Rev. 2004;111:931–959. doi: 10.1037/0033-295x.111.4.939. [DOI] [PubMed] [Google Scholar]
Associated Data
This section collects any data citations, data availability statements, or supplementary materials included in this article.