
Figure 7.
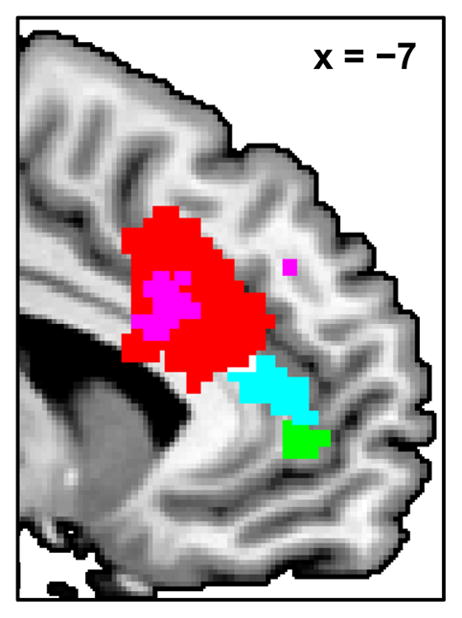
The results shown separately in Figures 4 and 5 for comparison of locations within medial frontal cortex: the main effect of error across both groups (red), and the greater effects of error (cyan), error likelihood (green), and error unexpectedness (violet) for controls compared to patients.