

Abstract
Maintaining attention and performance over time is an essential part of many activities, and effortful cognitive control is required to avoid vigilance decrements and interference from distraction. Regions at or near right middle frontal gyrus (Brodmann’s area (BA) 9), as well as in other prefrontal and parietal areas, are often activated in studies of sustained attention (e.g., Cabeza & Nyberg, 2000; Kim et al., 2006; Lim et al., 2010). This activation has often been interpreted as representing the engagement of cognitive control processes. However, such studies are typically implemented at one level of task difficulty, without an experimental manipulation of control demands. The present study used the distractor condition sustained attention task (dSAT), which has been used extensively in animals to determine the role of neuromodulator systems in attentional performance, to test the hypotheses that BA 9 is sensitive to changes in the demand for cognitive control and that this sensitivity reflects an increased engagement of attentional effort. Continuous arterial spin labeling (ASL) was used to measure neural activity in sixteen healthy, young adults performing a sustained attention task under standard conditions and under a distraction condition that provided an experimental manipulation of demands on cognitive control. The distractor impaired behavioral performance and increased activation in right middle frontal gyrus. Larger increases in right middle frontal gyrus activity were associated with greater behavioral vulnerability to the distractor. These findings indicate that while right middle frontal gyrus regions are sensitive to demands for attentional effort and control, they may not be sufficient to maintain performance under challenge. In addition, they demonstrate the sensitivity of ASL methods to variations in task demands, and suggest that the dSAT may be a useful tool for translational cross-species and clinical research.
Keywords: Cognitive control, Sustained attention, Distraction, ASL perfusion fMRI, Fronto-parietal network
1.0 Introduction
The ability to sustain attention over long periods of time and detect relevant stimuli is critical for the factory worker monitoring an assembly line, the student sitting in lecture, and the driver negotiating rush-hour traffic. Adding distraction (e.g., your cell phone ringing while driving) increases the demands on top-down control in order to counteract declines in attentional performance. In keeping with these real life examples, sustained attention tasks usually involve both “bottom-up” attention processes associated with the detection and processing of relevant signals and “top-down” processes associated with determining which inputs are relevant, ignoring irrelevant inputs, and maintaining the appropriate task set over time in the face of competing internal or external demands (Kastner & Ungerleider, 2000; Sarter et al., 2001; Sarter et al., 2006; Treisman & Gelade, 1980). Challenges to attention such as distractors, fatigue, sickness, or pharmacological manipulations place further demands on top-down control. These demands engage neuronal processes designed to enhance the detection and processing of targets, the filtering of distractors, and the modification of sensitivity and biases; in other words, the processes that collectively act to regain and stabilize motivated performance under challenging conditions (e.g., Sarter et al., 2006).
The behavioral and neural processes involved in sustaining attention and dealing with challenges to attention are of interest to researchers in several areas of basic and clinical science, but these fields often make limited contact with each other. Large discrepancies in methodology and in the specific experimental questions pursued by researchers in these fields often impede translation from one field to the next. For example, although it may be known that healthy young adult humans activate a region during an attention task, and that patients with a particular disorder have abnormal activations or atrophy of this same region, this information does little to improve drug development and treatment outcomes unless the neurotransmitter systems modulating that region are also carefully considered. Likewise, drug-development efforts based on molecular- and systems-level research in animal models without sufficient attention to construct and predictive validity in translation to humans often result in treatments with extremely limited effectiveness (Sarter, 2006; Sarter et al., 2010).
The present work helps to bridge the gap between basic and clinical research on sustained attention and challenges to attention by investigating in healthy humans the fMRI neural correlates of a task used extensively in rodents to determine the role of the cholinergic system in sustained attention and top-down control (McGaughy & Sarter, 1996; Hasselmo & Sarter, 2010). Validation studies demonstrate that rats and humans show qualitatively similar patterns of behavior on the task (Demeter et al., 2008), making the task a useful tool for research integrating behavioral and cognitive neuroscience methods and giving it strong translational potential for patient and drug-development studies (Nuechterlein et al., 2009). In addition, a relatively unique aspect of this task is that it includes both a basic sustained attention task (SAT) and a distractor condition (dSAT) designed to challenge attentional performance. As described below, the distractor condition allowed us to experimentally test the hypothesis that the right middle frontal gyrus (MFG) activation often seen in sustained attention studies reflects the engagement of processes that maintain attention and performance (e.g., Cabeza & Nyberg, 2000; Lawrence et al., 2003; Lim et al., 2010).
Each trial of the basic sustained attention task (SAT) requires participants to monitor for a brief, variable-duration signal (a small, centrally-presented visual stimulus). The signal occurs on only some trials (usually 50%) and the trial interval in which it may occur varies in duration, increasing uncertainty and requiring participants to maintain attention throughout the entire interval. In the subsequent response period, participants indicate whether the signal did (signal event) or did not (nonsignal event) occur. Stimulus detection per se is thought to be largely driven by bottom-up attention processes (i.e., capture of attention by a sudden-onset signal), although maintaining performance over time and in the face of the uncertainties caused by the unpredictable occurrence, timing, and duration of the stimulus requires some top-down control (see discussion in Sarter & McGaughy, 1998). Challenges to attentional performance are manipulated through the distractor (dSAT) condition, in which a rapidly-changing background (flashing houselight for rats, strobing background screen for humans) makes discrimination of signal and nonsignal events more difficult and impairs performance.1 Previous behavioral work in humans has also shown dSAT performance is sensitive to top-down manipulations, as shifts in the reward contingencies (penalty on misses) for the task result in a shift in the distribution of misses and false alarms (Demeter et al., 2008).
In rats, SAT and dSAT performance is strongly associated with right prefrontal and parietal regions. SAT performance results in increased release of acetylcholine in right medial prefrontal cortex (Arnold et al., 2002; Kozak et al., 2006; 2007), an increase not seen in control tasks with matched sensory, motor, and reward components (Arnold et al., 2002; Dalley et al., 2001). Furthermore, cholinergic activity within these frontal regions and cholinergically-mediated projections to parietal cortex appear to be particularly important for performance during the distractor (Broussard et al., 2009; Gill et al., 2000). Challenges to attention, including the distractor manipulation used in the present study, typically result in reduced performance but performance-associated increases in right prefrontal acetylcholine release. These increases in acetylcholine release are thought to reflect increased attentional effort, or the recruitment of attentional systems in order to help maintain or improve performance under challenging circumstances, and the engagement of top-down control (Kozak et al., 2006; see also review by Sarter et al., 2006). Right prefrontal cortex is thus considered a critical part of the neural circuitry mediating interactions between top-down and bottom-up attention, based in part on bidirectional circuitry between prefrontal cortex and basal forebrain as well as limbic regions which influence the basal forebrain (Brooks et al., 2007; Broussard et al., 2009; Gaykema et al., 2992; Sesack et al., 1989; Zmarowski et al., 2007).
In humans, EEG studies of sustained attention often show increases in widespread slow-wave theta activity over the course of a task, thought to represent increased drowsiness or drifts of attention (e.g., Paus et al., 1997), although frontal-midline theta increases are often associated with increases in attentional demand (Sauseng et al., 2007). fMRI studies of sustained attention are rather limited, in part because the long task blocks often required by sustained attention tasks are not well-suited to investigation with traditional BOLD fMRI. However, two recent investigations (Kim et al., 2006; Lim et al., 2010) circumvented this limitation by using arterial spin labeling (ASL) methods. Unlike BOLD methods, ASL imaging results in time-series data mostly free from autocorrelation noise and less susceptible to temporal drift, allowing for long task blocks and detection of the slow, low-frequency signal changes of interest in investigations of the tonic components of maintaining attention over time (e.g., Aguirre et al., 2002, Liu et al., 2005, Mumford et al. 2006). These studies found right-lateralized frontal activations associated with sustained attention performance, with Lim et al. (2010) also finding right parietal activations. Furthermore, Lim et al. found that those participants with high resting-state activity in right middle frontal gyrus pre-task and with the greatest reductions in resting-state activity post-task showed the greatest decline in performance (slowdowns in reaction time during a psychomotor vigilance task) over the course of the task period.
The right middle frontal gyrus (MFG, at or near BA 9) activation frequently seen in sustained attention tasks is at least grossly consistent with the right-lateralized pattern seen in rodent studies (c.f., Martinez & Sarter, 2004; see Brown & Bowman, 2002 for a discussion of homologies between rat and human frontal cortex). This activation is often interpreted as reflecting top-down control processes that sustain attention and performance (e.g., Lim et al., 2010; see also Cabeza & Nyberg, 2000 and Lawrence et al., 2003), although control demand was not experimentally manipulated in these previous investigations. Instead, this relationship is typically inferred from group-level activation in a task designed to measure sustained attention, correlations with behavioral performance, or time-on-task effects on activation – but always at one level of difficulty or cognitive-control demand in the task itself. Time-on-task effects provide a quasi-experimental manipulation of demand, but their interpretation has been ambiguous. For example, decreases in right MFG activity as a function of time on task have been variously interpreted as reflecting increased automaticity and reduced demands on control processes, a decline in motivation over time, or a depletion of attentional resources (e.g., Coull et al., 1998, Lim et al., 2010; Paus et al., 1997).
The current block-design ASL fMRI study experimentally manipulates demands on cognitive control via the distractor manipulation. The SAT condition emphasizes bottom-up, stimulus-driven processes in a simple detection task, whereas the dSAT increases demands on top-down attention by introducing distraction. This procedure allows us to determine which aspects of the sustained attention network are modulated by distraction-related increases in the demand for attentional control. If right MFG is sensitive to attentional control demands, activation within this region should increase during the distractor condition relative to task performance without distraction. We also sought to examine the relationship between the hypothesized distraction-related increases in activation and behavioral performance during the distractor. If participants with the smallest declines in performance showed the largest increase in right MFG activity, it would suggest that the right MFG is important to the implementation of the specific processes that help sustain attentional performance in the face of a challenge to attention. On the other hand, if as the rodent literature suggests, the participants with the largest increases in right MFG activation showed the biggest declines in performance, this would suggest that right MFG activation reflects a motivated increase in attentional effort, rather than capability to maintain performance.
2.0 Materials and methods
2.1 Participants
Participants consisted of 16 young adults (8 female, mean age = 22 years, range = 19 – 29 years). Data from an additional 4 participants were excluded due to excessive head motion (greater than 3 mm translation or 3 degrees rotation in any plane). All participants were right-handed as determined by the Edinburgh Handedness Scale (Oldfield, 1971), scored at least a nine on the Extended Range Vocabulary Test (ERVT, Version 3, Educational Testing Services (ETS), 1976; mean score = 23.3, range = 10.75 – 43), had corrected-to-normal visual acuity, and did not report conditions known to affect attention or memory. The vocabulary test was used to screen out participants who might have had difficulty understanding the instructions or who were unmotivated or uncooperative. Each participant practiced the experimental tasks both outside of the scanner and in the scanner prior to acquisition of the functional runs. Participants were financially compensated at a rate of $20/hour. Sessions lasted ~1.5 hours. Participants also received a small financial reward for performance on correct trials. Participant recruitment and experimental procedures were in accordance with protocols approved by the University of Michigan’s Institutional Review Board.
2.2 Experimental task
A PC with E-Prime software (Psychology Software Tools) was used for stimulus presentation and data acquisition. Visual stimuli were projected onto a screen at the back of the bore of the magnet. Participants viewed the screen using mirrored goggles. Auditory stimuli were delivered binaurally through MR-compatible headphones. Headphone volume was adjusted for each participant so that they could hear the auditory stimuli over the background noise of the scanner. Responses were made using the right and left index fingers and recorded with an MR-compatible response box.
Participants were tested on the sustained attention task (SAT) and the distractor-condition sustained attention task (dSAT; Figure 1). For the SAT, the standard “silver” color in E-prime was used as the background color. On each trial participants monitored for the presence or absence of a signal (3.5 mm2 gray square in the center of the screen) of varying durations (17, 29, or 50 ms). The time before the signal occurred (signal event) or did not occur (nonsignal event) varied unpredictably (1,000, 2,000 or 3,000 ms) to prevent anticipatory responses and to encourage participants to sustain attention and monitoring throughout. One hundred milliseconds after the occurrence of a signal or nonsignal event, the response period was cued by a 75 ms low-frequency buzzer. Participants had 1000 ms to make a response before the onset of the next trial. Participants responded with one index finger for signal trials and with their other index finger for nonsignal trials (left-right assignments to signal or nonsignal trials counterbalanced across participants). Separate responses for signal and nonsignal events allowed true misses (failures to detect the signal) to be assessed separately from omission errors (failures to respond). A 75 ms high-frequency feedback tone followed correct responses. No feedback was given following incorrect trials or omissions (failure to respond within 1000 ms after the response cue). Signal and nonsignal trials were randomized and equally presented within each task block. Signal duration and the time before a signal or nonsignal event were also randomized within each block.
Figure 1. Sustained Attention Task (SAT).

Participants completed 140 and 160 s blocks of the SAT and distractor condition SAT (dSAT). After 1, 2 or 3 s a short signal appeared (signal trials) or did not appear (nonsignal trials). Signal and nonsignal trials were pseudo-randomized and equally presented. After a short, constant delay, participants heard a low frequency buzzer (response cue). Participants then made a button-press response to indicate whether a signal had or had not occurred on that trial. Correct responses (both hits and correct rejections) generated a high frequency feedback tone signaling a monetary reward; incorrect responses and omissions did not receive any feedback. During dSAT blocks, participants performed the SAT in the presence of a visual distractor, the screen flashing silver to black at 10 Hz.
Participants received two cents for every percentage point of overall accuracy and were penalized 5 cents for the percentage of misses. The penalty on misses has previously been shown to encourage false alarms, particularly under conditions of increased uncertainty like the dSAT (see Demeter et al., 2008). The dSAT condition is identical to the SAT, except that while participants are performing the task the background screen alternates between silver and black at 10 Hz. Signals were always presented on the silver background.
2.3 Block design
Participants completed four functional runs. Each run contained four 150 ± 10 s task blocks with 40 s of fixation between blocks. Two runs alternated between blocks of SAT and blocks of dSAT. The other two runs alternated between dSAT and blocks of distractor fixation (dFIX) designed as a visual control for the strobing screen in the dSAT. During the dFIX blocks, the screen alternated from silver to black at 10 Hz with a fixation cross in the center of the screen. There was no task to do during dFIX blocks. This block design allowed us to address our main questions concerning changes in activation between different conditions (dSAT, SAT, dFIX and fixation), but was not designed to separate out neural activity for task parameters such as trial type (signal or nonsignal), signal duration, or the time before a signal or nonsignal event.
2.4 FMRI parameters
Continuous arterial spin labeling (CASL) was used to allow for long task blocks and detect the tonic components of maintaining attention over time (e.g., Aguirre et al., 2002, Liu et al., 2005, Mumford et al. 2006). ASL was chosen over BOLD methods because given the long periodicity of the dSAT paradigm, BOLD analyses would have been severely confounded by low frequency autoregressive noise (AR; Aguirre 2002). Zarahn et al. (1997) characterized the noise properties of null BOLD FMRI data and observed an inverse frequency relationship with the power spectrum of the noise. This “1/f” pattern can also be characterized with an AR noise model. Most importantly, at very low frequencies the intrinsic noise becomes prohibitively high and severely reduces the sensitivity of BOLD data. The fundamental frequency of our blocked design task was approximately 0.005 Hz, well in the range of the sensitivity loss predicted by Zarahn et al. (1997).
While the long periodicity of the dSAT paradigm would result in BOLD analyses severely confounded by low frequency AR noise, ASL techniques are very well suited for this sort of situation. Indeed, Aguirre et al. (2002) predicted that ASL data become more sensitive than BOLD data at paradigm frequencies slower than 0.006 Hz, an observation subsequently corroborated by Wang et al. (2003). Previous work demonstrated (Liu et al., 2005, Mumford et al., 2006) ASL’s alternating control – tag acquisition sequence modulates the perfusion effects (i.e., the baseline perfusion and the changes in perfusion due to the paradigm) by a frequency corresponding to half of the sampling rate. This modulation means that in the frequency domain, those perfusion effects get shifted from the low end to the high end of the spectrum, and away from the AR noise. The perfusion effects are then no longer confounded with the low frequency noise present in the BOLD effect. One could perform pair-wise subtractions of the ASL time course (or a number of other subtraction schemes as well) and effectively remove the low frequency noise altogether, but a Generalized Least Squares analysis of the unsubtracted data yields the most efficient parameter estimates in most cases (Mumford et al., 2006).
While ASL techniques have several advantages over BOLD techniques, especially for long task blocks, their lower sensitivity has limited their use in studies of higher cognition (see discussion by Olson et al., 2006 and by Kim et al., 2006). To optimize our ability to detect activations for this first neuroimaging study of the dSAT paradigm, the arterial signal was preserved by not using post-labeling delays or flow crushers. Hence, the resulting images were flow-weighted images rather than quantitative perfusion images. Although the quantitative data provided by some other methods have advantages for some research questions (e.g., longitudinal studies, pharmacologic studies), those were not of central interest here. Instead, the methods were chosen to optimize detection and sensitivity to the differences in condition, and specifically to allow us to identify which brain regions were sensitive to the demands of performance during the distraction condition (dSAT) after controlling for base task performance (SAT) and visual stimulation (dFIX).
A 3 T Signa LX system (GE, Milwaukee, WI) whole-body scanner was used for imaging. CASL was carried out by a separate transmitter coil placed on the participant’s neck, as described in Zhang et al. (1995), to avoid magnetization transfer effects (Hernandez-Garcia et al., 2004; Talagala et al., 2004). The standard GE birdcage coil was used for imaging. The labeling coil was a custom figure-8 coil (described in Hernandez-Garcia et al., 2004; Hernandez-Garcia et al., 2005) powered by a separate signal generator (PTS 500, Programmed Test Resources Inc., Littleton, MD) and a RF amplifier (custom-built by Henry Radio Supply, Los Angeles, CA). The RF amplifier was gated by TTL pulses from the MRI scanner. Tagged-control image pairs were collected using a spin echo acquisition sequence (TR, 5 s; TE, 12 ms; FOV, 24 cm; 12 slices, 7 mm thick with 1 mm spacing between slices; in plane resolution, 3.75 × 3.75 mm, tagging time was 3.5 s). Slices were prescribed from top to bottom to maximize the signal from the labeled spins. Anatomical images were collected in-plane with the functional images using T1-weighted gradient-echo (GRE) sequence (TR, 250 ms, TE, 5.4 ms; flip angle, 90°; in-plane resolution 0.86 × 0.86 mm). Each participant completed four functional runs of 164 time points each. The first four time points of each run consisted of only fixation and were discarded.
2.5 Behavioral analysis
Task responses were recorded as hits, misses, correct rejections, false alarms and omissions. We restricted our analysis to our central questions about the effects of distraction and signal duration on task performance in order to reduce the number of Type I errors. The main dependent variable used for analysis was the SAT score (also known as vigilance index, or VI), a measure that reflects performance on both signal and nonsignal trials. SAT score is used instead of the sensitivity index (SI; Frey, 1973) because unlike SI, the SAT score is not confounded by errors of omission. The SAT score is calculated for each signal duration using the proportion of hits and the proportion of false alarms via the formula SAT score = (hits − false alarms)/[2(hits + false alarms) − (hits + false alarms)2]. SAT scores vary from −1 to +1, with −1 indicating all responses were misses or false alarms and +1 indicating all responses were hits or correct rejections.
For all analyses, the Huyhn-Feldt sphericity correction was applied as needed. Corrected F and p values are reported, but degrees of freedom are rounded to integers for ease of reading. For repeated measures ANOVAs, effect sizes were computed using generalized eta squared (η2G; Olejnik & Algina, 2003). Bakeman (2005) suggested for η2G sizes 0.02 be classified as small, 0.13 as medium, and 0.26 as large, similar to η2 guidelines (Cohen, 1988). For t tests, effect sizes were reported using Cohen’s d, with corrections for repeated measures (Cohen, 1988).
A repeated-measures ANOVA on all of the dSAT blocks showed no difference in performance among the four experimental runs (F(3, 45) = 1.50, p = 0.23, η2G = 0.02). Therefore, the dSAT blocks from only the two runs that contained both SAT and dSAT blocks were used for behavioral analysis, so that the time on each task was matched. A 2 × 3 repeated-measures ANOVA was conducted on SAT scores from these SAT and dSAT blocks with the factors of distraction (SAT, dSAT) and signal duration (17, 29 or 50 ms). Separate repeated-measures ANOVAs were conducted on omissions.
2.6 fMRI analyses
All analyses were carried out in FSL 4.0 (FMRIB’s Software Library; Smith et al., 2004). Functional images were corrected for asynchronous slice acquisition (using FSL’s slicetimer) and for head movement using MCFLIRT (Motion Correction using FMRIB’s Linear Image Registration Tool; Jenkinson et al., 2002). Unsubtracted time-series data were analyzed using a generalized least squares model (Mumford et al., 2006)2. Data were spatially smoothed with a three-dimensional Gaussian filter (10 mm kernel) and pre-whitened using FILM (FMRIB’s Improved Linear Model) to improve estimation efficiency of the time-series data. A high pass filter of 380 s was applied.
Custom regressors were entered into FEAT 5.92 (FMRI Expert Analysis Tool; Beckmann et al., 2003; Woolrich et al., 2001) to construct a model (design matrix) of the observed time series. This model consisted of regressors characterizing effects of SAT, dSAT, dFIX and fixation blocks on the ASL signal. Although the data were collected using a spin echo acquisition sequence, the model also contained regressors to account for any residual BOLD effects in the ASL time series. The BOLD-related regressors modeled the onset through offset of the blocks convolved with a standard hemodynamic response function and the perfusion-related effects modeled out the tag and control image pairs (implicitly modeling a pair-wise subtraction, see Mumford et al., 2006). Contrasts were performed for the following: SAT – fixation, dSAT – fixation, dSAT – dFIX and dSAT – SAT. Registration was carried out via FLIRT (FMRIB’s Linear Image Registration Tool; Jenkinson et al., 2002; Jenkinson & Smith, 2001); each functional run was registered to an MNI (Montreal Neurological Institute) T2-weighted template with dimensions 2 mm × 2 mm × 2 mm. The contrasts on the parameter estimates were hierarchically fed up into a second-level fixed-effects analysis within subjects to combine the two pairs of conceptually-identical runs (1 pair of runs with dSAT and SAT blocks, 1 pair of runs with dSAT and dFIX blocks).
To examine how the current dataset corresponded with the sustained attention results seen in the ASL study by Kim et al. (2006), region of interest (ROI) analyses were conducted. Peaks from Kim et al. (2006) were converted from Talaraich to MNI space using GingerALE (www.brainmap.org). The contrasts of parameter estimates obtained from the GLM analysis were averaged within thresholded spheres with 8 mm radii, which were created based on coordinates within 12 mm of the Kim et al. (2006) peak coordinates using in-house software (ORTHO 2005, http://www.eecs.umich.edu/~hernan/Public/Programs/). The contrasts of interest corresponded to three main task conditions (SAT, dSAT, and dFIX). Estimates for fixation blocks were omitted from this analysis as there are fewer time points per block compared to the other conditions, and fixation did not factor into the main comparisons of interest for this analysis.
For the whole brain analyses, third-level mixed-effects analyses were performed to generate the mean group effects across subjects. Group level t-tests were conducted to ask which regions showed greater activation for SAT blocks than for fixation, for dSAT blocks than fixation, for dSAT blocks than dFIX blocks, and greater activation for the dSAT blocks than for the SAT and dFIX blocks (a “tripled” t-test, see FEAT version 5.92 User Guide). Significant clusters were determined using a Z statistic threshold of 3.0 to first define contiguous clusters and then a (corrected) cluster significance threshold of p = 0.001 (Worsley, 2001).
Finally, in order to assess the relationship between neural activity and behavioral performance on the SAT and dSAT, ROI analyses were performed based on peak coordinates from the whole brain analyses. Two ROIs were used: a region in right MFG (BA 9, centered on MNI coordinates (36, 10, 34)) and a region in right cuneus (BA 7, centered on MNI coordinates (10, −68, 32)). The contrasts of parameter estimates obtained from the GLM analysis were averaged within thresholded spheres with 8 mm radii using in-house software (ORTHO 2005, http://www.eecs.umich.edu/~hernan/Public/Programs/). The contrast values from these regions were correlated with participants mean SAT scores on the dSAT blocks with distraction. For the right MFG region the contrast values were also correlated with the distractor effect, or the difference between each participant’s mean SAT scores without distraction and their mean scores with distraction, in order to see how neural activity estimates related to the amount a participant was impaired by the distractor. For these analyses, behavioral data from the two runs that contained both SAT and dSAT blocks were used and Pearson’s correlation coefficients are reported.
3.0 Results
3.1 Distractor-evoked impairments in attention
The behavioral results obtained within the scanner in this experiment generally replicated the effects found in our previous non-fMRI studies (Demeter et al., 2008). ANOVA analyses focusing on the SAT score measure of attentional performance showed that both distraction and signal duration influenced performance, and that the impact of signal duration was more evident under distracting conditions. The hit and false alarm data from which the SAT score is derived are reported in Table 1. Omissions were generally low, occurred at a relatively consistent rate across blocks (3.27 % ± 51 per block) and did not significantly differ for the SAT and dSAT conditions (p = 0.11).
Table 1. Hit and false alarm proportions for dSAT and SAT blocks.
Data are means (standard error around the mean). Distraction is present during the dSAT blocks.
| Task | Hits to 50 ms signal | Hits to 29 ms signal | Hits to 17 ms signal | False Alarms |
|---|---|---|---|---|
| SAT | 0.96 (0.01) | 0.97 (0.01) | 0.94 (0.02) | 0.03 (0.01) |
| dSAT | 0.79 (0.04) | 0.75 (0.04) | 0.57 (0.03) | 0.31 (0.05) |
Figure 2 shows the mean SAT score and between-subject standard errors across conditions. Distraction significantly impaired performance across all durations, F(1,15) = 59.62, p < 0.0001, η2G = 0.60. Conversely, the duration effect was much stronger in the distractor condition than in the standard task, F(2,30) = 10.87, p = 0.001, η2G = 0.04. Post-hoc ANOVAs within the SAT and within the dSAT conditions found signal duration had little effect on performance in the SAT condition, F(2,30) = 1.70, p = 0.20, η2G = 0.02, although this should be interpreted with some caution given the near-ceiling performance across all durations in the SAT condition. In the distractor condition, however, duration had a small-to-medium effect on performance, F(2,30) = 17.40, p < 0.0001, η2G = 0.09, with lower levels of attentional performance seen for the shorter signal durations.
Figure 2. Distraction impairs task performance.

The bars show the mean SAT score (see text for calculation) collapsed across SAT (black bars) and dSAT (white bars) task blocks. Error bars represent between-subjects standard error around the mean. Chance performance is a SAT score of zero. While duration did not lead to strong effects within the SAT, the presence of distraction decreased performance in a duration-dependent manner, with the biggest deficits evident on the shortest signal duration condition.
These results show that the behavioral patterns found in the scanner replicate the findings from our previous non-fMRI studies (Demeter et al., 2008), and indicate that presentation of the distractor induces significant challenges to attentional performance. We next examined the neural correlates of task performance and the effect of distraction.
3.2 A priori region of interest analyses
Our first set of fMRI analyses focused on regions of interest (ROIs) based on a previous ASL study of sustained attention (Kim et al., 2006). (Please see section 2.6 fMRI Analyses for details of ROI creation and estimation of contrast values.) Two right frontal regions (right middle frontal gyrus and right medial frontal gyrus) were examined to test the hypotheses that task performance in the presence of the distractor would increase activation in right frontal attention networks. (See Supplemental Figure 1 for coordinates and overlap with voxel-wise activations.) An occipital region (right cuneus) was included to assess the perceptual effects of the flashing screen independent of task performance (i.e., in both the dSAT and dFIX conditions). The mean contrast values for each condition and between-subject standard errors are presented in Table 2.
Table 2. Contrast values on parameter estimates for ROI analyses.
Numbers represent mean (standard error) of the raw data for the contrast values on parameter estimates for the ROI analyses presented in Figure 3.
| Region | dSAT | SAT | dFIX |
|---|---|---|---|
| Right Middle Frontal Gyrus | 80.26 (8.97) | 74.73 (8.27) | 71.60 (7.98) |
| Right Medial Frontal Gyrus | 55.04 (6.67) | 50.44 (5.12) | 49.18 (5.65) |
| Right Cuneus | 21.56 (5.08) | 19.51 (4.35) | 22.47 (5.06) |
The Region by Block Type (SAT, dSAT, dFIX) interaction was significant (F(4,60) = 3.33, p = 0.03, η2G = 0.01), indicating that the pattern of activation associated with each block type differed as a function of brain region. As illustrated in Figure 3, the two right frontal regions showed greater activation associated with task performance under distraction (dSAT) than with passive viewing of the distractor (dFIX), and more activation when performing the task under distraction (dSAT) than when performing under conditions without distraction (SAT). These patterns are consistent with the hypothesis of right prefrontal involvement in attentional performance and modulation with distraction. In contrast, the right cuneus region showed less activation during task performance during distraction than under passive viewing of the distractor, and the small difference between the dSAT and SAT conditions is most easily explained by the different visual characteristics of the two conditions.
Figure 3. Region of interest analyses in frontal and occipital cortex.

Bars depict mean and between-subjects standard error of difference scores for the contrast values on the parameter estimates for dSAT – dFIX and dSAT – SAT. In right MFG and right medial frontal gyrus, dSAT activity is greater than dFIX activity and than SAT activity. However, in right cuneus, dSAT activity is greater than SAT, but not greater than dFIX activity. This suggests that while activation in visual regions during dSAT blocks is largely driven by the flashing screen, the visual stimulation does not fully account for the activity during dSAT blocks in frontal regions.
Formal analyses generally confirmed these observations. All three regions showed greater activation for the dSAT than SAT conditions (paired t-tests, all p < 0.05, Cohen’s d > 0.54). However, very different patterns were found for prefrontal cortex versus occipital cortex when considering the potential contributions of attentional task performance versus the passive visual stimulation provided by the distractor. For the right prefrontal regions, the dFIX condition (passive viewing of the flashing screen) had the lowest parameter estimates. Activation in this condition was significantly lower than in the dSAT condition (where the flashing screen was presented as a challenge to attention) for right MFG (t(15) = 2.46, p = 0.03, Cohen’s d = 0.62); the same pattern was marginally significant for the right medial frontal region, (t(15) = 2.05, p = 0.06, Cohen’s d = 0.51). In contrast, the right cuneus region showed no significant difference between the dFIX and dSAT conditions, p = 0.50, Cohen’s d = 0.17. In short, activation in the right prefrontal cortex was a function of task performance and attentional demands, whereas activation in right cuneus was dominated by the visual stimulation provided by the flashing screen.
3.3 Exploratory voxel-wise analyses
We next conducted exploratory voxel-wise analyses contrasting SAT and dSAT performance against a fixation baseline to reveal the regions associated with task performance in each of these two conditions. We also compared activations during dSAT performance against a distractor fixation (dFIX) condition that presented the flashing-screen distractor under passive viewing conditions, in order to control for visual-stimulation effects of the distractor that were unrelated to attentional performance. Finally, a fourth analysis illustrates those voxels specifically associated with attentional performance under distraction in the dSAT condition over and above activation associated with the SAT and visual stimulation of the distractor (dFIX). Figure 4 illustrates changes in activation across these different contrasts, and peaks are listed in Table 3. In general, the activations associated with sustained attention performance in the current study show good correspondence with those earlier reported by Kim et al. (2006; see Supplemental Figure 1 for overlap of ROIs used in section 3.2 with whole-brain results).
Figure 4. Activation in right frontal regions during SAT performance increases in the presence of distraction.
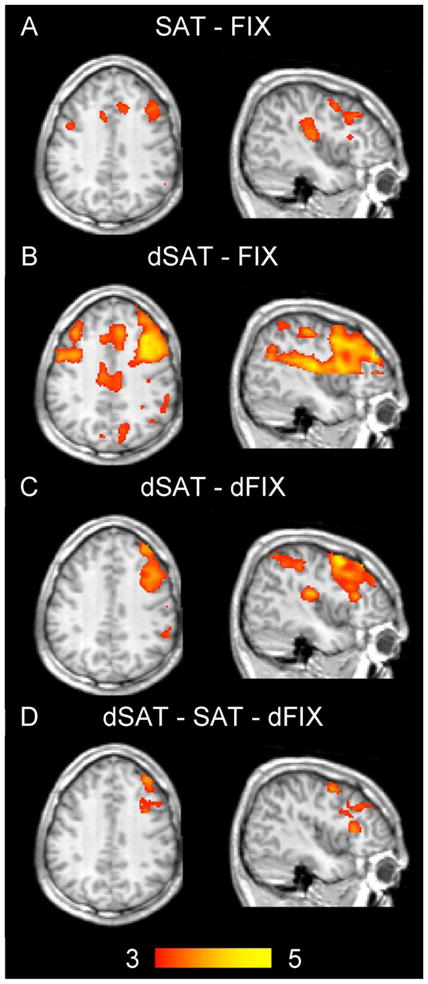
SAT performance (A) elicited activation in right dorsolateral prefrontal cortex as well as bilateral motor, cingulate and insular cortex regions. The presence of distraction (dSAT blocks, B) activated regions in frontal and parietal cortex. These regions were strongly right lateralized after controlling for the visual distractor stimulus (C). Compared to the SAT blocks, dSAT performance resulted in increased activation in parts of right dorsolateral prefrontal cortex (BA 9, D). Color bar indicates Z scores ranging from 3 to 5. Anatomical image represents the average of each subject’s normalized structural scan. Axial slices shown at z = 36, saggittal slices at x = 44, MNI coordinates.
Table 3. Clusters of significant activation by the SAT and dSAT tasks in whole-brain group analyses.
The cluster sizes are in voxels. For local maxima within these clusters, the anatomical labels of the nearest gray matter are reported. R. = Right. L. = Left. BA = Brodmann area. MNI = Montreal Neurological Institute.
| Contrast: Sustained Attention Task (SAT) versus fixation | ||||||
|---|---|---|---|---|---|---|
| Size (Voxels) | Anatomical Label | BA | MNI coordinates | Z score | ||
| x | y | z | ||||
| 3,453 | L. Insula | -- | −42 | −22 | 20 | 5.11 |
| L. Postcentral Gyrus | 43 | −53 | −10 | 16 | 4.69 | |
| L. Putamen | -- | −26 | 14 | 8 | 4.14 | |
| L. Cingulate Gyrus | 32 | −10 | 16 | 38 | 3.82 | |
| L. Precentral Gryus | 6 | −32 | −6 | 54 | 3.70 | |
| 2,835 | R. Middle Frontal Gyrus | 6 | 32 | 4 | 50 | 4.14 |
| R. Insula/Transverse Temporal Gyrus | 41 | 46 | −20 | 14 | 4.11 | |
| R. Insula | -- | 52 | −18 | 20 | 4.08 | |
| R. Inferior Parietal Lobule | 40 | 56 | −42 | 22 | 3.96 | |
| R. Precentral Gyrus | 6 | 30 | 0 | 52 | 3.73 | |
| R. Middle Frontal Gyrus | 9 | 44 | 22 | 34 | 3.64 | |
| R. Medial Frontal Gyrus | 8 | 8 | 26 | 48 | 3.30 | |
| Contrast: distractor condition Sustained Attention Task (dSAT) versus fixation | ||||||
| Size (Voxels) | Anatomical Label | BA | MNI coordinates | Z score | ||
| x | y | z | ||||
| 28,100 | L. Insula | -- | −34 | 22 | 6 | 5.49 |
| L. Middle Frontal Gyrus | 10 | −36 | 36 | 28 | 4.54 | |
| L. Superior Temporal Gyrus/Insula | 41 | −50 | −32 | 16 | 4.40 | |
| L. Precuneus | 31 | −4 | −68 | 22 | 4.33 | |
| L. Middle Frontal Gyrus | 9 | −36 | 30 | 34 | 4.29 | |
| L. Inferior Frontal Gyrus | 9 | −40 | 6 | 34 | 4.11 | |
| L. Cuneus | 7 | −12 | −76 | 30 | 4.00 | |
| L. Cingulate Gyrus | -- | −2 | −20 | 42 | 3.93 | |
| R. Middle Frontal Gyrus | 10 | 40 | 44 | 28 | 5.23 | |
| R. Precuneus | 31 | 10 | −62 | 20 | 5.15 | |
| R. Middle Frontal Gyrus | 10 | 34 | 50 | 24 | 5.13 | |
| R. Insula | -- | 42 | −22 | 14 | 5.10 | |
| R. Middle Frontal Gyrus | 9 | 36 | 14 | 36 | 5.02 | |
| R. Cuneus | 7 | 10 | −68 | 32 | 4.56 | |
| R. Cingulate Gyrus | 24 | 4 | −20 | 42 | 4.50 | |
| R. Cingulate Gyrus | 32 | 8 | 30 | 32 | 4.32 | |
| R. Postcentral Gyrus | 40 | 46 | −26 | 50 | 4.25 | |
| Contrast: distractor condition Sustained Attention Task (dSAT) versus distractor fixation (dFIX) | ||||||
| Size (Voxels) | Anatomical Label | BA | MNI coordinates | Z score | ||
| 4,793 | R. Middle Frontal Gyrus | 6 | 44 | 8 | 50 | 5.21 |
| R. Insula | -- | 28 | 20 | 6 | 4.60 | |
| R. Precentral Gyrus | 6 | 34 | −4 | 54 | 4.55 | |
| R. Middle Frontal Gyrus | 10 | 28 | 56 | 16 | 4.44 | |
| R. Middle Frontal/Inferior Frontal Gyrus | 9 | 36 | 10 | 30 | 4.43 | |
| R. Middle Frontal Gyrus | 9 | 42 | 20 | 34 | 4.00 | |
| R. Inferior Frontal Gyrus | 46 | 49 | 21 | 22 | 3.64 | |
| 2,757 | R. Insula/Superior Temporal Gyrus | 42 | 62 | −32 | 18 | 4.66 |
| R. Insula | -- | 46 | −22 | 16 | 4.52 | |
| R. Postcentral Gyrus | 43 | 58 | −16 | 20 | 4.26 | |
| R. Supramarginal Gyrus | 40 | 60 | −46 | 32 | 3.82 | |
| R. Intraparietal Sulcus/Inferior Parietal Lobe | 40 | 42 | −34 | 42 | 3.43 | |
| Contrast: distractor condition Sustained Attention Task (dSAT) versus Sustained Attention Task (SAT) and distractor fixation (dFIX) | ||||||
| Size (Voxels) | Anatomical Label | BA | MNI coordinates | Z score | ||
| x | y | z | ||||
| 1,661 | R. Middle Frontal Gyrus | 9 | 38 | 42 | 32 | 4.69 |
| R. Insula/Inferior Frontal Gyrus | 45 | 42 | 22 | 10 | 4.27 | |
| R. Middle Frontal Gyrus | 9 | 36 | 10 | 34 | 4.12 | |
| R. Middle Frontal Gyrus | 9 | 36 | 28 | 28 | 4.08 | |
| R. Precentral Gyrus | 6 | 44 | 0 | 52 | 4.08 | |
3.3.1 SAT performance activates bilateral frontal, temporal and insular regions
These patterns are again consistent with the involvement of right middle prefrontal gyrus regions in sustained attention. Additional activations were in motor regions (BA 6; bilateral precentral gyri), bilateral insula, and primary auditory cortex (right transverse temporal gyrus in or near BA 41). This latter activation was most likely related to the auditory cues for the response window and accuracy feedback.
3.3.2 Performance under distraction activates frontal, parietal, occipital and insular regions
As expected, the dSAT versus fixation contrast revealed a similar set of regions, but with greater extent and magnitude of activation (Figure 4B). Activation was seen bilaterally in middle frontal gyri (BA 9), frontal pole (BA 10), cingulate gyri (BAs 24 and 32), and in insula. Additional activations were seen in left superior temporal gyrus (BA 41), right postcentral gyrus (BA 40), and bilateral cuneus (BA 7) and precuneus (BA 31). The activations in cuneus and precuneus, regions involved in visual processing, were most likely related to the visual distractor stimulus in the dSAT blocks. In general, activations tended to be stronger on the right side of the brain than on the left for this contrast.
3.3.3 Controlling for the perceptual aspects of the distractor reveals a right-lateralized fronto-parietal network for performance under distraction
To control for the perceptual aspects of the dSAT condition, a contrast on the dSAT blocks versus the dFIX blocks was conducted. This contrast isolated the right frontal and parietal regions seen in the dSAT versus fixation contrast (Figure 4C). Shared regions of activation with the dSAT versus fixation and SAT versus fixation contrasts included right MFG and right insula. The dSAT versus dFIX contrast additionally activated right inferior frontal gyrus (BA 46), right frontal pole (BA 10), and several parietal regions (supramarginal gyrus, BA 40; right inferior parietal including intraparietal sulcus). These regions may be involved in processing related to maintaining attention to the location in which the signal might occur and detecting its onset amidst distraction. While SAT performance was associated with bilateral prefrontal activations, after controlling for the flashing stimulus presented in the dSAT condition, prefrontal activation in the dSAT condition was strongly right-lateralized. Although speculative, one possible explanation for this pattern is that maintaining performance under the distractor challenge required a stronger biasing of brain activity to top-down attentional networks (Fan et al., 2005).
3.3.4 Dorsolateral prefrontal cortex is especially sensitive to the demands of performance under distraction
To isolate the regions associated with performance under distraction while controlling for the visual stimulation of the distractor, a final contrast was conducted comparing the dSAT blocks to the SAT blocks and the dFIX blocks (Figure 4D). Voxels in the right MFG (BA 9) region previously seen in both tasks remained significantly activated in this contrast. This pattern is likewise consistent with the a priori ROI analysis and supports the hypothesis that this region is sensitive to performance demands and the challenge to performance introduced by the distractor. Of interest, this pattern appears to be restricted to right prefrontal cortex and does not extend significantly to parietal or other regions (Table 3), suggesting that right prefrontal cortex is especially sensitive to the challenge imposed by the distractor condition.
3.4 Brain-behavior analyses
At the group level, distraction reduced behavioral performance and increased activation in right middle frontal gyrus (BA 9). To further test our hypothesis that activation in this region reflects sensitivity to the challenges imposed by the distractor condition, we examined the correlations between individuals parameter estimates for the dSAT – SAT contrast within the right MFG (BA 9) ROI described in section 2.6 and their behavioral performance. To further test the interpretation that any correlations found reflected attentional effects and not simple visual stimulation, the correlation patterns for the right MFG region were compared with those for a visual region, right cuneus (BA 7).
3.4.1 Increased right dorsolateral prefrontal cortex activation during distraction is correlated with greater behavioral impairments
Overall, those subjects with greater dSAT – SAT contrast values for the ROI in right MFG (BA 9) had lower performance during the distractor condition (Figure 5A). The contrast values for this ROI were negatively correlated with performance (SAT score) in the distraction blocks for both the 50 ms (r = −0.60, p = 0.01) and 29 ms (r = −0.61, p = 0.01) signal durations, with a similar trend for the 17 ms signal duration (r = −0.47, p = 0.07). In other words, those subjects with greater right MFG activation during the distractor condition had worse performance during the distractor.
Figure 5. Right frontal activation during distraction correlates with behavioral performance decrements.

(A) Right MFG (BA 9, ROI centered on MNI coordinates (36, 10, 34)) activity was negatively correlated with SAT scores during distraction. Scatterplots depict participants contrast on the parameter estimate values for the dSAT – SAT contrast versus their mean SAT score for each signal duration during the task blocks with distraction. The contrast values were negatively correlated with the 50 and 29 ms SAT scores, with a trend for a negative correlation seen on the 17 ms SAT scores. (B) The contrast values for right MFG were also positively correlated with the distractor effect, or the difference for each participant between their mean SAT scores on blocks without distraction and their mean scores on blocks with distraction. (C) This pattern was not seen in visual regions, as no correlations were observed between contrast values in right cuneus (BA 7, ROI centered on MNI coordinates (10, −68, 32)). These data support the idea that the increased activity in right MFG during distraction is related to the increased attentional control demands of the dSAT condition.
Furthermore, distraction-related increases in activation (dSAT – SAT contrast values) in this region correlated not only with performance in the distractor, as described above, but more specifically, with the degree to which the participant’s performance was impaired by the distractor relative to the standard task (i.e., the distractor effect, Figure 5B). The distractor effect was calculated as the mean SAT score for the blocks without distraction minus the mean score for the blocks with distraction. Higher right MFG contrast values coincided with greater behavioral distractor effects, with the positive correlation significant for all three signal durations (all r > 0.51, p < 0.04).
In contrast to the pattern seen in right MFG, behavioral performance, regardless of whether it was assessed only during the distractor period or as the difference in performance between the SAT and dSAT conditions, was not correlated with right cuneus activation for any of the three signal durations (all r < −0.25, p > 0.35, Figure 5C). In fact, dSAT – SAT contrast values for other regions including motor cortex, insula, temporal cortex regions and other frontal regions like superior frontal gyrus were also not correlated with behavioral performance. This suggests that the patterns seen in right MFG are specific to that region, rather than a more general effect. In addition, neither the right MFG nor the cuneus regions showed correlations with response-time measures, all p < 0.10. Overall, these correlational data are consistent with the notion that the increase in right MFG activity during the distractor stems from the increased demands on attention, and is not just an artifact of visual stimulation.
Inspection of the evidence shown in Figure 5 raised the question of whether two groups were emerging in the data, a group with lower contrast values and a group with higher contrast values, and whether this might be affecting the correlation analyses. To explore whether the participants in the lower group simply had low perfusion in general, we extracted the whole brain mean contrast values for fixation for each participant. Most of the subjects in the lower group on the correlation graphs were indeed also in the bottom half of fixation contrast values. However, after controlling for the values during fixation using partial-correlation methods, the pattern of correlations described above still held: dSAT – SAT contrast values for right MFG were negatively correlated with SAT scores during distraction (all r > −0.55, p < 0.04) and positively correlated with the distractor effect (all r > 0.56, p < 0.03). No correlations were found again for right cuneus (all p > 0.55). Excluding the six participants that had the lowest dSAT – SAT contrast values in right MFG strengthened the correlations, increasing the negative correlations with SAT scores during distraction to all r > −0.65, p < 0.04 and the positive correlations with the distractor effect to all r > 0.64, p < 0.05. The correlations were still not significant for right cuneus. Given the regional specificity of the pattern of correlations seen and the results of these analyses, overall these data support the idea that distraction lowers behavioral performance and increases activation in right MFG.
4.0 Discussion
In the present study, we manipulated the demands on attentional load during a sustained attention task to identify which of the regions involved in sustained attention are specifically sensitive to demands for attentional control. Specifically, we hypothesized that right middle frontal gyrus (BA 9) would be particularly sensitive to the increased control demands of the distractor condition of our task. Furthermore, this study was aimed at establishing in healthy, young adult humans the neural correlates of a sustained attention task that has been extensively used in basic neuroscience research to investigate the precise contributions of defined neurotransmitter systems to attention- and performance-associated activity changes in frontal regions (e.g., McGaughy et al., 1996, Arnold et al., 2002; Kozak et al., 2006; 2007). Future work, including combined pharmacologic and neuroimaging studies, will determine the extent and boundaries of the correspondence between cognitive and behavioral neuroscience findings, with the long-term goal of understanding how specific neurotransmitter systems contribute to different aspects of the activation patterns seen with human neuroimaging methods.
4.0.1 Role of the right MFG in sustained attention and attentional control
The basic sustained attention task (SAT) activated right-lateralized frontal and parietal regions, corresponding to previous work (e.g., Kim et al., 2006; Lim et al., 2010; see also Cabeza & Nyberg, 2000). The distraction manipulation identified those regions specifically responsive to the increased demands for control imposed by the distractor. As predicted, right MFG showed this demand-sensitivity in both a priori ROI and exploratory voxel-wise analyses. These results, along with the correlation analyses, help to constrain interpretations of right MFG’s involvement in sustained attention tasks. At both the group mean and individual-differences levels of analysis, increases in right MFG activation were associated with reduced performance in response to the distractor.
4.0.2 Right MFG activity reflects increased attentional effort
One advantage of our paradigm is the ability to manipulate attentional control demands within the two conditions of our sustained attention task. Thus, while our correlation data remains indirect evidence on the role of the right MFG, the task design helps narrow down the possible interpretations. The distractor condition was designed to increase the demands associated with the task while minimizing the need for additional cognitive operations. Under these conditions, we found that those participants who had the greatest increases in right MFG activation during the distractor condition also had the largest drops in performance. No such correlations were found for reaction-time measures or between performance and activation in visual cortex. Furthermore, examination of the data revealed that trends in performance or activation change as a function of time on task were small and nonsignificant and omissions did not significantly vary with either time or condition, suggesting that the monetary incentive given to participants was sufficient to maintain performance throughout the session. Thus, distractor-related increases in right MFG activity and decreases in performance are not easily explained in terms of motivational differences, simple visual stimulation or general (noncognitive) arousal resulting from such stimulation, or time-on-task artifacts associated with longer response times. Instead, the most parsimonious explanation appears to be that activation in this region reflects an increase in attentional effort (Sarter et al., 2006), or the activation of attentional systems in an effort to maintain or improve performance under challenging conditions.
Somewhat in contradiction to the correlation patterns seen here, Lawrence et al. (2003) found that subjects with greater right MFG activity had better performance during a rapid visual information processing task. However, interpretation of those results is complicated by difficulties in determining the degree to which the higher right MFG (and other regions) activation seen in good performers was driven by the maintenance of attention per se as opposed to the working memory demands of the information processing task, which required participants to monitor a rapid stream of digits for three consecutive odd or even values. Rather than a fixation baseline, the authors used a baseline task for comparison that could also be construed as a sustained attention task, but with lower working-memory demands (monitoring for one specific digit, “0”, in the ongoing stream). Additionally, both the main task and the baseline task saw declines in accuracy or reaction time indicative of vigilance decrements, but these declines did not correlate with activation. Therefore, it is difficult to know the degree to which the higher right MFG activations seen in good performers in their study reflected better sustaining of attention per se, versus working memory processes involved in the storage, processing, and updating of memory representations of digits in the ongoing stimulus stream. Alternatively, the working memory demands of their task may have made a strong engagement of attentional effort essential for good performance.
Increases in attentional effort are thought to be under the control of the central executive (Baddeley, 1986) and the anterior attention system (Posner, 1994; Posner and Dehaene, 1994), including frontal and parietal regions. Attentional effort is thought to engage top-down attentional control processes that are employed in order to carry out goal-directed behaviors (Sarter et al., 2006). The right MFG results in this study support the idea that this region is particularly sensitive to the attentional control demands of a given task and is engaged to a greater extent under more demanding conditions. While further activation of the right MFG seen here does not seem to be sufficient to completely overcome the challenges to attention, its engagement and the engagement of downstream regions may help stabilize residual levels of performance and allow participants to stay on task.
Motivation from either extrinsic or intrinsic sources seems to be a key factor in whether or not participants will engage attentional control processes in order to continue performing under more difficult circumstances. For example, Tomporowski and Tinsley (1996) found that unpaid participants showed significantly greater vigilance decrements on a sustained attention task than paid participants performing the same task. In this sense, the feedback given on correctly-responded trials in the SAT and dSAT may be especially important, as a decline in feedback or reward for correct responses may help signal to the participants that they need to further engage attentional control processes. As discussed, the omissions data suggest that the current participants remained motivated throughout the scanning session. While the increases seen in right MFG were associated with the greatest drops in attentional performance, these participants may indeed have been increasing their attentional effort the most in order to continue to stay on task and perform to the best of their abilities under the difficult distraction condition.
4.0.3 Role of the cortical cholinergic input system in implementing attentional effort
The finding that decreased performance during the distractor condition was associated with increases in right frontal activation has a strong parallel to rodent research on the role of the cortical cholinergic system in sustained attention. Rats performing the rodent version of the dSAT had lower accuracy during the visual distractor condition than without distraction, but showed increases in right prefrontal activity (Gill et al., 2000). Similarly, rats given a pharmaceutical challenge showed impaired attentional performance, but a strong increase in right prefrontal acetylcholine release compared to task-performing control animals (Kozak et al., 2006). Other studies have shown that acetylcholine release is related to the number of completed trials (but not to the accuracy of those trials) and continued engagement in the task when demands on attention are increased (Passetti et al., 2000), further suggesting a motivated increase in effort that is not itself sufficient to maintain the quality of performance under challenge. However, manipulation of the frontal-parietal cholinergic system via drug or deafferentiation has dramatic effects on performance and interacts with the distractor (e.g., McGaughy & Sarter, 1996; Parikh et al., 2007; Broussard et al., 2009; Howe et al., 2010), suggesting that while performance- and challenge-related increases in right prefrontal activity and acetylcholine release are not sufficient to keep performance levels up, they are central and necessary to the motivated recruitment of the thalamic and parietal downstream systems that do.
More specifically, tonic increases in prefrontal activity and acetylcholine release are often described as increasing readiness for input processing, influencing the sensitivity and gain functions of structures and processes involved in detecting signals and activating the appropriate behavioral sets in response (e.g., Everitt & Robbins, 1997; Hasselmo, 1995; Hasselmo & McGaughy 2004; Parikh et al., 2007; Sarter & Bruno, 1997). Conceptually-related results have been reported in the EEG literature, where changes in tonic alpha power in posterior parietal and occipital regions, thought to reflect downstream effects of frontal-parietal control regions, modulate phasic responses to signal events (Dockree et al., 2007). It has also been suggested (Huang et al., 2008) that increases in tonic alpha during periods of poor performance may represent an increase in attentional effort, paralleling the interpretation of right MFG activation in the present study. Returning to the real-world example of driving performance described in the present paper’s introduction, Huang, Jung, & Makeig (2007) found that, subjects performing a driving-simulator task that required them to correct unpredictable experimenter-controlled vehicle drifts showed increases in tonic alpha (and in theta and beta) that were associated with periods of high error and challenged performance. Transient responses were also observed, with depressions in alpha before an error and transient rebounds in alpha when the deviation was detected and corrected.
4.0.4 Contribution of the cholinergic system to activity seen in fMRI and EEG studies
Currently, we can only speculate as to how changes in cholinergic neurotransmission may contribute to these patterns and more generally to demand-related increases in right frontal and parietal cortex activation seen in human fMRI and EEG studies. In the present study, we analyzed tonic, block-level activity, as this has more obvious relevance to the concept of sustained attention and to the tonic releases of acetylcholine measured in microdialysis studies. Likewise, the distractor was implemented at the block level and served as a general challenge to sustained attention, again in keeping with the overall concept of challenges to maintaining effort and attention over long task periods rather than trial-level variations in the number or similarity of nontarget lures. The corresponding limitation of this level of analysis is that we cannot directly examine or rule out the potential contributions of trial-level or sub-trial (e.g., cue versus response) effects (e.g., Drummond et al. 2005). Future investigations may make use of event-related or mixed block-event designs (Chawla et al., 1999; Donaldson, 2004; Visscher et al., 2003) to disentangle these effects and their interactions.
However, the close ties between the rodent and human versions of this task provide principled guidance for those speculations, and make it a promising tool for future pharmacologic-fMRI studies aimed at understanding the neurotransmitter systems that underlie activation changes seen in human neuroimaging studies. For example, animal investigations using the SAT suggest that tonic increases in prefrontal acetylcholine modulate transient responses related to the detection of and response to individual signal trials (Parikh et al., 2007). Preliminary data suggest that the transient cholinergic responses associated with individual signal trials do not vary with signal duration, whereas the thalamic glutamatergic responses that precede cholinergic transients do (Howe et al., 2010). These patterns lead to specific hypotheses for future human neuroimaging studies, e.g., pharmacologic manipulations that increase tonic acetylcholine levels should affect both block- and event-related related activations in frontal and parietal cortex, whereas manipulations of the glutamatergic system would be expected to more specifically influence event-related (transient) activations.
4.0.5 The dSAT as a tool for translational research
The dSAT’s potential for strong links between human neuroimaging studies and rodent systems-neuroscience studies also make it a useful task for clinical use and drug development (Nuechterlein et al., 2009). Notably, a recent meta-analysis (Minzenberg et al., 2009) identified right MFG in BA 9 as a major area of disruption in schizophrenia. We have recently developed an animal model of schizophrenia using the dSAT that implicates disruptions in the cholinergic modulation of frontal cortex in poor task performance and disruption by distraction (Sarter et al., 2009), further suggesting a link. This model, and the preceding research that led to its development, may help to explain, for example, why acetylcholinesterase inhibitors and α7 nicotonic acetylcholine receptor agonists have had only limited success in treating the cognitive symptoms of schizophrenia (Sarter et al., 2010). The strong connections between the human version of the SAT/dSAT and the analogous animal task allow the testing of precise biopsychological hypotheses on the control of attention and the neuronal mechanisms mediating attentional control deficits in schizophrenia, and potentially in other disorders.
4.1 Conclusions
In summary, the present experiment used ASL fMRI to reveal the neural regions activated during a sustained attention task with strong ties to the animal literature on sustained attention and top-down control. Our results extend the work of previous studies of sustained attention in humans, demonstrating that specific aspects of the sustained-attention network, particularly right prefrontal cortex, are sensitive to performance challenges and demands for top-down control. Greater activation of right prefrontal cortex during a distractor condition that challenged attention was associated with reduced performance, at both the group and individual levels. In combination with animal studies using this task, these patterns suggest that although these regions are an important part of the brain’s response to demands for increased attentional effort, they are not sufficient for preserving performance in the face of such demands. Future studies will test the hypothesis that this demand-sensitivity is cholinergically mediated in humans, as it appears to be in rodents, and evaluate the potential utility of the task as a tool for assessment and drug development in disorders of attention such as schizophrenia.
Supplementary Material
Acknowledgments
This research was supported by PHS grants R01MH086530 (MS, CL), R01EB004346 (LHG) and by a grant from the National Science Foundation (0726285, CL). ED was supported by an NSF Graduate Research Fellowship. We thank Rachel Engelmann for help with the ROI analyses and Dr. John Jonides for numerous discussions and suggestions.
Footnotes
The term “distractor” here is used in the general sense of irrelevant external inputs presumed to challenge the processing of targets and their discrimination from nontargets, not in the specific sense of nontarget lure items that often have strong perceptual similarities to target items, c.f., Gold et al., 2007.
Since respiratory and cardiac waveforms were not available, data were re-analyzed with a retrospective method for correcting physiological noise based on an in-house version of COMPCOR (Behzadi et al., 2007). This method did not improve group-level z-scores or change the general patterns of the results, thus we decided to present the data without the post-hoc corrections to keep the data closer to their original form.
Publisher's Disclaimer: This is a PDF file of an unedited manuscript that has been accepted for publication. As a service to our customers we are providing this early version of the manuscript. The manuscript will undergo copyediting, typesetting, and review of the resulting proof before it is published in its final citable form. Please note that during the production process errors may be discovered which could affect the content, and all legal disclaimers that apply to the journal pertain.
References
- Aguirre G, Detre J, et al. Experimental design and the relative sensitivity of BOLD and perfusion fMRI. Neuroimage. 2002;13:488–500. doi: 10.1006/nimg.2001.0990. [DOI] [PubMed] [Google Scholar]
- Arnold HM, Burk JA, Hodgson EM, Sarter M, Bruno JP. Differential cortical acetylcholine release in rats performing a sustained attention task versus behavioral control tasks that do not explicitly tax attention. Neuroscience. 2002;114:451–460. doi: 10.1016/s0306-4522(02)00292-0. [DOI] [PubMed] [Google Scholar]
- Baddeley AD. Working Memory. Oxford University Press; Oxford: 1986. [Google Scholar]
- Bakeman R. Recommended effect size statistics for repeated measures designs. Behav Res Methods. 2005;37:379–384. doi: 10.3758/bf03192707. [DOI] [PubMed] [Google Scholar]
- Beckmann CF, Jenkinson M, Smith SM. General multilevel linear modeling for group analysis in FMRI. Neuroimage. 2003;20:1052–1063. doi: 10.1016/S1053-8119(03)00435-X. [DOI] [PubMed] [Google Scholar]
- Behzadi Y, Restom K, Liau J, Liu TT. A component based noise correction method (COMPCOR) for BOLD and perfusion based fMRI. Neuroimage. 2007;37:90–101. doi: 10.1016/j.neuroimage.2007.04.042. [DOI] [PMC free article] [PubMed] [Google Scholar]
- Brooks JA, Sarter M, Bruno JP. D2-like receptors in nucleus accumbens negatively modulate acetylcholine release in prefrontal cortex. Neuropharmacology. 2007;53:455–463. doi: 10.1016/j.neuropharm.2007.06.006. [DOI] [PMC free article] [PubMed] [Google Scholar]
- Broussard JI, Karelina K, Sarter M, Givens B. Cholinergic optimization of cue-evoked parietal activity during challenged attentional performance. Eur J Neurosci. 2009;29:1711–1722. doi: 10.1111/j.1460-9568.2009.06713.x. [DOI] [PMC free article] [PubMed] [Google Scholar]
- Brown VJ, Bowman EM. Rodent models of prefrontal cortical function. Trends Neurosci. 2002;25:340–343. doi: 10.1016/s0166-2236(02)02164-1. [DOI] [PubMed] [Google Scholar]
- Cabeza R, Nyberg L. Imaging cognition II: An empirical review of 275 PET and fMRI studies. J Cogn Neurosci. 2000;12:1–47. doi: 10.1162/08989290051137585. [DOI] [PubMed] [Google Scholar]
- Chawla D, Rees G, Friston KJ. The physiological basis of attentional modulation in extrastriate visual areas. Nat Neurosci. 1999;2:671–676. doi: 10.1038/10230. [DOI] [PubMed] [Google Scholar]
- Cohen J. Statistical power analysis for the behavioral-sciences. 2. Hillsdale, NJ: Erlbaum; 1988. [Google Scholar]
- Coull JT. Neural correlates of attention and arousal: Insights from electrophysiology, functional neuroimaging and psychopharmacology. Progress in Neurobiology. 1998;55:343–361. doi: 10.1016/s0301-0082(98)00011-2. [DOI] [PubMed] [Google Scholar]
- Dalley JW, McGaughy J, O’Connell MT, Cardinal RN, Levita L, Robbins TW. Distinct changes in cortical acetylcholine and noradrenaline efflux during contingent and noncontingent performance of a visual attentional task. J Neurosci. 2001;21:4908–4914. doi: 10.1523/JNEUROSCI.21-13-04908.2001. [DOI] [PMC free article] [PubMed] [Google Scholar]
- Demeter E, Sarter M, Lustig C. Rats and Humans Paying Attention: Cross-Species Task Development for Translational Research. Neuropsychology. 2008;22:787–799. doi: 10.1037/a0013712. [DOI] [PMC free article] [PubMed] [Google Scholar]
- Dockree PM, Kelly SP, Foxe JJ, Reilly RB, Robertson IH. Optimal sustained attention is linked to the spectral content of background EEG activity: greater ongoing tonic alpha (similar to 10 Hz) power supports successful phasic goal activation. European Journal of Neuroscience. 2007;25:900–907. doi: 10.1111/j.1460-9568.2007.05324.x. [DOI] [PubMed] [Google Scholar]
- Donaldson DI. Parsing brain activity with fMRI and mixed designs: what kind of a state is neuroimaging in? Trends Neurosci. 2004;27:442–444. doi: 10.1016/j.tins.2004.06.001. [DOI] [PubMed] [Google Scholar]
- Drummond SPA, Bischoff-Grethe A, Dinges DF, Ayalon L, Mednick SC, Meloy MJ. The neural basis of the psychomotor vigilance task. Sleep. 2005;28:1059–1068. [PubMed] [Google Scholar]
- Everitt BJ, Robbins TW. Central cholinergic systems and cognition. Annual Review of Psychology. 1997;48:649–684. doi: 10.1146/annurev.psych.48.1.649. [DOI] [PubMed] [Google Scholar]
- Fan J, McCandliss BD, Fossella J, Flombaum JI, Posner MI. The activation of attentional networks. Neuroimage. 2005;26:471–479. doi: 10.1016/j.neuroimage.2005.02.004. [DOI] [PubMed] [Google Scholar]
- Frey P, Colliver J. Sensitivity and responsivity measures for discrimiation learning. Learn Motiv. 1973;4:327–342. [Google Scholar]
- Gaykema RPA, Vanweeghel R, Hersh LB, Luiten PGM. Prefrontal Cortical Projections to the Cholinergic Neurons in the Basal Forebrain. Journal of Comparative Neurology. 1991;303:563–583. doi: 10.1002/cne.903030405. [DOI] [PubMed] [Google Scholar]
- Gill TM, Sarter M, Givens B. Sustained visual attention performance-associated prefrontal neuronal activity: Evidence for cholinergic modulation. J Neurosci. 2000;20:4745–4757. doi: 10.1523/JNEUROSCI.20-12-04745.2000. [DOI] [PMC free article] [PubMed] [Google Scholar]
- Gold JM, Fuller RL, Robinson BM, Braun EL, Luck SJ. Impaired top-down control of visual search in schizophrenia. Schizophrenia Research. 2007;94:148–155. doi: 10.1016/j.schres.2007.04.023. [DOI] [PMC free article] [PubMed] [Google Scholar]
- Hasselmo ME. Neuromodulation and cortical function – modeling the physiological basis of behavior. Behavioural Brain Research. 1995;67:1–27. doi: 10.1016/0166-4328(94)00113-t. [DOI] [PubMed] [Google Scholar]
- Hasselmo ME, McGaughy J. High acetylcholine levels set circuit dynamics for attention and encoding and low acetylcholine levels set dynamics for consolidation. In: Descarries L, Krnjevic K, Steriade M, editors. Acetylcholine in the Cerebral Cortex. Elsevier Science Bv; Amsterdam: 2004. pp. 207–231. [DOI] [PubMed] [Google Scholar]
- Hasselmo ME, Sarter M. Modes and models of forebrain cholinergic neurotransmission in cognition. Neuropsychopharmacology Reviews. 2010 doi: 10.1038/npp.2010.104. [epub dated 7/28/10] [DOI] [PMC free article] [PubMed] [Google Scholar]
- Hernandez-Garcia L, Lee GR, Vazquez AL, Noll DC. Fast, pseudo-continuous arterial spin labeling for functional imaging using a two-coil system. Magn Res Med. 2004;51:577–585. doi: 10.1002/mrm.10733. [DOI] [PubMed] [Google Scholar]
- Hernandez-Garcia L, Lee GR, Vazquez AL, Yip CY, Noll DC. Quantification of perfusion fMRI using a numerical model of arterial spin labeling that accounts for dynamic transit time effects. Magn Res Med. 2005;54:955–964. doi: 10.1002/mrm.20613. [DOI] [PubMed] [Google Scholar]
- Howe WM, Sarter M. Prefrontal glutamatergic-cholinergic interactions for attention: glutamatergic coding of signal salience as a function of performance levels. In: Michotte Y, Westerink B, Sarre S, editors. Monitoring Molecules in Neuroscience. Printer TBD; Brussels, Belgium: 2010. In press. [Google Scholar]
- Huang RS, Jung TP, Makeig S. Event-related brain dynamics in continuous sustained-attention tasks. In: Schmorrow DD, Reeves LM, editors. Foundations of Augmented Cognition, Proceedings. Springer-Verlab Berlin; Berlin: 2007. pp. 65–74. [Google Scholar]
- Huang RS, Jung TP, Delorme A, Makeig S. Tonic and phasic electroencephalographic dynamics during continuous compensatory tracking. Neuroimage. 2008;39:1896–1909. doi: 10.1016/j.neuroimage.2007.10.036. [DOI] [PubMed] [Google Scholar]
- Jenkinson M, Smith S. A global optimisation method for robust affine registration of brain images. Med Image Anal. 2001;5:143–156. doi: 10.1016/s1361-8415(01)00036-6. [DOI] [PubMed] [Google Scholar]
- Jenkinson M, Bannister P, Brady M, Smith S. Improved optimization for the robust and accurate linear registration and motion correction of brain images. Neuroimage. 2002;17:825–841. doi: 10.1016/s1053-8119(02)91132-8. [DOI] [PubMed] [Google Scholar]
- Kastner S, Ungerleider LG. Mechanisms of visual attention in the human cortex. Annu Rev Neurosci. 2000;23:315–341. doi: 10.1146/annurev.neuro.23.1.315. [DOI] [PubMed] [Google Scholar]
- Kim J, Whyte J, Wang JJ, Rao HY, Tang KZ, Detre JA. Continuous ASL perfusion fMRI investigation of higher cognition: Quantification of tonic CBF changes during sustained attention and working memory tasks. Neuroimage. 2006;31:376–385. doi: 10.1016/j.neuroimage.2005.11.035. [DOI] [PMC free article] [PubMed] [Google Scholar]
- Kozak R, Bruno JP, Sarter M. Augmented prefrontal acetylcholine release during challenged attentional performance. Cereb Cortex. 2006;16:9–17. doi: 10.1093/cercor/bhi079. [DOI] [PubMed] [Google Scholar]
- Kozak R, Martinez V, Young D, Brown H, Bruno JP, Sarter M. Toward a neuro-cognitive animal model of the cognitive symptoms of schizophrenia: Disruption of cortical cholinergic neurotransmission following repeated amphetamine exposure in attentional task-performing, but not non-performing, rats. Neuropsychopharmacology. 2007;32:2074–2086. doi: 10.1038/sj.npp.1301352. [DOI] [PubMed] [Google Scholar]
- Lawrence NS, Ross TJ, Hoffmann R, Garavan H, Stein EA. Multiple neuronal networks mediate sustained attention. J Cogn Neurosci. 2003;15:1028–1038. doi: 10.1162/089892903770007416. [DOI] [PubMed] [Google Scholar]
- Lim J, Wu WC, Wang JJ, Detre JA, Dinges DF, Rao HY. Imaging brain fatigue from sustained mental workload: An ASL perfusion study of the time-on-task effect. Neuroimage. 2010;49:3426–3435. doi: 10.1016/j.neuroimage.2009.11.020. [DOI] [PMC free article] [PubMed] [Google Scholar]
- Liu TT, Wong EC. A signal processing model for arterial spin labeling functional MRI. Neuroimage. 2005;24:207–215. doi: 10.1016/j.neuroimage.2004.09.047. [DOI] [PubMed] [Google Scholar]
- Martinez VM, Sarter M. Lateralized attentional functions of cortical cholinergic inputs. Behav Neurosci. 2004;118:984–991. doi: 10.1037/0735-7044.118.5.984. [DOI] [PubMed] [Google Scholar]
- McGaughy J, Kaiser T, Sarter M. Behavioral vigilance following infusions of 192 IgG-saporin into the basal forebrain: Selectivity of the behavioral impairment and relation to cortical AChE-positive fiber density. Behav Neurosci. 1996;110:247–265. doi: 10.1037//0735-7044.110.2.247. [DOI] [PubMed] [Google Scholar]
- Minzenberg MJ, Laird AR, Thelen S, Carter CS, Glahn DC. Meta-analysis of 41 functional neuroimaging studies of executive function in schizophrenia. Arch Gen Psychiatry. 2009;66:811–822. doi: 10.1001/archgenpsychiatry.2009.91. [DOI] [PMC free article] [PubMed] [Google Scholar]
- Mumford JA, Hernandez-Garcia L, Lee GR, Nichols TE. Estimation efficiency and statistical power in arterial spin labeling MRI. Neuroimage. 2006;33:103–114. doi: 10.1016/j.neuroimage.2006.05.040. [DOI] [PMC free article] [PubMed] [Google Scholar]
- Nuechterlein KH, Luck SJ, Lustig C, Sarter M. CNTRICS final task selection: Control of attention. Schizophr Bull. 2009;35:182–196. doi: 10.1093/schbul/sbn158. [DOI] [PMC free article] [PubMed] [Google Scholar]
- Oldfield R. Assessment and analysis of handedness: Edinburgh inventory. Neuropsychologia. 1971;9:97–113. doi: 10.1016/0028-3932(71)90067-4. [DOI] [PubMed] [Google Scholar]
- Olejnik S, Algina J. Generalized eta and omega squared statistics: Measures of effect size for some common research designs. Psychol Methods. 2003;8:434–447. doi: 10.1037/1082-989X.8.4.434. [DOI] [PubMed] [Google Scholar]
- Olson IR, Rao HY, Moore KS, Wang JJ, Detre JA, Aguirre GK. Using perfusion fMRI to measure continuous changes in neural activity with learning. Brain and Cognition. 2006;60:262–271. doi: 10.1016/j.bandc.2005.11.010. [DOI] [PubMed] [Google Scholar]
- Parikh V, Kozak R, Martinez V, Sarter M. Prefrontal acetylcholine controls cue detection on multiple time scales. Neuron. 2007;56:141–154. doi: 10.1016/j.neuron.2007.08.025. [DOI] [PMC free article] [PubMed] [Google Scholar]
- Passetti F, Dalley JW, O’Connell MT, Everitt BJ, Robbins TW. Increased acetylcholine release in the rat medial prefrontal cortex during performance of a visual attentional task. European Journal of Neuroscience. 2000;12:3051–3058. doi: 10.1046/j.1460-9568.2000.00183.x. [DOI] [PubMed] [Google Scholar]
- Paus T, Zatorre RJ, Hofle N, Caramanos Z, Gotman J, Petrides M, Evans AC. Time-related changes in neural systems underlying attention and arousal during the performance of an auditory vigilance task. Journal of Cognitive Neuroscience. 1997;9:392–408. doi: 10.1162/jocn.1997.9.3.392. [DOI] [PubMed] [Google Scholar]
- Posner MI. Attention: the mechanisms of consciousness. Proc Natl Acad Sci USA. 1994;91:7398–7403. doi: 10.1073/pnas.91.16.7398. [DOI] [PMC free article] [PubMed] [Google Scholar]
- Posner MI, Dehaene S. Attentional networks. Trends Neurosci. 1994;17:75–79. doi: 10.1016/0166-2236(94)90078-7. [DOI] [PubMed] [Google Scholar]
- Sarter M, Bruno JP. Cognitive functions of cortical acetylcholine: Toward a unifying hypothesis. Brain Research Reviews. 1997;23:28–46. doi: 10.1016/s0165-0173(96)00009-4. [DOI] [PubMed] [Google Scholar]
- Sarter M, McGaughy J. Assessment of sustained and divided attention in rats: aspects of validity. Psychopharmacology (Berl) 1998;138:260–262. doi: 10.1007/s002130050669. [DOI] [PubMed] [Google Scholar]
- Sarter M, Givens B, Bruno JP. The cognitive neuroscience of sustained attention: where top-down meets bottom-up. Brain Res Rev. 2001;35:146–160. doi: 10.1016/s0165-0173(01)00044-3. [DOI] [PubMed] [Google Scholar]
- Sarter M, Gehring WJ, Kozak R. More attention must be paid: The neurobiology of attentional effort. Brain Res Rev. 2006;51:145–160. doi: 10.1016/j.brainresrev.2005.11.002. [DOI] [PubMed] [Google Scholar]
- Sarter M, Martinez V, Kozak R. A neurocognitive animal model dissociating between acute illness and remission periods of schizophrenia. Psychopharmacology (Berl) 2009;202:237–258. doi: 10.1007/s00213-008-1216-6. [DOI] [PMC free article] [PubMed] [Google Scholar]
- Sarter M, Lustig C, Taylor SF. Cholinergic contributions to the cognitive symptoms of schizophrenia and the viability of cholinergic treatments. Neuropharmacology (Special Issue: Schizophrenia) 2010 doi: 10.1016/j.neuropharm.2010.12.001. under review. [DOI] [PMC free article] [PubMed] [Google Scholar]
- Sauseng P, Hoppe J, Klimesch W, Gerloff C, Hummel FC. Dissociation of sustained attention from central executive functions: local activity and interregional connectivity in the theta range. European Journal of Neuroscience. 2007;25:587–593. doi: 10.1111/j.1460-9568.2006.05286.x. [DOI] [PubMed] [Google Scholar]
- Sesack SR, Deutch AY, Roth RH, Bunney BS. Topographical organization of the efferent projections of the medial prefrontal cortex in the rat - an anterograde tract-tracing study with phaseolus-vulgaris leucoagglutinin. Journal of Comparative Neurology. 1989;290:213–242. doi: 10.1002/cne.902900205. [DOI] [PubMed] [Google Scholar]
- Smith SM, Jenkinson M, Woolrich MW, Beckmann CF, Behrens TEJ, Johansen-Berg H, Bannister PR, De Luca M, Drobnjak I, Flitney DE, Niazy RK, Saunders J, Vickers J, Zhang YY, De Stefano N, Brady JM, Matthews PM. Advances in functional and structural MR image analysis and implementation as FSL. Neuroimage. 2004;23:S208–S219. doi: 10.1016/j.neuroimage.2004.07.051. [DOI] [PubMed] [Google Scholar]
- Talagala SL, Ye FQ, Ledden PJ, Chesnick S. Whole-brain 3D perfusion MRI at 3.0 T using CASL with a separate labeling coil. Mag Res Med. 2004;52:131–140. doi: 10.1002/mrm.20124. [DOI] [PubMed] [Google Scholar]
- Tomporowski PD, Tinsley VF. Effects of memory demand and motivation on sustained attention in young and older adults. American Journal of Psychology. 1996;109:187–204. [PubMed] [Google Scholar]
- Treisman AM, Gelade G. Feature-integration theory of attention. Cogn Psychol. 1980;12:97–136. doi: 10.1016/0010-0285(80)90005-5. [DOI] [PubMed] [Google Scholar]
- Visscher KM, Miezin FM, Kelly JE, Buckner RL, Donadson DI, McAvoy MP, Bhalodia VM, Petersen SE. Mixed blocked/event-related designs separate transient and sustained activity in fMRI. Neuroimage. 2003;19:1694–1708. doi: 10.1016/s1053-8119(03)00178-2. [DOI] [PubMed] [Google Scholar]
- Wang J, Aguirre GK, Kimberg DY, Roc AC, Li L, Detre JA. Arterial spin labeling perfusion fMRI with very low task frequency. Mag Res Med. 2003;49:796–802. doi: 10.1002/mrm.10437. [DOI] [PubMed] [Google Scholar]
- Woolrich MW, Ripley BD, Brady M, Smith SM. Temporal autocorrelation in univariate linear modeling of FMRI data. Neuroimage. 2001;14:1370–1386. doi: 10.1006/nimg.2001.0931. [DOI] [PubMed] [Google Scholar]
- Worsley KJ. Testing for signals with unknown location and scale in a chi(2) random field, with an application to fMRI. Adv Appl Probab. 2001;33:773–793. [Google Scholar]
- Zarahn E, Aguirre GK, D’Esposito M. Empirical analyses of BOLD fMRI statistics. I. Spatially unsmoothed data collected under null-hypothesis conditions. Neuroimage. 1997;5:179–97. doi: 10.1006/nimg.1997.0263. [DOI] [PubMed] [Google Scholar]
- Zhang WG, Silva AC, Williams DS, Koretsky AP. Nmr measurement of perfusion using arterial spin-labeling without saturation of macromolecular spins. Mag Res Med. 1995;33:370–376. doi: 10.1002/mrm.1910330310. [DOI] [PubMed] [Google Scholar]
- Zmarowski A, Sarter M, Bruno JP. Glutamate receptors in nucleus accumbens mediate regionally selective increases in cortical acetylcholine release. Synapse. 2007;61:115–123. doi: 10.1002/syn.20354. [DOI] [PubMed] [Google Scholar]
Associated Data
This section collects any data citations, data availability statements, or supplementary materials included in this article.