

Abstract
AIMS
(i) To describe the first-order and mixed-order elimination pathways of piperacillin, (ii) to determine the between occasion variability (BOV) of pharmacokinetic parameters and (iii) to propose optimized dosage regimens.
METHODS
We performed a five-period replicate dose study in four healthy volunteers. Each subject received 4 g piperacillin as a single 5 min intravenous infusion in each study period. Drug analysis was performed by HPLC. We used NONMEM and S-ADAPT for population pharmacokinetic analysis and Monte Carlo simulation to predict the probability of target attainment (PTA) with a target time of non-protein bound concentration above MIC >50% of the dosing interval.
RESULTS
A model with first-order nonrenal elimination and parallel first-order and mixed-order renal elimination had the best predictive performance. For a 70 kg subject we estimated 4.40 l h−1 for nonrenal clearance, 5.70 l h−1 for first-order renal clearance, 170 mg h−1 for Vmax, and 49.7 mg l−1 for Km for the mixed-order renal elimination. The BOV was 39% for Vmax, 117% for Km, and 8.5% for total clearance. A 30 min infusion of 4 g every 6 h achieved robust (≥90%) PTAs for MICs ≤12 mg l−1. As an alternative mode of administration, a 5 h infusion of 6 g every 8 h achieved robust PTAs for MICs ≤48 mg l−1.
CONCLUSIONS
Part of the renal elimination of piperacillin is saturable at clinically used doses. The BOV of total clearance and volume of distribution were low. Prolonged infusions achieved better PTAs compared with shorter infusions at similar daily doses. This benefit was most pronounced for MICs between 12 and 48 mg l−1.
Keywords: healthy volunteers, Monte Carlo simulation, piperacillin population pharmacokinetics/pharmacodynamics, saturable elimination, within subject variability/between occasion variability
WHAT IS ALREADY KNOWN ABOUT THIS SUBJECT
Despite the clinical use of piperacillin for more than two decades, there are still contradictory reports whether or not the elimination of piperacillin is saturable at clinically relevant concentrations.
Two recent studies that applied population pharmacokinetic (PK) modelling found evidence for a saturable component of piperacillin elimination, whereas other published population PK analyses found non-saturable elimination of piperacillin.
There is limited information on the between occasion variability of beta-lactams (including piperacillin) and such data might be important to maximize the effectiveness by individualizing beta-lactam dosage regimens.
WHAT THIS STUDY ADDS
Saturable and non-saturable components of renal elimination were identified for piperacillin and the unbound non-saturable renal clearance of piperacillin was similar to the glomerular filtration rate.
Between occasion variability of clearance and volume of distribution at steady-state of piperacillin was below 20% which indicated that the PK of piperacillin was predictable from one dosing interval to the next.
Monte Carlo simulation predicted 5 h infusions every 8 h and continuous infusion of piperacillin would be able to successfully treat infections by pathogens with a 2 to 4-fold (5 to 8-fold) higher MIC compared with 30 min infusions given every 6 h (every 8 h) at the same daily dose.
Introduction
Piperacillin-tazobactam shows good bactericidal activity against Pseudomonas aeruginosa and gram-positive microorganisms [1]. Therefore, piperacillin-tazobactam is an attractive choice for empirical therapy and is frequently used in the treatment of hospital-acquired infections [2]. Piperacillin is usually administered in combination with the beta-lactamase inhibitor tazobactam to prevent the enzymatic degradation of piperacillin. There are still contradictory reports on the pharmacokinetics (PK) of piperacillin despite its use for more than two decades. Two recent papers [2, 3] studied the population PK of piperacillin and found evidence for a possibly saturable clearance.
Bergan [4] reviewed the PK of acylureidopenicillins and concluded that drug exposure (as measured by the area under the curve, AUC) increases more than proportionally with rising doses, although the extent of saturability in piperacillin's elimination was rather small. This is likely the reason why some studies report a saturable clearance for piperacillin [5–9], whereas others find first-order elimination [10–19]. The protein binding of piperacillin is between 20 and 30% [20, 21]. Tjandramaga et al. [8] report that about 70% of the renal excretion of piperacillin is by tubular secretion and 30% by passive glomerular filtration. Tubular secretion is the most likely mechanism to explain mixed-order (capacity limited) renal elimination.
For beta-lactams the time that the non-protein bound drug concentration exceeds the minimal inhibitory concentration (MIC) (ft>MIC) has been found to predict best the ability of a dosage regimen to kill organisms (=target drug effect) [22–26]. The time course of the antibacterial concentration contributes to the clinical outcome which is of predominant importance for the patient. The clinical outcome is dependent on both (i) the time course of the drug effect (=contribution of the drug-dependent response) and (ii) the patient's ability to eradicate bacteria and recover from infectious damage. For penicillins animal experiments showed that bacteriostasis is achieved, if the ft>MIC is at least 30% of the dosing interval. Near-maximal bacterial killing is reached for ft>MIC of approximately 50% of the dosing interval [25–30].
Simulation can be used to predict how well target effects can be achieved after accounting for both the distribution of PK parameters and the distribution of the MIC. It can identify the dosage regimen with the highest probability to attain a target effect. This probability of target attainment (PTA) is then used as a surrogate measure for successful microbiological or clinical outcome.
As the outcome for beta-lactams is related to ft>MIC, several authors proposed either continuous infusion [23, 31–33] or prolonged intermittent infusion [33] to be superior to short intermittent administration. A loading dose at the initiation of therapy is often recommended to reach bactericidal concentrations as soon as possible. Several groups compared the clinical, microbiological, and economic outcomes, bactericidal activity and time above MIC between short intermittent and continuous infusions, e.g. for meropenem [34–38], ceftazidime [39–44] and piperacillin/tazobactam [45–49]. These trials concluded that clinical outcomes with continuous infusion were at least as safe and effective as intermittent treatment with short intermittent infusions, and economic outcomes were superior for continuous infusion. However, the short intermittent mode of administration is still the clinical standard, possibly due to the equipment and workload that is required for a continuous infusion.
As our first objective, a population PK model was developed to fit the plasma and urine data simultaneously and to account for first-order and mixed-order (saturable) elimination of piperacillin. Secondly, we sought to determine the between occasion variability (BOV) of the PK parameters. As our third objective, we compared the PTA between various dosage regimens using simulation to propose optimal dosage regimens for piperacillin.
Methods
Subjects
Four healthy Caucasian volunteers participated in the study. Each volunteer gave his/her written informed consent after a full explanation of the procedures involved in this study. The study was approved by the Investigational Review Board of the Medical Faculty and University Hospital of the University of Essen (Essen, Germany) and performed according to the revised version of the Declaration of Helsinki. Table 1 shows the demographic statistics and data summary. All subjects were shown to be healthy by physical examination, electrocardiography, and laboratory tests including urinalysis and screening for drugs of abuse. The volunteers did not take any medication other than the study drug from 2 weeks before the start until the end of the study. Food and fluid intake was strictly standardized. Consumption of alcohol or methylxanthines in any form was forbidden from 48 h before dosing until the last sample in the respective study period.
Table 1.
Data summary
| Min | Median | Max | |
|---|---|---|---|
| Number of piperacillin plasma samples per subject (per subject and occasion) | 73 (13) | 76 (15) | 78 (16) |
| Number of piperacillin urine samples per subject (per subject and occasion) | 40 (7) | 41 (8) | 42 (10) |
| Age (years) | 22 | 23 | 24 |
| Weight (kg) | 67 | 77.5 | 85 |
| Height (cm) | 164 | 176 | 178 |
| Number of females/males | 2/2 | ||
The subjects were hospitalized from the evening before administration until the last blood sample of the respective study period. All subjects were closely observed by physicians for the occurrence of adverse events during the period of drug administration. They were asked to report immediately any discomfort and to answer questionnaires on their health status on a daily basis.
Study design and drug administration
The study was conducted as a single-centre, open, five-period replicate dose study. Piperacillin was dissolved in 50 ml sterile water for injection. Each of the four subjects received the same formulation containing 4 g piperacillin as a 5 min intravenous infusion in each of the five study periods (occasions). Doses were given on days 1, 3, 10, 24, and 52. All infusions were administered with motorized syringes that were closely controlled during the study period. The calibration of the motor syringes was checked on a daily basis. The infusions were administered through an indwelling venous catheter, which was placed in the forearm.
Sampling schedule
All blood samples were drawn in 5 ml NH4+-heparinate tubes (Sarstedt, Nümbrecht, Germany) from a forearm vein via an intravenous catheter contralateral to the one used for drug administration. Blood samples were drawn immediately before the start of infusion, at the end of the 5 min infusion as well as at 5, 10, 15, 20, 30, 45 min, and 1, 1.5, 2, 2.5, 3, 3.5, 4, 5, 6, 8, 10, 12 and 24 h after the end of each infusion. All blood samples were immediately placed in an ice-water bath for 10 to 15 min before centrifugation. The plasma samples were then frozen on dry ice and stored at −70°C until analysis.
Urine was collected before drug administration, between the start of infusion and 1 h after the end of the infusion, as well as at 1–2, 2–3, 3–4, 4–6, 6–8, 8–10, 10–12, and 12–24 h after the end of each infusion. The urine samples were stored at 4°C during the collection period. The amount and pH of the urine were measured. Samples were immediately frozen and stored at −70°C until analysis.
Determination of plasma and urine concentrations
Piperacillin concentrations in plasma and urine were determined by HPLC. For drug determination in plasma, a sample volume of 100 µl was deproteinized with 200 µl acetonitrile containing mezlocillin as internal standard. After mixing and centrifugation at 21 885 g, a volume of 40 µl was injected onto the HPLC-system. For determination of piperacillin in urine, 20 µl of the sample were diluted with 180 µl water. After mixing 40 µl were injected onto the HPLC-system. Drug concentrations were determined using a reversed phase column (C18, 5 µm, 250 × 4.6 mm I.D.), 0.01 m potassium dihydrogen phosphate (pH 6.2) : acetonitrile mobile phase (4:1; v : v) with a flow of 2 ml min−1. Both piperacillin and the internal standard were detected at 220 nm.
The plasma samples were measured against a plasma calibration row and urine samples against a urine calibration row. For control of inter-assay variation spiked quality controls in plasma and urine were prepared. No interference was observed in plasma and urine for piperacillin and the internal standard. Calibration was performed by linear regression and linearity of piperacillin calibration curves in plasma and urine was shown from 1.0 to 150 mg l−1 and 1.0 to 1000 mg l−1. Quantification limits were identical to the lowest calibration levels. The inter-day precision and the analytical recovery of the spiked quality control standards in human plasma ranged from 3.5 to 9.2% and 95.0 to 106.9% for piperacillin. The inter-day precision and the analytical recovery of the spiked quality control standards in human urine ranged from 3.0 to 5.5% and 92.0 to 97.9%.
Models
Disposition and drug elimination
The plasma and urinary excretion data allowed renal and nonrenal elimination mechanisms to be distinguished. We considered one, two, and three compartment disposition models and studied the following pathways for piperacillin elimination: (i) first-order nonrenal (CLNR) and first-order renal clearance (CLR), (ii) first-order nonrenal clearance and mixed-order (Vmax and Km) renal elimination and (iii) first-order nonrenal clearance and parallel first-order + mixed-order renal elimination.
The formula for the population clearance (CLPOP) of the full model (model 3) as a function of the piperacillin concentration (C) in the central compartment is:
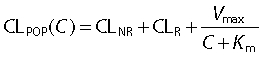 |
(1) |
Size
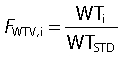
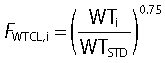
We applied the allometric weight model to scale the PK parameters according to a standard weight of 70 kg [50–53]. The FWTV,i and FWTCL,i are the fractional changes in volume and clearance in the ith subject with weight WTi compared with a standard weight WTSTD of 70 kg.
 |
(2) |
 |
(3) |
Individual pharmacokinetic model
Population parameter variability (PPV) is the sum of between subject variability (BSV) and within subject variability (WSV). WSV can be further divided into between occasion variability (BOV) and within occasion variability (WOV). WOV cannot be estimated with conventional PK methods. We estimated BOV from the average of WSV over an occasion. Each of the five study periods was one occasion. For the analysis in NONMEM, we treated the dataset as if there were 20 separate individuals and estimated the PPV from these 20 profiles of plasma concentrations and amounts in urine. Analysis of variance (anova) was performed on log transformed quantities. anova was used to estimate the BOV of the individual PK parameters from population PK and from non-compartmental analysis.
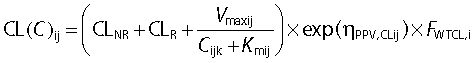
Parameter variability was estimated as variances but we report the square root of the estimates in Table 3 and 4 and refer to these values as PPV and BOV, respectively. We have expressed PPV and BOV in the text as a percentage because these quantities are apparent coefficients of variation of a normal distribution on a logarithmic scale. In the population PK model, ηPPV is assumed to be a normally distributed random variable with mean zero and standard deviation PPV. We used an exponential parameter variability model for all PK parameters. The parameter variability model for Vmax, Km, CL, and Vss was (see Table 3 for parameter explanations):
Table 3.
Population parameter estimates (from NONMEM V and S-ADAPT) of the three compartment model with first-order nonrenal elimination and parallel first-order and mixed-order renal elimination for piperacillin
| Parameter | NONMEM (PPV = BSV + BOV) | S-ADAPT (PPV) |
|---|---|---|
| CLNR (for 70 kg)* (l h−1) | 4.40 | 4.61 (21.4%) |
| CLR (for 70 kg)* (l h−1) | 5.70 (9.62%‡,¶) | 6.64 (11.1%) |
| Vmax (for 70 kg)* (mg h−1) | 170 (50.4%§) | 67.9 (17.2%) |
| Km (mg l−1) | 49.7 (150%§) | 11.1 (134%) |
| Vss (for 70 kg)† (l) | 12.7 (13.5%‡) | 13.3 |
| V1 (for 70 kg)† (l) | 7.00 | 7.15 (13.9%) |
| V2 (for 70 kg)† (l) | 2.95 | 3.28 (2.2%) |
| V3 (for 70 kg)† (l) | 2.71 | 2.92 (14.9%) |
| CLicshallow (for 70 kg)* (l h−1) | 12.7 | 16.7 (3.5%) |
| CLicdeep (for 70 kg)* (l h−1) | 1.28 | 1.65 (22.5%) |
| CVC | 12.5% | 12.8% |
| SDC (mg l−1) | 0.447 | 0.415 |
| CVAU | 24.6% | 17.7% |
| SDAU (m)g | 3.89 | 4.18 |
PPV (population parameter variability), CVC is the proportional and SDC is the additive residual error component for the plasma concentrations. CVAU is the proportional and SDAU is the additive residual error component for the amounts excreted in urine (see methods section for details).
The allometric model with a standard body weight of 70 kg and an exponent of 0.75 was used to scale the clearance terms and Vmax.
The allometric model with a standard body weight of 70 kg and an exponent of 1.0 was used to scale the volume of the central and both peripheral compartments.
Correlation between pairs of random effects: r(CLtot,Vss) = 0.84.
r(Vmax,Km) = 0.99.
PPV for CLNR and CLR combined (see methods for details). CLNR, nonrenal clearance describing the first-order nonrenal elimination; CLR, renal clearance describing the first-order renal elimination; Vmax, maximum rate of elimination for the mixed-order renal elimination; Km, plasma concentration that results in a rate of 50% of Vmax; Vss, Volume of distribution at steady-state; V1, volume of central compartment; V2, volume of shallow peripheral compartment; V3, volume of deep peripheral compartment; CLicshallow, intercompartmental clearance between the central and shallow peripheral compartment; CLicdeep, intercompartmental clearance between the central and deep peripheral compartment.
| (4) |
| (5) |
 |
(6) |
| (7) |
| (8) |
ηPPV,NNij is the value of ηPPV for PK parameter NN for the ith subject at the jth occasion. The indices NNij denote the individual value for parameter NN for the ith subject at the jth occasion and Cijk is the individual plasma concentration at the kth time point. The parameters CLR, CLNR, Vmax, V1, V2, V3, and Vss are the population estimates for a 70 kg subject.
Visual predictive checks
We assessed the predictive performance of our PK models by simulation of plasma and urine profiles for 10 000 hypothetical subjects. The fidelity by which the central tendency and the variability of the observed data were described by the predicted median and intervals was assessed by visual inspection and compared between models. Further details of the visual predictive check methodology as applied here have been described by Bulitta et al. [54].
Normalized prediction distribution error (NPDE)
The NPDE [55] was used for model evaluation using the package developed by Comets et al. [56].
Observation model
We described the residual unidentified variability by a combined additive and proportional error model. C denotes the predicted concentration without residual error and YC is the individual prediction including a proportional (CVC) and additive (SDC) residual error component. The random variables  and
and  are normally distributed with mean zero and standard deviations CVC and SDC.
| (9) |
We estimated models with or without applying the Beal M3 method [57] to use samples with measurements below the limit of quantification (BQL) of 1 mg l−1 in the analysis. The Beal M3 method maximizes the probability that a concentration observed to be BQL is also predicted to be BQL.
A combined additive and proportional error model was used for the amounts excreted in urine. AU denotes the predicted amount excreted in urine without residual error and YAU is the individual prediction including a proportional (CVAU) and additive (SDAU) residual error component. The random variables  and are normally distributed with mean zero and standard deviations CVAU and SDAU.
| (10) |
Computation
We built all models with NONMEM version V release 1.1 (NONMEM Project Group, University of California, San Francisco, CA, USA) [58]. For model building, the first order conditional estimation (FOCE in NONMEM V) method with the interaction estimation option was used. All runs finished with at least four significant digits. We additionally estimated the final model in S-ADAPT (version 1.56) [59, 60] using the Monte Carlo Parametric Expectation Maximization algorithm (MC-PEM) and the Beal M3 method to account for BQL samples [61] as described previously [62]. S-ADAPT was also used to estimate both BSV and BOV. Due to the large number of parameters, a diagonal variance covariance matrix was estimated in S-ADAPT. WinNonlin™ Professional (version 4.0.1, Pharsight Corp., Mountain View, CA, USA) was used for non-compartmental analysis and anova statistics.
Assessment of PKPD profile
The time above MIC is commonly used to predict the microbiological and clinical outcome for beta-lactams. We used the PKPD targets ft>MIC≥ 50% of the dosing interval representing near-maximal killing and ft>MIC≥ 30% representing bacteriostasis for penicillins [25, 26, 63]. Additionally, the targets ft>MIC≥ 70%, and ft>MIC= 100% were evaluated to cover a wider range of PKPD targets. We compared the PKPD profile of various dosage regimens including short (30 min) infusion, prolonged (5 h) infusion, and continuous infusion at daily doses between 9 and 18 g 70 kg−1 total body weight.
The plasma concentration–time profiles for 10 000 hypothetical subjects were simulated at steady-state for each dosage regimen in the absence of residual error. To mirror the larger variability in patients, additional Monte Carlo simulations were run with increased variances in total clearance and volume of distribution at steady-state (CV for total clearance increased from 9.6% to 45%, CV for Vss increased from 13.5% to 45%; covariance was selected to keep the coefficient of correlation at the final estimate in healthy volunteers). PTA [64] was estimated from the frequency of achieving the target in 10 000 simulated profiles under different treatment schedules and parameter assumptions. We derived the PTA within the MIC range from 1 to 96 mg l−1 and used a protein binding of 30% for piperacillin [20, 21] using qualified Perl scripts [54]. The PKPD breakpoint was defined as the highest MIC for which the PTA was at least 90%.
Results
The PK parameters from non-compartmental analysis (Table 2) were in concordance with results of other studies [2–4].
Table 2.
PK parameters from non-compartmental analysis after a-5 min intravenous infusion of 4 g piperacillin
| Average ± SD | Median (Min-Max) | |
|---|---|---|
| Peak concentration (mg l−1) | 463 ± 127 | 465 (279–775) |
| Time to peak (min) | 6.8 ± 2.5 | 5 (5–11) |
| Total clearance (l h−1) | 11.9 ± 1.34 | 11.9 (9.87–14.4) |
| Renal clearance (l h−1) | 7.59 ± 0.86 | 7.81 (5.31–8.78) |
| Nonrenal clearance (l h−1) | 4.33 ± 1.07 | 4.57 (2.21–6.30) |
| Volume of distribution at steady-state (l) | 12.7 ± 2.26 | 12.2 (9.47–16.9) |
| Fraction excreted unchanged in urine (%) | 63.9 ± 6.7 | 63.8 (52.8–79.8) |
| Terminal half-life (h) | 1.22 ± 0.461 | 1.04 (0.693–2.23) |
| Mean residence time (h) | 1.06 ± 0.15 | 1.01 (0.92–1.45) |
Model building
We selected between competing models by predictive checks, the objective function and standard diagnostic plots and found that a three compartment disposition model was superior to a one and two compartment disposition model. The three compartment model with first-order nonrenal and first-order renal elimination (model 1) over-predicted the amounts excreted in urine by 16% at 1 h and by 13% at 2 h post end of infusion (comparison based on the simulated and observed medians). Model 2 (first-order nonrenal and mixed-order renal elimination) showed an under-prediction by 10% at 1 h and an over-prediction by 14% at 2 h post end of infusion.
The model with first-order nonrenal and parallel first-order + mixed-order renal elimination (model 3, Figure 1) showed an under-prediction by 8% at 1 h and an over-prediction by 6% at 2 h post end of infusion. Model 3 had an 11.9 (NONMEM) (22.8 (S-ADAPT)) points better objective function compared with model 2 and a 48.1 (36.6) points better objective function compared with model 1. Model 3 had good predictive performance in plasma and urine (Figure 1) and was selected as the final model. The predictive performance for the final estimates from NONMEM was slightly better than for S-ADAPT. Therefore, the former estimates were used for simulation. The NPDE plots (Figure 1) showed the same trend as the visual predictive check and favoured the model with parallel first-order + mixed-order renal elimination (model 3). The NPDE yielded a mean (variance) of 0.02 (0.98) for plasma concentrations and 0.049 (0.87) for amounts in urine (model 3). The NPDE global statistic rejected the null hypothesis (P < 0.001) that all the observations arise from the same distribution as the model predictions. However, we note that the visual predictive check and NPDE plots show poor predictions at 5 min when a sample was taken at the end of the infusion. This was probably caused by the arterial-venous equilibration of piperacillin which was not implemented into the final model [65]. The NPDE global statistic accepted the predictions from model 3 for plasma concentrations at and after 1 h (P= 0.072) and for amounts in urine at and after 3 h (P= 0.13). Because this model failure will have no notable effect on the ft>MIC we have chosen to accept the model as being fit for purpose while recognizing the mispredictions during the first 50 min for plasma concentrations and during the first 2 h for amounts in urine (Figure 1).
Figure 1.
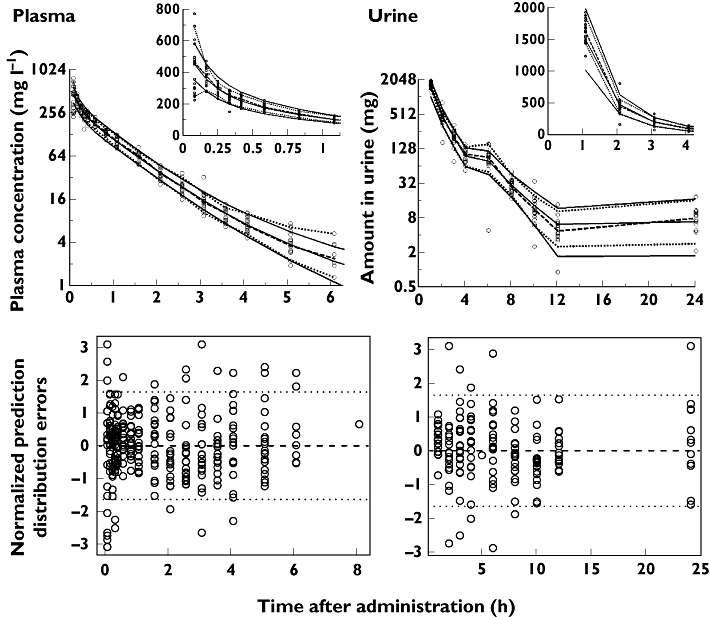
Visual predictive checks (VPC, top; insets show early VPC time profiles) and normalized prediction distribution errors (NPDE, bottom) for plasma concentrations and amounts excreted unchanged in urine: The VPC plots show the raw data (markers), the median and (10–90% percentile) of the observations (broken lines) and the median (10–90% percentile) of the model predictions (continuous lines). Ideally, each continuous line should match its corresponding broken line in the VPC plots
All disposition parameters were scaled allometrically. Since the number of subjects in our study was small (four subjects studied on five occasions), we did not seek to optimize the covariate model other than by including standard allometric models. The PK parameter estimates for model 3 are shown in Table 3. The estimates for the mixed-order renal elimination were 170 mg h−1 (PPV 50.4% coefficient of variation) for the maximum rate of elimination (Vmax) and 49.7 mg l−1 (PPV 150% CV) for the Michaelis-Menten constant (Km). Estimates from NONMEM and S-ADAPT were comparable, with the exception of a smaller Vmax and Km in S-ADAPT.
Figure 2 shows clearance as a function of concentration. Equation 1 predicts that the total clearance decreases from 13.5 l h−1 at a nominal concentration of 0 mg l−1 to 10.8 l h−1 at 200 mg l−1 piperacillin for a typical 70 kg subject. The anova based on individual PK parameter estimates yielded a low BOV for total clearance (8.5% CV) and volume of distribution at steady-state (16% CV), whereas Vmax (39%) and Km (117%) had higher BOVs (Table 4). Similar estimates were obtained, when BOV was estimated by a population PK model in S-ADAPT (Table 4) or NONMEM (results not shown) compared to the BOV estimates from ANOVA.
Figure 2.
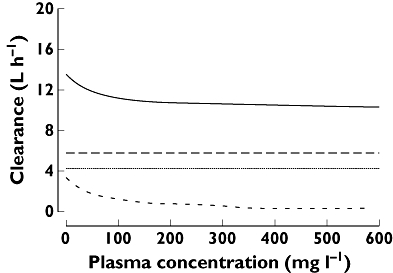
Renal, nonrenal and total clearance of piperacillin as a function of plasma concentration for a typical 70 kg subject. (The nonrenal clearance is constant, whereas the renal clearance has a mixed-order (saturable) and a first-order component and is therefore a function of the concentration). Total body chlearance ( ); First-order renal clearance (
 ); Non-renal clearance (
 ); Mixed-order renal clearance (
 )
)
Table 4.
Results from anova and S-ADAPT for the between subject (BSV) and between occasion (BOV) variability of PK parameters
| Coefficient of variation* | ||
|---|---|---|
| Parameter | anova (BOV) | S-ADAPT (BSV, BOV)† |
| Parameters from non-compartmental analysis | ||
| Total clearance | 8.5% | |
| Nonrenal clearance | 19% | 20.3%, 6.8% |
| Renal clearance | 8.0% | 9.2%, 6.1% |
| Volume of distribution at steady-state | 16% | |
| Volume of distribution of central compartment | 11.6%, 7.6% | |
| Mean residence time | 14% | |
| Terminal half-life | 35% | |
| Parameters from population PK analysis | ||
| Maximum rate of mixed-order elimination (Vmax) | 39% | 6.5%, 15.9% |
| Michaelis-Menten constant (Km) | 117% | 59.8%, 120% |
| Ratio of Vmax : Km | 77% | |
Apparent coefficient of variation for the variability of the individual PK parameter estimates based on the five study periods (occasions) within subjects.
BSV (between subject variability) and BOV (between occasion variability) are expressed as the apparent coefficient of variation of a log-normal distribution.
PKPD profile
As shown in the PTA vs. MIC profiles (Figure 3), continuous infusion of 9 g day−1 and prolonged infusion of 3 g every 8 h achieved PTAs >90% for MICs ≤16 mg l−1 for the near-maximal killing target ft>MIC≥ 50%. Those two regimens were superior to the 30 min infusion regimens of 4 g every 8 h and of 4 g every 6 h.
Figure 3.
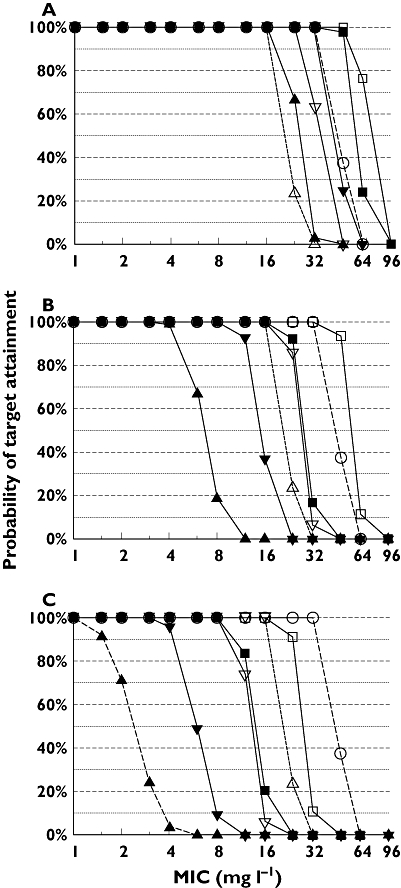
Probabilities of target attainment vs. MIC in healthy volunteers for various piperacillin (PIP) dosage regimens at steady-state for ft>MIC targets of ≥30% (A), ≥50% (B) or ≥70% (C). 30 min infusion of 4 g every 8 h 12 g ( ); 30 min infusion of 4 g every 6 h 16 g (
 ); 30 min infusion of 3 g every 4 h 18 g (
 ); 5 h infusion of 3 g every 8 h 9 g (
 ); 5 h infusion of 6 g every 8 h 18 g (
 ); Continuous infusion 9 g (
 ); Continuous infusion 18 g (
 )
)
Table 5 shows the PKPD breakpoints for all studied dosage regimens at various PKPD targets. A standard 30 min infusion regimen of 4 g every 8 h (daily dose 12 g) achieved a PKPD breakpoint of 4 mg l−1 for the near-maximal killing target in healthy volunteers. Giving 4 g every 6 h (daily dose 16 g) increased the breakpoint to 12 mg l−1 and giving 3 g every 4 h (daily dose 18 g) achieved a breakpoint of 24 mg l−1. At a lower daily dose of 9 g, 5 h infusion of 3 g every 8 h achieved a breakpoint of 16–24 mg l−1 (PTA = 86% at an MIC of 24 mg l−1). High dose 5 h infusion of 6 g every 8 h achieved a near-maximal killing breakpoint of 48 mg l−1. The PKPD breakpoints were similar between the studied regimens for the bacteriostasis target ft>MIC ≥ 30%. As expected, continuous infusion was superior to 30 min infusions for the PKPD targets ft>MIC≥ 70% and ft>MIC= 100%.
Table 5.
PKPD breakpoints for piperacillin based on variability in healthy volunteers or based on variability in patients†
| Daily | Target: ft>MIC at least | ||||
|---|---|---|---|---|---|
| dose | 30% | 50% | 70% | 100% | |
| PKPD breakpoint (mg l−1) in healthy volunteers/patients (highest MIC for which the PKPD target is achieved in at least 50% of patients‡) | |||||
| 30 min infusing of 4 g every 8 h | 12 g | 16/8† (24)‡ | 4/2 (6) | 1.5/0.5 (2) | 0.375/0.19 (0.5) |
| 30 min infusion of 4 g every 6 h | 16 g | 32/16 (32) | 12/4 (12) | 4/1.5 (4) | 1/0.5 (1.5) |
| 30 min infusion of 3 g every 4 h | 18 g | 48/24 (48) | 24/12 (24) | 8/4 (12) | 3/1.5 (4) |
| 5 h infusion of 3 g every 8 h | 9 g | 24/16 (32) | 16*/12 (24) | 8/6 (12) | 1/0.5 (2) |
| 5 h infusion of 6 g every 8 h | 18 g | 48/32 (64) | 48/24 (48) | 24/12 (24) | 3/1 (4) |
| Continuous infusion | 9 g | 16/8 (16) | 16/8 (16) | 16/8 (16) | 16/8 (16) |
| Continuous infusion | 18 g | 32/24 (32) | 32/24 (32) | 32/24 (32) | 32/24 (32) |
PTA was 86% at an MIC of 24 mg l−1.
Variability in total clearance and volume of distribution at steady-state was increased to 45% to mirror the larger variability in patients based on estimates from Lodise et al. [2].
Highest MIC for which the target can be attained by the ‘median’ patient. Simulations were run with the larger variability to mirror patients.
The PKPD breakpoints for simulations with a larger variability (perhaps more representative of sick patients) yielded approximately 1.5 to 3-fold lower PKPD breakpoints (Table 5) compared with healthy volunteers. Higher PKPD targets could be achieved if concentrations in patients with high clearances and short half-lives were titrated to the concentrations of the ‘median’ patient (Table 5).
Discussion
Piperacillin is frequently used in the empirical treatment of hospital-acquired infections. It is important to account for variability in PK during optimization of treatment regimens. For this task population PK modelling and Monte Carlo simulation are suitable tools. They can combine the variability in PK parameters with the expected distribution of MICs in the patient population of interest to select optimal dosage regimens [63, 66].
The data of some piperacillin studies that used population PK analysis did not support estimation of a saturable elimination component [19, 54], whereas Lodise et al. [2] and Vinks et al. [3] found evidence for saturable elimination of piperacillin. The latter two studies estimated a high variability for Vmax and Km of the saturable elimination process.
It is important to qualify a population PK model for use prior to using it for simulation to select optimal dosage regimens. Visual predictive checks showed (Figure 1) that our model adequately mirrored the central tendency and variability of the whole time course of plasma concentrations and amounts excreted in urine. The visual predictive checks and NPDE plots also revealed that simultaneous fitting of plasma concentrations and amounts excreted in urine was helpful to distinguish between the different elimination pathways.
In our study, elimination was best described by a first-order nonrenal and a parallel first-order + mixed-order renal elimination. The population estimate for the Michaelis-Menten constant of the mixed-order renal elimination (Km) of 49.7 mg l−1 (apparent coefficient of variation of 150%) was comparable with the estimate from Vinks et al. [3], who found an average (±SD) Km of 83.8 ± 94.3 mg l−1 and a median Km of 44.9 ± 62.1 mg l−1 in patients with cystic fibrosis. Lodise et al. [2] reported a higher Km of 245 ± 126 mg l−1 (average ± SD) for their dataset of 128 hospitalized patients. The maximum rate of the mixed-order renal elimination (Vmax) of 292 ± 501 mg h−1 (average ± SD) with a median of 142 mg h−1 from Lodise et al. was comparable with our estimate for Vmax of 170 mg h−1 (50.4% CV) whereas Vinks et al. found a median of 1401 mg h−1. These differences might arise, since Vinks et al. and Lodise et al. studied the combination of piperacillin and tazobactam, whereas we studied piperacillin alone. Although the PK of piperacillin is not much affected by the presence of tazobactam at dose ratios of 4:1 or 8:1 [20], this could contribute to the observed differences in Vmax and Km. Another potential reason for these differences is that Vinks et al. and Lodise et al. used non-parametric population PK whereas we applied parametric population PK methods. Our total clearance and volume of distribution at steady-state were comparable to the estimates from Lodise et al. [2] in healthy volunteers and Vinks et al. [3] in cystic fibrosis patients. One limitation of our study is its small sample size with four subjects each studied on five occasions.
Our estimated renal clearance of 5.70 l h−1 for the first-order component which corresponds to an unbound renal clearance of about 7.1–8.1 l h−1 (assuming a protein binding of 20–30% for piperacillin [20, 21]) is similar to the expected glomerular filtration rate in healthy volunteers. This suggests that the first order renal clearance is simply glomerular filtration with no net re-absorption. The estimate of 4.40 l h−1 for nonrenal clearance (Table 3) agrees well with the estimate of nonrenal clearance from non-compartmental analysis.
Tjandramaga et al. [8] and Bergan et al. [7] found a larger fraction of piperacillin excreted unchanged in urine at higher doses and Sörgel et al. [67] report a higher fraction of unchanged piperacillin excreted in urine at steady-state than after a single dose. Tjandramaga et al. [8] observed a decrease in renal and nonrenal clearance with increasing doses. However, Bergan et al. [4, 7] reported a decreased nonrenal clearance and no changes in renal clearance with increasing doses. These findings suggest the existence of a saturable nonrenal elimination of piperacillin. We tried to describe the nonrenal elimination as a mixed-order process. However, our data at a single dose level did not support estimation of an important contribution of saturable nonrenal elimination.
Lodise et al. [2] and Vinks et al. [3] both found a high variability for Vmax and Km of the saturable elimination process. Based on the data after replicate administrations, BOV of PK parameters was estimable in this study. If demographic characteristics like body size, body composition, age or genotype explained a major fraction of the variability in Vmax and Km, one would expect the BOV of Vmax and Km to be rather low (maybe <30% CV). However, we found high BOVs with an apparent coefficient of variation of 117% for Km, 39% for Vmax and 77% for the ratio of Vmax : Km (Table 4). Therefore, Vmax and Km had a high variability between the five study periods within subjects.
In contrast, BOV for total clearance (8.5%), renal clearance (8.0%), nonrenal clearance (19%), and volume of distribution at steady-state (16%) was much smaller. These estimates are comparable with the BOV of about 6% for total clearance after intravenous dosing from Grahnen et al. [68] who performed a six period crossover study with four oral and two intravenous doses of furosemide. The low BOV of total clearance and volume of distribution of piperacillin indicated that the variability of these PK parameters between two dosing intervals was small. For patients who do not have typical pharmacokinetics, e.g. with a large clearance or short half-life, target concentration intervention (TCI) [69] may allow one to successfully treat infections by pathogens with 1.5 to 4-fold higher MICs (Table 5) by individualizing dosage regimens. Our study only assessed the BOV in healthy volunteers and significantly more data in various patient groups are required to show that the effectiveness of piperacillin can be improved by the application of TCI without impacting on the safety of piperacillin. Roberts et al. [70] recently proposed therapeutic drug monitoring for piperacillin in critically ill patients with sepsis.
As an alternative option to reduce the daily dose of piperacillin, various dosage regimens (Table 5) were explored via simulation based on our final population PK model. The PTA was compared between those dosage regimens for the PKPD target ft>MIC≥ 30% representing bacteriostasis and ft>MIC≥ 50% representing near-maximal killing of penicillins [23, 24]. Higher PKPD targets may be required to treat successfully infections by slow-growing bacteria at infection sites that require bactericidal activity such as osteomyelitis [26] or infections with a high initial bacterial density [71–73] or with delayed initiation of therapy [74, 75]. Sometimes, higher targets of ft>MIC≥ 70% or ft>MIC= 100% are also discussed [76]. To illustrate the influence of different PKPD targets on the PTAs, we studied a range of targets from ft>MIC≥ 30% to ft>MIC= 100% (Table 5 and Figure 3).
For the near-maximal killing target ft>MIC≥ 50%, 30 min infusion of 4 g every 8 h (daily dose 12 g) achieved a PKPD breakpoint of 4 mg l−1. Administering 30 min infusions of 4 g every 6 h (daily dose 16 g) increased the PKPD breakpoint to 12 mg l−1 and giving 30 min infusions of 3 g every 4 h (daily dose 18 g) improved the PKPD breakpoint to 24 mg l−1. We studied 5 h infusions as an alternative dosage regimen which was specifically optimized for the PKPD target ft>MIC≥ 50% for piperacillin. A 5 h infusion of 3 g every 8 h achieved a PKPD breakpoint of 16 to 24 mg l−1 (PTA = 86% at an MIC of 24 mg l−1). Therefore, 5 h prolonged infusion allows one to reduce the daily dose by a factor of 2 compared with a 30 min infusion of 3 g every 4 h while achieving almost similar PTAs and PKPD breakpoints (Figure 3 and Table 5). High dose 5 h infusion of 6 g every 8 h achieved a PKPD breakpoint of 48 mg l−1. Consequently, 5 h infusion of 6 g every 8 h was predicted to have its greatest benefit compared with a standard 30 min infusion of 4 g every 6 h, if the MIC falls between 12 and 48 mg l−1.
Our PKPD breakpoints were comparable with the breakpoints reported by Lodise et al. [2] and Kim et al. [77]. Lodise et al. predicted PTAs >95% for MICs ≤16 mg l−1 for a 30 min piperacillin infusion of 3 g every 4 h (in presence of tazobactam) for hospitalized patients and PTAs >95% for MICs ≤8 mg l−1 and a PTA of 72% at an MIC of 16 mg l−1 for healthy volunteers. Our PKPD breakpoint of 24 mg l−1 for this regimen in healthy volunteers was higher, because our estimated total body clearance was approximately 16% lower and slightly less variable compared with the healthy volunteer data from Lodise et al. Another possible reason for this difference is that we used a model with saturable clearance whereas Lodise et al. used a model with first-order elimination. However, these differences are small and simulation results for piperacillin from Lodise et al. [2] show that predictions from healthy volunteers are a conservative prediction for hospitalized patients, primarily since their patients were older and had a 38% lower total clearance compared with their healthy volunteers.
In conclusion, this study presents a population PK model with good predictive performance for plasma and urine profiles. We proposed that the high BOVs for the mixed order renal elimination had only a small influence on the BOV for total clearance (determined via non-compartmental analysis) of 8.5%. Future clinical trials are warranted to show if prolonged infusion with TCI is clinically superior to short-term infusion for piperacillin.
Acknowledgments
We thank Drs George Drusano, Cornelia Landersdorfer, and Thomas Lodise for fruitful discussions and excellent comments on this manuscript.
This work has been presented in part at the Interscience Conference on Antimicrobial Agents and Chemotherapy, Washington, DC, USA, in 2005 (poster number: A-30) and in part at the PAGANZ 2005 meeting Population Approach Group in Australia & New Zealand in Brisbane, Australia.
Competing interests
There are no competing interests to declare.
REFERENCES
- 1.Touw DJ. Clinical pharmacokinetics of antimicrobial drugs in cystic fibrosis. Pharm World Sci. 1998;20:149–60. doi: 10.1023/a:1008634911114. [DOI] [PubMed] [Google Scholar]
- 2.Lodise TP, Jr, Lomaestro B, Rodvold KA, Danziger LH, Drusano GL. Pharmacodynamic profiling of piperacillin in the presence of tazobactam in patients through the use of population pharmacokinetic models and Monte Carlo simulation. Antimicrob Agents Chemother. 2004;48:4718–24. doi: 10.1128/AAC.48.12.4718-4724.2004. [DOI] [PMC free article] [PubMed] [Google Scholar]
- 3.Vinks AA, Den Hollander JG, Overbeek SE, Jelliffe RW, Mouton JW. Population pharmacokinetic analysis of nonlinear behavior of piperacillin during intermittent or continuous infusion in patients with cystic fibrosis. Antimicrob Agents Chemother. 2003;47:541–7. doi: 10.1128/AAC.47.2.541-547.2003. [DOI] [PMC free article] [PubMed] [Google Scholar]
- 4.Bergan T. Overview of acylureidopenicillin pharmacokinetics. Scand J Infect Dis Suppl. 1981;29:33–48. [PubMed] [Google Scholar]
- 5.Aronoff GR, Sloan RS, Brier ME, Luft FC. The effect of piperacillin dose on elimination kinetics in renal impairment. Eur J Clin Pharmacol. 1983;24:543–7. doi: 10.1007/BF00609901. [DOI] [PubMed] [Google Scholar]
- 6.Batra VK, Morrison JA, Lasseter KC, Joy VA. Piperacillin kinetics. Clin Pharmacol Ther. 1979;26:41–53. doi: 10.1002/cpt197926141. [DOI] [PubMed] [Google Scholar]
- 7.Bergan T, Williams JD. Dose dependence of piperacillin pharmacokinetics. Chemotherapy. 1982;28:153–9. doi: 10.1159/000238070. [DOI] [PubMed] [Google Scholar]
- 8.Tjandramaga TB, Mullie A, Verbesselt R, De Schepper PJ, Verbist L. Piperacillin: human pharmacokinetics after intravenous and intramuscular administration. Antimicrob Agents Chemother. 1978;14:829–37. doi: 10.1128/aac.14.6.829. [DOI] [PMC free article] [PubMed] [Google Scholar]
- 9.Morrison JA, Batra VK. Pharmacokinetics of piperacillin sodium in man. Drugs Exp Clin Res. 1979;5:105–10. [Google Scholar]
- 10.Evans MAL, Leung T, Wilson P, Williams JD. Pharmacokinetics of intravenously administered antibiotics: a study of piperacillin, a new semi-synthetic penicillin. Drugs Exp Clin Res. 1979;5:111–16. [Google Scholar]
- 11.Evans MA, Wilson P, Leung T, Williams JD. Pharmacokinetics of piperacillin following intravenous administration. J Antimicrob Chemother. 1978;4:255–61. doi: 10.1093/jac/4.3.255. [DOI] [PubMed] [Google Scholar]
- 12.Johnson CA, Halstenson CE, Kelloway JS, Shapiro BE, Zimmerman SW, Tonelli A, Faulkner R, Dutta A, Haynes J, Greene DS, Kuye O. Single-dose pharmacokinetics of piperacillin and tazobactam in patients with renal disease. Clin Pharmacol Ther. 1992;51:32–41. doi: 10.1038/clpt.1992.5. [DOI] [PubMed] [Google Scholar]
- 13.Occhipinti DJ, Pendland SL, Schoonover LL, Rypins EB, Danziger LH, Rodvold KA. Pharmacokinetics and pharmacodynamics of two multiple-dose piperacillin-tazobactam regimens. Antimicrob Agents Chemother. 1997;41:2511–7. doi: 10.1128/aac.41.11.2511. [DOI] [PMC free article] [PubMed] [Google Scholar]
- 14.Reed MD, Goldfarb J, Yamashita TS, Lemon E, Blumer JL. Single-dose pharmacokinetics of piperacillin and tazobactam in infants and children. Antimicrob Agents Chemother. 1994;38:2817–26. doi: 10.1128/aac.38.12.2817. [DOI] [PMC free article] [PubMed] [Google Scholar]
- 15.Sullivan MC, Nightingale CH, Quintiliani R, Sweeney K. Comparison of the pharmacokinetic and pharmacodynamic activity of piperacillin and mezlocillin. Pharmacotherapy. 1993;13:607–12. [PubMed] [Google Scholar]
- 16.Welling PG, Craig WA, Bundtzen RW, Kwok FW, Gerber AU, Madsen PO. Pharmacokinetics of piperacillin in subjects with various degrees of renal function. Antimicrob Agents Chemother. 1983;23:881–7. doi: 10.1128/aac.23.6.881. [DOI] [PMC free article] [PubMed] [Google Scholar]
- 17.Wise R, Logan M, Cooper M, Andrews JM. Pharmacokinetics and tissue penetration of tazobactam administered alone and with piperacillin. Antimicrob Agents Chemother. 1991;35:1081–4. doi: 10.1128/aac.35.6.1081. [DOI] [PMC free article] [PubMed] [Google Scholar]
- 18.Zaghloul I, Kuck N, Yacobi A. The effect of tazobactam on the pharmacokinetics and the antibacterial activity of piperacillin in dogs. Int J Pharm. 1997;153:115–21. [Google Scholar]
- 19.Li C, Kuti JL, Nightingale CH, Mansfield DL, Dana A, Nicolau DP. Population pharmacokinetics and pharmacodynamics of piperacillin/tazobactam in patients with complicated intra-abdominal infection. J Antimicrob Chemother. 2005;56:388–95. doi: 10.1093/jac/dki243. [DOI] [PubMed] [Google Scholar]
- 20.Sorgel F, Kinzig M. The chemistry, pharmacokinetics and tissue distribution of piperacillin/tazobactam. J Antimicrob Chemother. 1993;31(Suppl A):39–60. doi: 10.1093/jac/31.suppl_a.39. [DOI] [PubMed] [Google Scholar]
- 21.Anonymous. Piperacillin sodium and tazobactam sodium (Zosyn) product information. Lederle Laboratories, Pearl River, N.Y. Revised 5 April 1999.
- 22.Eagle H, Fleischman R, Musselman AD. The effective concentrations of penicillin in vitro and in vivo for streptococci, pneumococci, and Treponema pallidum. J Bacteriol. 1950;59:625–43. doi: 10.1128/jb.59.5.625-643.1950. [DOI] [PMC free article] [PubMed] [Google Scholar]
- 23.Craig WA, Ebert SC. Continuous infusion of beta-lactam antibiotics. Antimicrob Agents Chemother. 1992;36:2577–83. doi: 10.1128/aac.36.12.2577. [DOI] [PMC free article] [PubMed] [Google Scholar]
- 24.Kirby WM. Bacteriostatic and lytic actions of penicillin on sensitive and resistant staphylococci. J Clin Invest. 1945;24:165–69. doi: 10.1172/JCI101593. [DOI] [PMC free article] [PubMed] [Google Scholar]
- 25.Ambrose PG, Bhavnani SM, Rubino CM, Louie A, Gumbo T, Forrest A, Drusano GL. Pharmacokinetics-pharmacodynamics of antimicrobial therapy: it's not just for mice anymore. Clin Infect Dis. 2007;44:79–86. doi: 10.1086/510079. [DOI] [PubMed] [Google Scholar]
- 26.Craig WA. Pharmacokinetic/pharmacodynamic parameters: rationale for antibacterial dosing of mice and men. Clin Infect Dis. 1998;26:1–12. doi: 10.1086/516284. [DOI] [PubMed] [Google Scholar]
- 27.Craig WA. Interrelationship between pharmacokinetics and pharmacodynamics in determining dosage regimens for broad-spectrum cephalosporins. Diagn Microbiol Infect Dis. 1995;22:89–96. doi: 10.1016/0732-8893(95)00053-d. [DOI] [PubMed] [Google Scholar]
- 28.Craig WA, Andes D. Pharmacokinetics and pharmacodynamics of antibiotics in otitis media. Pediatr Infect Dis J. 1996;15:255–9. doi: 10.1097/00006454-199603000-00015. [DOI] [PubMed] [Google Scholar]
- 29.Leggett JE, Ebert S, Fantin B, Craig WA. Comparative dose-effect relations at several dosing intervals for beta-lactam, aminoglycoside and quinolone antibiotics against gram-negative bacilli in murine thigh-infection and pneumonitis models. Scand J Infect Dis Suppl. 1990;74:179–84. [PubMed] [Google Scholar]
- 30.Leggett JE, Fantin B, Ebert S, Totsuka K, Vogelman B, Calame W, Mattie H, Craig WA. Comparative antibiotic dose-effect relations at several dosing intervals in murine pneumonitis and thigh-infection models. J Infect Dis. 1989;159:281–92. doi: 10.1093/infdis/159.2.281. [DOI] [PubMed] [Google Scholar]
- 31.MacGowan AP, Bowker KE. Continuous infusion of beta-lactam antibiotics. Clin Pharmacokinet. 1998;35:391–402. doi: 10.2165/00003088-199835050-00004. [DOI] [PubMed] [Google Scholar]
- 32.Mouton JW, Vinks AA. Is continuous infusion of beta-lactam antibiotics worthwhile? – efficacy and pharmacokinetic considerations. J Antimicrob Chemother. 1996;38:5–15. doi: 10.1093/jac/38.1.5. [DOI] [PubMed] [Google Scholar]
- 33.Drusano GL. Prevention of resistance: a goal for dose selection for antimicrobial agents. Clin Infect Dis. 2003;36:S42–50. doi: 10.1086/344653. [DOI] [PubMed] [Google Scholar]
- 34.Jaruratanasirikul S, Sriwiriyajan S. Comparison of the pharmacodynamics of meropenem in healthy volunteers following administration by intermittent infusion or bolus injection. J Antimicrob Chemother. 2003;52:518–21. doi: 10.1093/jac/dkg378. [DOI] [PubMed] [Google Scholar]
- 35.Kuti JL, Dandekar PK, Nightingale CH, Nicolau DP. Use of Monte Carlo simulation to design an optimized pharmacodynamic dosing strategy for meropenem. J Clin Pharmacol. 2003;43:1116–23. doi: 10.1177/0091270003257225. [DOI] [PubMed] [Google Scholar]
- 36.Kuti JL, Nightingale CH, Knauft RF, Nicolau DP. Pharmacokinetic properties and stability of continuous-infusion meropenem in adults with cystic fibrosis. Clin Ther. 2004;26:493–501. doi: 10.1016/s0149-2918(04)90051-3. [DOI] [PubMed] [Google Scholar]
- 37.Mouton JW, Michel MF. Pharmacokinetics of meropenem in serum and suction blister fluid during continuous and intermittent infusion. J Antimicrob Chemother. 1991;28:911–8. doi: 10.1093/jac/28.6.911. [DOI] [PubMed] [Google Scholar]
- 38.Thalhammer F, Traunmuller F, El Menyawi I, Frass M, Hollenstein UM, Locker GJ, Stoiser B, Staudinger T, Thalhammer-Scherrer R, Burgmann H. Continuous infusion versus intermittent administration of meropenem in critically ill patients. J Antimicrob Chemother. 1999;43:523–7. doi: 10.1093/jac/43.4.523. [DOI] [PubMed] [Google Scholar]
- 39.Lipman J, Gomersall CD, Gin T, Joynt GM, Young RJ. Continuous infusion ceftazidime in intensive care: a randomized controlled trial. J Antimicrob Chemother. 1999;43:309–11. doi: 10.1093/jac/43.2.309. [DOI] [PubMed] [Google Scholar]
- 40.Lemmen SW, Engels I, Daschner FD. Serum bactericidal activity of ceftazidime administered as continuous infusion of 3 g over 24 h versus intermittent bolus infusion of 2 g against Pseudomonas aeruginosa in healthy volunteers. J Antimicrob Chemother. 1997;39:841–2. doi: 10.1093/jac/39.6.841b. [DOI] [PubMed] [Google Scholar]
- 41.Mouton JW, Horrevorts AM, Mulder PG, Prens EP, Michel MF. Pharmacokinetics of ceftazidime in serum and suction blister fluid during continuous and intermittent infusions in healthy volunteers. Antimicrob Agents Chemother. 1990;34:2307–11. doi: 10.1128/aac.34.12.2307. [DOI] [PMC free article] [PubMed] [Google Scholar]
- 42.Nicolau DP, Nightingale CH, Banevicius MA, Fu Q, Quintiliani R. Serum bactericidal activity of ceftazidime: continuous infusion versus intermittent injections. Antimicrob Agents Chemother. 1996;40:61–4. doi: 10.1128/aac.40.1.61. [DOI] [PMC free article] [PubMed] [Google Scholar]
- 43.Daenen S, Erjavec Z, Uges DR, De Vries-Hospers HG, De Jonge P, Halie MR. Continuous infusion of ceftazidime in febrile neutropenic patients with acute myeloid leukemia. Eur J Clin Microbiol Infect Dis. 1995;14:188–92. doi: 10.1007/BF02310354. [DOI] [PubMed] [Google Scholar]
- 44.Benko AS, Cappelletty DM, Kruse JA, Rybak MJ. Continuous infusion versus intermittent administration of ceftazidime in critically ill patients with suspected gram-negative infections. Antimicrob Agents Chemother. 1996;40:691–5. doi: 10.1128/aac.40.3.691. [DOI] [PMC free article] [PubMed] [Google Scholar]
- 45.Richerson MA, Ambrose PG, Bui KQ, Grant E, Nicolau DP, Nightingale CH, Quintiliani R. Pharmacokinetic and economic evaluation of piperacillin/tazobactam administered either as continuous or intermittent infusion with once-daily gentamicin. Infect Dis Clin Pract. 1999;8:195–200. [Google Scholar]
- 46.Grant EM, Kuti JL, Nicolau DP, Nightingale C, Quintiliani R. Clinical efficacy and pharmacoeconomics of a continuous-infusion piperacillin-tazobactam program in a large community teaching hospital. Pharmacotherapy. 2002;22:471–83. doi: 10.1592/phco.22.7.471.33665. [DOI] [PubMed] [Google Scholar]
- 47.Lodise TP, Jr, Lomaestro B, Drusano GL. Piperacillin-tazobactam for Pseudomonas aeruginosa infection: clinical implications of an extended-infusion dosing strategy. Clin Infect Dis. 2007;44:357–63. doi: 10.1086/510590. [DOI] [PubMed] [Google Scholar]
- 48.Mouton JW, Vinks AA. Continuous infusion of beta-lactams. Curr Opin Crit Care. 2007;13:598–606. doi: 10.1097/MCC.0b013e3282e2a98f. [DOI] [PubMed] [Google Scholar]
- 49.Roberts JA, Lipman J, Blot S, Rello J. Better outcomes through continuous infusion of time-dependent antibiotics to critically ill patients? Curr Opin Crit Care. 2008;14:390–6. doi: 10.1097/MCC.0b013e3283021b3a. [DOI] [PubMed] [Google Scholar]
- 50.West GB, Brown JH, Enquist BJ. A general model for the origin of allometric scaling laws in biology. Science. 1997;276:122–6. doi: 10.1126/science.276.5309.122. [DOI] [PubMed] [Google Scholar]
- 51.West GB, Brown JH, Enquist BJ. The fourth dimension of life: fractal geometry and allometric scaling of organisms. Science. 1999;284:1677–9. doi: 10.1126/science.284.5420.1677. [DOI] [PubMed] [Google Scholar]
- 52.Holford NH. A size standard for pharmacokinetics. Clin Pharmacokinet. 1996;30:329–32. doi: 10.2165/00003088-199630050-00001. [DOI] [PubMed] [Google Scholar]
- 53.Anderson BJ, Holford NH. Mechanism-based concepts of size and maturity in pharmacokinetics. Annu Rev Pharmacol Toxicol. 2008;48:303–32. doi: 10.1146/annurev.pharmtox.48.113006.094708. [DOI] [PubMed] [Google Scholar]
- 54.Bulitta JB, Duffull SB, Kinzig-Schippers M, Holzgrabe U, Stephan U, Drusano GL, Sorgel F. Systematic comparison of the population pharmacokinetics and pharmacodynamics of piperacillin in cystic fibrosis patients and healthy volunteers. Antimicrob Agents Chemother. 2007;51:2497–507. doi: 10.1128/AAC.01477-06. [DOI] [PMC free article] [PubMed] [Google Scholar]
- 55.Brendel K, Comets E, Laffont C, Laveille C, Mentre F. Metrics for external model evaluation with an application to the population pharmacokinetics of gliclazide. Pharm Res. 2006;23:2036–49. doi: 10.1007/s11095-006-9067-5. [DOI] [PMC free article] [PubMed] [Google Scholar]
- 56.Comets E, Brendel K, Mentre F. Computing normalised prediction distribution errors to evaluate nonlinear mixed-effect models: the NPDE add-on package for R. Comput Methods Programs Biomed. 2008;90:154–66. doi: 10.1016/j.cmpb.2007.12.002. [DOI] [PubMed] [Google Scholar]
- 57.Beal SL. Ways to fit a PK model with some data below the quantification limit. J Pharmacokinet Pharmacodyn. 2001;28:481–504. doi: 10.1023/a:1012299115260. [DOI] [PubMed] [Google Scholar]
- 58.Beal SL, Boeckmann AJ, Sheiner LB, NONMEM Project Group . NONMEM Users Guides. San Francisco, CA: University of California at San Francisco; 1999. Version 5 edition. [Google Scholar]
- 59.Bauer RJ. S-ADAPT/MCPEM User's Guide (Version 1.55) Software for Pharmacokinetic, Pharmacodynamic and Population Data Analysis. Berkeley, CA, 2007.
- 60.Bauer RJ, Guzy S, Ng C. A survey of population analysis methods and software for complex pharmacokinetic and pharmacodynamic models with examples. AAPS J. 2007;9:E60–83. doi: 10.1208/aapsj0901007. [DOI] [PMC free article] [PubMed] [Google Scholar]
- 61.Beal SL, Sheiner LB, Boeckmann AJ. NONMEM Users Guides. 1989. –2006. Ellicott City, Maryland, USA: Icon Development Solutions, 2006.
- 62.Bulitta JB, Landersdorfer CB, Kinzig M, Holzgrabe U, Sorgel F. New semiphysiological absorption model to assess the pharmacodynamic profile of cefuroxime axetil using nonparametric and parametric population pharmacokinetics. Antimicrob Agents Chemother. 2009;53:3462–71. doi: 10.1128/AAC.00054-09. [DOI] [PMC free article] [PubMed] [Google Scholar]
- 63.Drusano GL. Antimicrobial pharmacodynamics: critical interactions of ‘bug and drug’. Nat Rev Microbiol. 2004;2:289–300. doi: 10.1038/nrmicro862. [DOI] [PubMed] [Google Scholar]
- 64.Mouton JW, Dudley MN, Cars O, Derendorf H, Drusano GL. Standardization of pharmacokinetic/pharmacodynamic (PK/PD) terminology for anti-infective drugs: an update. J Antimicrob Chemother. 2005;55:601–7. doi: 10.1093/jac/dki079. [DOI] [PubMed] [Google Scholar]
- 65.Bulitta JB, Holford NHG. Assessment of Predictive Performance of Pharmacokinetic Models Based on Plasma and Urine Data. Brisbane, Qld: PAGANZ – Population Approach Group in Australia & New Zealand; 2005. [Google Scholar]
- 66.Drusano GL, Preston SL, Hardalo C, Hare R, Banfield C, Andes D, Vesga O, Craig WA. Use of preclinical data for selection of a phase II/III dose for evernimicin and identification of a preclinical MIC breakpoint. Antimicrob Agents Chemother. 2001;45:13–22. doi: 10.1128/AAC.45.1.13-22.2001. [DOI] [PMC free article] [PubMed] [Google Scholar]
- 67.Sorgel F, Kinzig M. Pharmacokinetic characteristics of piperacillin/tazobactam. Intensive Care Med. 1994;20(Suppl 3):S14–20. doi: 10.1007/BF01745246. [DOI] [PubMed] [Google Scholar]
- 68.Grahnen A, Hammarlund M, Lundqvist T. Implications of intraindividual variability in bioavailability studies of furosemide. Eur J Clin Pharmacol. 1984;27:595–602. doi: 10.1007/BF00556898. [DOI] [PubMed] [Google Scholar]
- 69.Holford NH. Target concentration intervention: beyond Y2K. Br J Clin Pharmacol. 1999;48:9–13. doi: 10.1046/j.1365-2125.1999.00971.x. [DOI] [PMC free article] [PubMed] [Google Scholar]
- 70.Roberts JA, Roberts MS, Robertson TA, Dalley AJ, Lipman J. Piperacillin penetration into tissue of critically ill patients with sepsis – bolus versus continuous administration? Crit Care Med. 2009;37:926–33. doi: 10.1097/CCM.0b013e3181968e44. [DOI] [PubMed] [Google Scholar]
- 71.Eagle H. The effect of the size of the inoculum and the age of the infection on the curative dose of penicillin in experimental infections with streptococci, pneumococci, and Treponema pallidum. J Exp Med. 1949;90:595–607. doi: 10.1084/jem.90.6.595. [DOI] [PMC free article] [PubMed] [Google Scholar]
- 72.Lee D, Murakami Y, Stamstad T, Marchillo K, Ashbeck J, Andes DR, Craig WA. Inoculum Effect of Daptomycin (D), Linezolid (L), Vancomycin (V), and Ceftobiprole (C) with Staphylococcus aureus (SA) and Streptococcus pneumoniae (SP) in Neutropenic Mice at 105 and 107 CFU in Opposite Thighs. In: 47th Annual Interscience Conference on Antimicrobial Agents and Chemotherapy (ICAAC) Abst A-37, Chicago, IL, 2007.
- 73.Stevens DL, Yan S, Bryant AE. Penicillin-binding protein expression at different growth stages determines penicillin efficacy in vitro and in vivo: an explanation for the inoculum effect. J Infect Dis. 1993;167:1401–5. doi: 10.1093/infdis/167.6.1401. [DOI] [PubMed] [Google Scholar]
- 74.Hope WW, Drusano GL, Moore CB, Sharp A, Louie A, Walsh TJ, Denning DW, Warn PA. Effect of neutropenia and treatment delay on the response to antifungal agents in experimental disseminated candidiasis. Antimicrob Agents Chemother. 2007;51:285–95. doi: 10.1128/AAC.00601-06. [DOI] [PMC free article] [PubMed] [Google Scholar]
- 75.Lodise TP, Jr, Patel N, Kwa A, Graves J, Furuno JP, Graffunder E, Lomaestro B, McGregor JC. Predictors of 30-day mortality among patients with Pseudomonas aeruginosa bloodstream infections: impact of delayed appropriate antibiotic selection. Antimicrob Agents Chemother. 2007;51:3510–5. doi: 10.1128/AAC.00338-07. [DOI] [PMC free article] [PubMed] [Google Scholar]
- 76.Mouton JW, Punt N. Use of the t >MIC to choose between different dosing regimens of beta-lactam antibiotics. J Antimicrob Chemother. 2001;47:500–1. doi: 10.1093/jac/47.4.500. [DOI] [PubMed] [Google Scholar]
- 77.Kim A, Sutherland CA, Kuti JL, Nicolau DP. Optimal dosing of piperacillin-tazobactam for the treatment of Pseudomonas aeruginosa infections: prolonged or continuous infusion? Pharmacotherapy. 2007;27:1490–7. doi: 10.1592/phco.27.11.1490. [DOI] [PubMed] [Google Scholar]