

Abstract
AIM
To determine the population pharmacokinetic parameters of vancomycin in neonatal patients with a wide range of gestational age and birth weight, and subsequently to design an initial dosing schedule for vancomycin in neonates.
METHODS
Using nonlinear mixed-effects modelling (NONMEM VI), the pharmacokinetics of vancomycin were investigated in 70 neonates with postmenstrual age and body weight ranging 25.1–48.1 weeks and 0.7–3.7 kg, respectively. A one-compartment linear disposition model with zero order input and first-order elimination was used to describe the data. Nine demographic characteristics and 21 co-administered drugs were evaluated as covariates of clearance (CL) and distribution volume (Vd) of vancomycin.
RESULTS
Weight-normalized clearance of vancomycin was influenced by postmenstrual age (PMA) and co-administration of amoxicillin-clavulanic acid. Weight-normalized volume of distribution was influenced by co-administration of spironolactone. CL and Vd of the typical individual in this study population (PMA = 34.6 weeks, weight = 1.7 kg) were estimated to be 0.066 l h−1 kg−1 (95% CI 0.059, 0.073 l h−1 kg−1) and 0.572 l kg−1 (95% CI 0.505, 0.639 l kg−1), respectively. This model was used to predict a priori serum vancomycin concentrations in a validation group (n= 41), which were compared with observed concentrations to determine the predictive performance of the model. The 95% confidence interval of mean prediction error included zero for both peak and trough vancomycin concentrations.
CONCLUSIONS
Postmenstrual age, co-administration of amoxicillin-clavulanic acid and spironolactone have a significant effect on the weight-normalized CL and Vd. An initial dosage guideline for vancomycin is proposed for preterm and full-term neonates, whereas the population pharmacokinetic model can be used for dosage individualization of vancomycin.
Keywords: amoxicillin-clavulanic acid, neonates, NONMEM, postmenstrual age, spironolactone, vancomycin
WHAT IS ALREADY KNOWN ABOUT THIS SUBJECT
Vancomycin is a glycopeptide antibiotic commonly used to treat resistant gram-positive infections in neonates. While adult dosing guidelines are generally well established, a lack of consensus for optimal dosing regimens in neonates remains.
The large variance in pharmacokinetic values in premature neonates compared with full-term infants is a major barrier to the development of optimal dosing regimens. Pharmacokinetic values have been reported for vancomycin in neonates. However, the studies have included small groups with differing, clinical conditions, serum sampling times and pharmacokinetic models. There are many proposed neonatal dosing guidelines for vancomycin, but few, if any, have been prospectively evaluated. In addition, the complexity of the dose and interval selection has led to errors in use.
WHAT THIS STUDY ADDS
The purpose of this investigation was to determine population pharmacokinetic parameters of vancomycin in neonatal patients with a wide range of gestational age and birth weight and to study the effect of the co-administration of amoxicillin-clavulanic acid and spironolactone on the pharmacokinetics of vancomycin in this cohort of patients. The aim was to find covariates with a relevant influence on the pharmacokinetic parameters of this drug, and to use this information for the design of an initial dosing schedule of vancomycin in neonates. Additionally, the obtained population pharmacokinetic parameters can be used to perform modifications of the initial dosing schedule in neonates with serum concentrations outside of the therapeutic range, by means of a Bayesian approach.
Introduction
Vancomycin is a glycopeptide antibiotic used in the treatment of relatively resistant gram positive infections, specifically infections resulting from coagulase-negative staphylococci, most of which are methicillin resistant [1, 2].
Pharmacokinetic parameters of vancomycin in neonates are different from those in adults. These differences are largely determined by the change in the amount of body water and maturation of renal function in the first weeks of life, both in full-term and preterm newborn infants. This means that neonates have a larger Vd and decreased total clearance when compared with infants and adults. These changes also result in higher interindividual differences in neonates than in adults [3, 4].
Frequently, the available information for neonates is the result of studies carried out with few patients, which define relatively homogenous subpopulations. In order to establish relationships between demographic factors and pharmacokinetic parameters it is convenient to use heterogeneous groups of patients. These relationships can be subsequently used to design dosing regimens that minimize the toxicity risk without decreasing the efficacy of therapy [5, 6].
The purpose of this investigation was to determine population pharmacokinetic parameters of vancomycin in neonatal patients with a wide range of gestational age and birth weight and to study the effect of the co-administration of amoxicillin-clavulanic acid and spironolactone on the pharmacokinetics of vancomycin in this cohort of patients. The aim was to find covariates with a relevant influence on the pharmacokinetic parameters of this drug, and to use this information for the design of an initial dosing schedule of vancomycin in neonates. Additionally, the obtained population pharmacokinetic parameters can be used to perform modifications of the initial dosing schedule in neonates with serum concentrations outside of the therapeutic range, by means of a Bayesian approach.
Methods
Patients and data collection
Data were collected from 70 newborn infants (original group) in the neonatal intensive care unit at the ‘Hospital La Fe’, Valencia, Spain, according to the rules of our hospital ethics committee. All patients received intravenous vancomycin for proven or suspected gram-positive infections. The initial dose of vancomycin is shown in Table 1[7]. The dose was administered by means of a syringe pump, which was set to deliver the dose at a constant rate over 60 min.
Table 1.
Dosage guidelines for vancomycin in neonates
| Weight (kg) | Postnatal age (days) | Dose* (mg kg−1) | Dosing interval (h) |
|---|---|---|---|
| <0.8 | <7 | 15 | 24 |
| <1.2 | <7 | 15 | 18 |
| <1.2 | >7 | 15 | 12 |
| <2.0 | <7 | 15 | 12 |
| <2.0 | >7 | 15 | 12 |
| >2.0 | <7 | 15 | 12 |
| >2.0 | >7 | 15 | 8 |
Administered as a constant-rate infusion over 60 min.
The following clinical attributes were collected on all neonates on enrolment: gestational age, postnatal age, postmenstrual age (PMA), birth weight, weight, height, gender, body surface area, urine output and current medications (co-administered drugs).
Blood samples (0.2–0.5 ml) were collected 3 h after completion of drug infusion (peak vancomycin concentration, Cmax) or immediately before the start of vancomycin administration (trough vancomycin concentration, Cmin) for each patient. Trough and peak vancomycin concentrations were obtained before and after the third dose administration, respectively. The serum vancomycin concentrations of this set of samples were used to develop the pharmacostatistical model [1, 8, 9].
A second set of trough and peak serum vancomycin concentrations, obtained in 41 patients (validation group), was used for the evaluation of the pharmacostatistical model.
Drug analysis
Vancomycin serum concentrations were measured at the Clinical Pharmacokinetic Unit of the Pharmacy Service using a fluorescence polarization immunoassay (FPIA) method with a TDxFLx assay system (Abbott Laboratories, Chicago, IL). The coefficient of variation of this assay was less than 6%.
Pharmacokinetic analysis
The nonlinear mixed-effects model population pharmacokinetic program (NONMEM, version VI) [10] was used to assess the information regarding the pharmacokinetic profile of vancomycin in the neonate population (original group), according to the following steps:
Step 1
The computer program NONMEM was used to estimate the average pharmacokinetic parameters in the original group of patients (basic model). A one-compartment model with constant rate infusion during 1 h was used (subroutines ADVAN1 and TRANS2 in the NONMEM-PREDPP package). The average pharmacokinetic parameters estimated by the program were serum clearance (CL) and volume of distribution (Vd). Interpatient and intrapatient variabilities were assessed initially for each pharmacokinetic parameter according to a proportional error model. Individual estimates of vancomycin pharmacokinetic parameters were then obtained for each patient using the final population model and the POSTHOC option in NONMEM.
Step 2
The individual values obtained for pharmacokinetic parameters were used to perform an initial selection of covariates. This selection was carried out by plotting the individual parameter estimates against demographic factors, and retaining those with statistical significance (P < 0.05) as initial covariates. In the case of continuous covariates (weight, birth weight, gestational age, postnatal age, postmenstrual age, height, urine output, body surface area) the statistical significance over the pharmacokinetic parameters (CL or Vd) was evaluated by means of the correlation coefficient, whereas in the case of categorical covariates (gender, concomitant drug therapy) Student's t-test was applied.
Step 3
Statistically significant covariates were sequentially included in the initial pharmacostatistical model, starting with the covariate with greatest statistical significance (lower P value). During incorporation of covariates in the model (one by one), a decrease in the objective function greater than 3.84 (P < 0.05, 1 degree of freedom) was the first criterion followed to retain a covariate in the model; the second criterion was that the 95% confidence interval of estimated parameters did not include the parameter's zero value. The incorporation of continuous covariates was assessed in both a linear and a non-linear way. Categorical covariates were included in the model in a multiplicative way.
Step 4
After finishing the incorporation of statistically significant covariates, the interpatient and intrapatient variabilities (interindividual and intraindividual error models) were evaluated with the additive, proportional and exponential models.
Step 5
The full pharmacostatistical model was subjected to stepwise backward elimination of covariates to obtain the final pharmacostatistical model.
Model evaluation
The bootstrap and visual predictive check were used as internal methods of model evaluation. The bootstrap approach was applied to assess the reliability of the final parameter estimates and their 95% confidence interval. One thousand bootstrap data sets were generated by repeated sampling with replacement from the original data set using the bootstrap option in Wings for NONMEM (Version 616, http://wfn.sourceforge.net), and the final pharmacostatistical model was fitted to each bootstrap data set. A visual predictive check (VPC) was performed to evaluate the predictive properties of the model. One thousand data sets were simulated based on the final model. The median, 50% and 90% prediction intervals for vancomycin concentrations were calculated and superimposed on the observed data.
An external evaluation of the final model was performed with the validation group. The basic and final population models were used to predict serum vancomycin concentrations a priori in the validation group (n= 41). The a priori predictions of vancomycin serum concentrations were obtained by incorporating the population models into the Abbott pharmacokinetic program (ABBOTT; Pharmacokinetic Systems, IL, USA). Predicted serum concentrations (Cpred) were compared with observed (Cobs) concentrations to determine the predictive performance of the models by means of bias and precision. The mean prediction error (me) and the root mean squared prediction error (rmse) were used as measures of bias and precision, respectively [11]:
 |
 |
Results
The demographic features of all patients (original and validation groups) are shown in Table 2. In the original group, 33 neonates (47%) were male and 37 (53%) female. In the validation group, 20 neonates (49%) were male and 21 (51%) female.
Table 2.
Demographic data of original and validation groups
| Group | Gestational age (weeks) | Postnatal age (days) | Postmenstrual age (weeks) | Weight (kg) | Height (cm) | Body surface area (m2) |
|---|---|---|---|---|---|---|
| Original (n= 70) | ||||||
| Mean | 32.2 | 16.9 | 34.6 | 1.7 | 40.9 | 0.15 |
| Range | 24.0–42.0 | 4.0–63.0 | 25.1–48.1 | 0.7–3.7 | 29.0–52.0 | 0.1–0.3 |
| SD | 5.0 | 10.9 | 5.3 | 0.8 | 5.6 | 0.04 |
| CV% | 15.4 | 64.6 | 15.1 | 47.7 | 13.6 | 27.7 |
| Validation (n= 41) | ||||||
| Mean | 23.0 | 15.1 | 34.2 | 1.7 | 41.1 | 0.15 |
| Range | 25.0–42.0 | 3.0–36.0 | 26.0–44.2 | 0.8–3.8 | 33.0–52.0 | 0.1–0.2 |
| SD | 4.7 | 6.8 | 4.7 | 0.8 | 5.2 | 0.04 |
| CV% | 14.7 | 45.2 | 13.9 | 48.5 | 12.6 | 26.1 |
SD, standard deviation; CV%, coefficient of variation.
Empirical Bayes estimates of pharmacokinetic parameters obtained with the basic model in step 1 were used to detect statistically significant covariates in step 2. Eventually, after the incorporation of covariates in the basic model (step 3), an intermediate model was obtained that included the postmenstrual age and the administration of amoxicillin-clavulanic acid as covariates of clearance, and the administration of spironolactone as covariate of volume of distribution. During step 4 an additive interindividual error model was selected, and this model was also the full final model, since any covariate was eliminated during the stepwise backward elimination process (step 5). The population parameters estimates corresponding to the final full model are given in Table 3, and the population and individual predicted concentrations of vancomycin are shown in Figure 1vs. the observed concentrations.
Table 3.
Parameter estimates for the final model
| NONMEM | Bootstrap analysis | |||
|---|---|---|---|---|
| Parameter | Estimate | 95% CI | Estimate | 95% CI |
| θ1 | 1.92 × 10⁻³ | 1.72 × 10⁻³; 2.12 × 10⁻³ | 1.93 × 10⁻³ | 1.72 × 10⁻³; 2.14 × 10⁻³ |
| θ2 | 0.650 | 0.391; 0.909 | 0.665 | 0.392; 0.939 |
| θ3 | 0.572 | 0.505; 0.639 | 0.572 | 0.490; 0.654 |
| θ4 | 0.344 | 0.242; 0.446 | 0.340 | 0.200; 0.480 |
| ωCL (CV%) | 35.6 | 28.8; 41.3 | 35.7 | 29.4; 42.0 |
| ωVd (CV%) | 19.3 | 0.8; 27.3 | 20.0 | 0.5; 39.7 |
| σ (µg ml−1) | 2.69 | 0.73; 3.73 | 2.45 | 1.32; 3.58 |
95% CI 95% confidence interval; wt weight (kg); PMA postmenstrual age (weeks); AMX amoxicillin-clavulanic acid; SPI spironolactone; ωCL interindividual variability in CL; ωVd interindividual variability in Vd; σ residual variability. TVCL = (θ1× PMA × (1 +θ2× AMX)) × wt: typical population value for clearance (l h−1); TVV = (θ3× (1 −θ4× SPI)) × wt: typical population value for volume of distribution (l).
Figure 1.
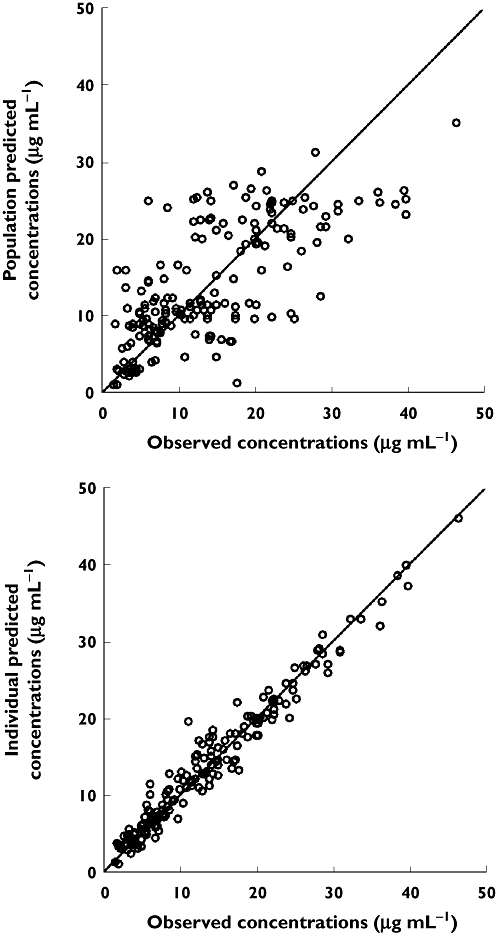
Population predicted and individual predicted concentrations of vancomycin vs. observed concentrations corresponding to the final model. Solid line is the line of identity
The reliability of the final model was confirmed by re-estimating the model parameter estimates and their 95% confidence interval using bootstrap resampling (successful runs 92%). The results of the bootstrap analysis (Table 3) were in good agreement with the NONMEM results. On the other hand, model qualification using a visual predictive check (VPC) confirmed acceptable agreement between the observed and model predicted data, with most of the observed values within the 90% prediction interval (Figure 2).
Figure 2.
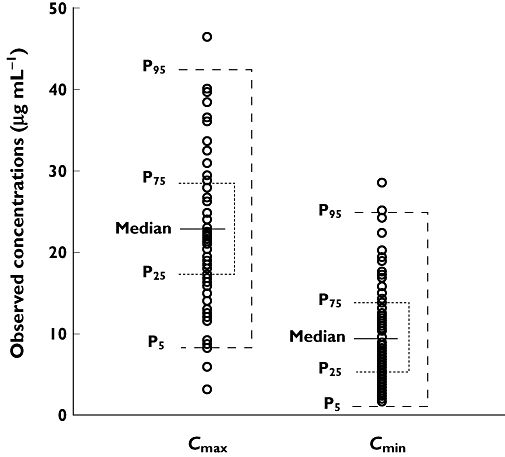
Visual predictive check of the final model for vancomycin. Symbols are the observed concentrations and the horizontal lines indicate the median and percentiles (5th, 25th, 75th and 95th) of vancomycin concentrations simulated with the final model. The intervals P5-P95 and P25-P75 cover the 90% and 50% predicted concentrations, respectively
The results corresponding to the validation of the final model are given in Table 4. In Table 4, me and rmse values corresponding to the basic model are also included in order to compare the performance of both models. As can be seen, the mean prediction error obtained with the final model was lower than that obtained with the basic model for both Cmin and Cmax values of vancomycin, indicating that the final model gave rise to less biased predictions than the basic model. Furthermore, the 95% confidence interval of me values obtained with the final model contained the zero value, which indicated that these mean prediction errors were not significantly different from zero. The final model also provided more precise predictions of Cmin and Cmax values of vancomycin (lower rmse values) than the basic model.
Table 4.
Validation analysis of the full final model vs. the basic model
| Predictor | ||||
|---|---|---|---|---|
| Cmin | Cmax | |||
| Final | Basic | Final | Basic | |
| Bias | ||||
| Mean prediction error (me) | 1.03 (−0.18, 2.25)* | 3.85 (2.15, 5.54) | 1.54 (−0.37, 3.46) | 1.83 (−0.30, −3.98) |
| Precision | ||||
| Root mean squared prediction error (rmse) | 4.06 (3.17, 4.79) | 6.68 (4.52, 8.55) | 6.37 (4.80, 7.63) | 7.17 (5.17, 8.72) |
Values given are point estimate and 95% confidence interval (parentheses).
The full final population model was used to obtain an initial dosing schedule of vancomycin with the objective of reaching a trough vancomycin serum concentration close to 7.5 µg ml−1, and a peak concentration not higher than 20 µg ml−1 (Table 5). Figure 3 shows the simulated (n= 200) vancomycin serum concentrations with the full final population model for a typical individual in this study (PMA = 34.6 weeks, weight = 1.7 kg) dosed according to Table 5. As can be seen, predicted trough concentrations (Cmin) were near 7.5 µg ml−1, whereas peak predicted concentrations (Cmax) did not exceed 20.5 µg ml−1.
Table 5.
Proposed vancomycin dose regimen in typical neonates designed to achieve a peak concentration not exceeding 20 µg ml-1 and a trough concentration of 7.5 µg ml-1
| Concomitant therapy | |||
|---|---|---|---|
| PMA (weeks) | Dose/dosing interval ((mg kg−1)/h) | Amoxicillin-clavulanic acid dose/dosing interval ((mg kg−1)/h) | Spironolactone dose/dosing interval ((mg kg−1)/h) |
| 25 | 8.5/12 | 10.0/8 | 6.5/8 |
| 26 | 8.5/12 | 10.0/8 | 6.5/8 |
| 27 | 9.0/12 | 10.5/8 | 7.0/8 |
| 28 | 9.5/12 | 11.0/8 | 7.0/8 |
| 29 | 9.5/12 | 11.5/8 | 7.5/8 |
| 30 | 10.0/12 | 11.5/8 | 7.5/8 |
| 31 | 10.5/12 | 12.0/8 | 8.0/8 |
| 32 | 11.0/12 | 13.0/8 | 8.0/8 |
| 33 | 11.5/12 | 13.0/8 | 8.0/8 |
| 34 | 12.5/12 | 13.0/8 | 8.0/8 |
| 35 | 13.0/12 | 13.5/8 | 8.5/8 |
| 36 | 13.5/12 | 14.0/8 | 9.0/8 |
| 37 | 14.0/12 | 14.5/8 | 9.5/8 |
| 38 | 9.5/8 | 15.5/8 | 9.5/8 |
| 39 | 9.5/8 | 16.0/8 | 10.0/8 |
| 40 | 10.0/8 | 16.5/8 | 10.5/8 |
| 41 | 10.5/8 | 17.5/8 | 11.0/8 |
| ≥42 | 11.0/8 | 18.5/8 | 11.5/8 |
PMA postmenstrual age (weeks).
Figure 3.
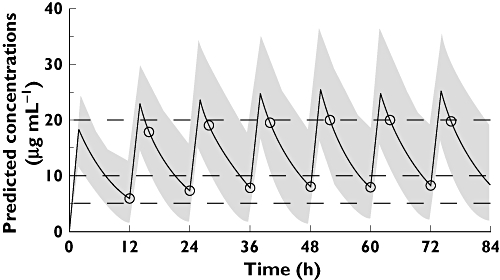
Model-predicted concentrations of vancomycin (solid line) for a typical individual in this study (PMA = 34.6 weeks, weight = 1.7 kg) dosed according to Table 5 (12.5 mg kg−1 every 12 h by means of a constant-rate infusion over 1 h). Symbols indicate predicted concentrations at sampling times used for determining Cmin values (immediately before the start of a vancomycin administration) or Cmax values (3 h after completion of drug infusion). The envelop represents the 90% prediction interval
Discussion
Vancomycin is a potentially toxic drug, with similar adverse effects in adult, paediatric and neonatal populations. Concentration monitoring is currently being performed to avoid toxicity complications, and also to avoid excessively low concentrations that could reduce the effectiveness of the therapy and increase the propensity to bacterial resistance [12, 13].
The multicompartimental kinetics and the long distribution phase of vancomycin add complexity to the serum concentration monitoring of this drug. However, previous studies have shown that a one-compartment model can be used to estimate pharmacokinetic parameters useful for individualizing vancomycin dosage regimens [1–3, 14]. Although a one-compartment model underestimates the value of the peak concentration, its use in neonatal paediatric populations is partially justified by the fact that this model requires a smaller number of serum samples to estimate pharmacokinetic parameters than more complex models [3, 15]. On the other hand, the administration of vancomycin as an intravenous infusion over 60 min minimizes the effect of the distribution phase on the measured serum concentrations [16]. Furthermore, in order to reduce the error associated with incomplete distribution at the time of blood sampling, it is convenient to delay the blood sampling associated with the estimation of the ‘peak’ vancomycin concentration, this delay being from 1 to 3 h after completion of the infusion [1, 9]. The vancomycin data available for this study were scarce, since they proceeded from routine serum concentration monitoring and fitting of a two-compartment model led to some parameters with standard errors higher than 100%. Therefore a one-compartment was used.
The commonly accepted therapeutic range for the trough vancomycin serum concentration at steady-state is 5–10 µg ml−1. However, the therapeutic range corresponding to the peak concentration depends on the sampling time after completion of drug infusion. When the sampling time is about 1 h, the accepted therapeutic range is 25–35 µg ml−1[2, 3, 14], but in the case of a longer sampling time of 3 h, the range is lower; 15–20 µg ml−1 at our hospital. In general, it is assumed that the most important monitoring point is the trough serum concentration, and there is some controversy about the usefulness of routine monitoring of peak vancomycin serum concentrations [3, 13]. Although there are no definitive data relating vancomycin serum concentrations to effect, the trough concentrations between 5–10 µg ml−1 are often mentioned in the literature. The lower limit of the range for trough concentrations seems to be reasonable, given that susceptibility of most micro-organisms for which vancomycin is used is <1–2 µg ml−1. With a maximal protein binding of 50%, this means that vancomycin trough concentrations will have to exceed 4 µg ml−1 to remain above the minimal inhibitory concentration during the whole administration interval [3]. The upper limit of the range for trough concentrations has been related to nephrotoxicity, although there is insufficient evidence to adhere rigidly to this goal [3].
During the initial selection of covariates (step 2) most of the demographic covariates showed a statistically significant effect on serum clearance of vancomycin when they were individually tested. However when these covariates were included in the pharmacostatistical model one by one, the greater decrease in the objective function was obtained with the postmenstrual age, and this was the first covariate retained in the model. After the incorporation of postmenstrual age as a covariate of clearance, the other demographic covariates were excluded from the model, since all of them (weight, birth weight, gestational age, postnatal age, height and body surface area) were correlated with the postmenstrual age.
The observed relationship between serum clearance of vancomycin and postmenstrual age agree with the fact that vancomycin is cleared renally by glomerular filtration and that there is a positive relationship between postmenstrual age and maturation of renal function [17–19].
De Hoog et al. [4] also used a population pharmacokinetic model for vancomycin with weight-normalized clearance and weight-normalized volume of distribution. However, the authors could not find a significant effect of postmenstrual age on vancomycin clearance as they expected, and they suggested that it could be due to the antenatal exposure of most of their patients to intrauterine corticosteroid administration.
Kimura et al. [20] found an inverse relationship between vancomycin clearance and serum creatinine concentration. In our study, we have not tested the serum creatinine concentration as a covariate of vancomycin clearance because creatinine in neonates reflects maternal concentrations more than neonatal renal function [21, 22].
The only demographic covariate that showed a significant effect on the distribution volume of vancomycin during the individual testing of covariates was the postnatal age. However, this covariate was not retained in the pharmacostatistical model during step 3.
Regarding concomitant therapy, only the co-administration of amoxicillin-clavulanic acid and spironolactone was retained as significant covariates in the final model (Table 3). According to this model, the administration of amoxicillin-clavulanic increased the clearance of vancomycin, whereas the administration of spironolactone decreased the volume of distribution of vancomycin.
It has been described that the human peptide transporter 1 (hPepT1) and human peptide transporter 2 (hPepT2) may play an important role in apical transport of amoxicillin in the renal tubule, and also that amoxicillin competitively inhibited hPepT2-mediated glycylsarcosine uptake [23]. On the other hand, a tubular reabsorption mechanism is probably involved in the renal excretion of vancomycin [24]. Therefore, a possible explanation for the increase in vancomycin clearance could be an inhibition of its tubular reabsorption caused by amoxicillin.
The distribution volume of hydrophilic antibiotics in neonates is affected by total body water content and extracellular fluid volume. The extracellular fluid volume is large in neonates, especially those with low birth weights, and it decreases postnatally [20]. We postulate that spironolactone could decrease vancomycin distribution volume as a consequence of changes in the total body water.
The proposed initial dosage guideline of vancomycin in neonates (Table 5) has been obtained as a function of postmenstrual age and co-administration of amoxicillin-clavulanic acid or spironolactone. Our findings (Table 5) show that, in the case of patients without co-administration of drugs, the dosing interval should be 12 h until a PMA of 37 weeks, with an increase in the weight-normalized dose as the PMA increases, which is a reflection of the increase in vancomycin clearance. For a PMA of 38 weeks or more, the dosing interval should be reduced to 8 h in order to avoid a vancomycin Cmax value exceeding 20 µg ml−1 (maintaining the Cmin value inside the range 5–10 µg ml−1). This reduction in the dosing interval implies a lower dose. As the PMA increases, the weight-normalized dose again increases, until a PMA of 42 weeks. In the case of neonates with a PMA higher than 42 weeks, the proposed dosage is the same than that for neonates with a PMA of 42 weeks: 11.0 mg kg−1 every 8 h.
The proposed change in the dosing interval of vancomycin (neonates with a postmenstrual age ≥38 weeks) is 1 week more that the gestational age corresponding to full-term neonates (≥37 weeks). Therefore, Table 5 suggests that the dosing interval of vancomycin should be 12 h in preterm neonates and 8 h in full-term neonates. In the case of coadministration of amoxicillin-clavulanic acid or spironolactone, the dosing interval would be of 8 h for any PMA ≥ 25 weeks.
In conclusion, the only demographic covariate with a significant effect on the weight-normalized pharmacokinetic parameters of vancomycin in neonates was the postmenstrual age. The administration of amoxicillin-clavulanic increased the clearance of vancomycin, whereas the administration of spironolactone decreased the volume of distribution of vancomycin. An initial dosage guideline for vancomycin is proposed for preterm and full-term neonates, whereas the population pharmacokinetic model can be used for dosage individualization of vancomycin using the Bayesian approach.
Conflict of interests
The authors declare they have no conflict of interests.
The authors would like to thank the Pharmacy Service at Hospital La Fe.
REFERENCES
- 1.Matzke GR. Vancomycin. In: Evans WE, Schentag JJ, Jusko WJ, editors. Applied Pharmacokinetics: Principles of Therapeutic Drug Monitoring. 3. Vancouver: Applied Therapeutics. Inc.; 1992. pp. 1–35. 15. [Google Scholar]
- 2.Asbury WH, Darsey EH, Rose WB, Murphy JE, Buffington DE, Capers CC. Vancomycin pharmacokinetics in neonates and infants: a retrospective evaluation. Ann Pharmacother. 1993;27:490–6. doi: 10.1177/106002809302700417. [DOI] [PubMed] [Google Scholar]
- 3.De Hoog M, Mouton JW, Van den Anker JN. Vancomycin. Pharmacokinetics and administration regimens in neonates. Clin Pharmacokinet. 2004;43:417–39. doi: 10.2165/00003088-200443070-00001. [DOI] [PubMed] [Google Scholar]
- 4.De Hoog M, Schoemaker RC, Mouton JW, Van den Anker JN. Vancomycin population pharmacokinetics. Clin Pharmacol Ther. 2000;67:360–7. doi: 10.1067/mcp.2000.105353. [DOI] [PubMed] [Google Scholar]
- 5.Seay RE, Brundage RC, Jensen PD, Schilling CG, Edgren BE. Population pharmacokinetics of vancomycin in neonates. Clin Pharmacol Ther. 1994;56:169–75. doi: 10.1038/clpt.1994.120. [DOI] [PubMed] [Google Scholar]
- 6.Leonard MB, Koren G, Stevenson DK, Prober CG. Vancomycin pharmacokinetics in very low birth weight neonates. Pediatr Infect Dis J. 1989;8:282–6. [PubMed] [Google Scholar]
- 7.Taketomo CK, Hodding JH, Kraus DM. Pediatric Dosage Handbook. 2nd. Hudson: Lexi-Comp Inc; 1993. [Google Scholar]
- 8.Prycka RD. Vancomycin serum concentration monitoring: a continued debate. Ann Pharmacother. 1994;28:1397–9. doi: 10.1177/106002809402801212. [DOI] [PubMed] [Google Scholar]
- 9.Fernandez de Gatta MM, Fruns I, Calvo MV, Lanao JM, Dominguez-Gil A. Influence of pharmacokinetic model on vancomycin peak concentration targets. Ther Drug Monit. 1996;18:145–8. doi: 10.1097/00007691-199604000-00006. [DOI] [PubMed] [Google Scholar]
- 10.Beal SL, Sheiner LB. NONMEM User's Guides. San Francisco, CA: University of California; 1989. San Francisco: NONMEM Project Group. [Google Scholar]
- 11.Sheiner LB, Beal SL. Some suggestions for measuring predictive performance. J Pharmacokinet Biopharm. 1981;9:503–12. doi: 10.1007/BF01060893. [DOI] [PubMed] [Google Scholar]
- 12.Lopez-Samblas AM, Diaz PR, Binion KH. Drug dosing in the neonate. In: Murphy JE, editor. Clinical Pharmacokinetics Pocket Reference. Bethesda, MD: American Society of Hospital Pharmacists; 1993. pp. 321–39. [Google Scholar]
- 13.Tan WH, Brown N, Kelsall AW, McClure RJ. Dose regimen for vancomycin not needing serum peak levels? Arch Dis Child Fetal Neonatal Ed. 2002;87:214–16. doi: 10.1136/fn.87.3.F214. [DOI] [PMC free article] [PubMed] [Google Scholar]
- 14.Grimsley C, Thomson AH. Pharmacokinetics and dose requirements of vancomycin in neonates. Arch Dis Child Fetal Neonatal Ed. 1999;81:221–7. doi: 10.1136/fn.81.3.f221. [DOI] [PMC free article] [PubMed] [Google Scholar]
- 15.Rodvold KA, Gentry CA, Plank GS, Kraus DM, Nickel E, Gross JR. Bayesian forecasting of serum vancomycin concentrations in neonates and infants. Ther Drug Monit. 1995;17:239–46. doi: 10.1097/00007691-199506000-00005. [DOI] [PubMed] [Google Scholar]
- 16.McDougal A, Ling EW, Levine M. Vancomycin pharmacokinetics and dosing in premature neonates. Ther Drug Monit. 1995;17:319–26. doi: 10.1097/00007691-199508000-00001. [DOI] [PubMed] [Google Scholar]
- 17.Capparelli EV, Lane JR, Romanowski GL, McFeely EJ, Murray W, Sousa P, Kildoo C, Connor JD. The influences of renal function and maturation on vancomycin elimination in newborns and infants. J Clin Pharmacol. 2001;41:927–34. doi: 10.1177/00912700122010898. [DOI] [PubMed] [Google Scholar]
- 18.Kildoo CW, Lin LM, Gabriel MH, Folli HL, Modanlou HD. Vancomycin pharmacokinetics in infants: relationship to postconceptional age and serum creatinine. Dev Pharmacol Ther. 1989;14:77–83. [PubMed] [Google Scholar]
- 19.Ohnishi A, Yano Y, Ishibashi T, Katsube T, Oguma T. Evaluation of Bayesian predictability of vancomycin concentration using population pharmacokinetic parameters in pediatric patients. Drug Metab Pharmacokinet. 2005;20:415–22. doi: 10.2133/dmpk.20.415. [DOI] [PubMed] [Google Scholar]
- 20.Kimura T, Sunakawa K, Matsuura N, Kubo H, Shimada S, Yago K. Population pharmacokinetics of arbekacin, vancomycin, and panipenem in neonates. Antimicrob Agents Chemother. 2004;48:1159–67. doi: 10.1128/AAC.48.4.1159-1167.2004. [DOI] [PMC free article] [PubMed] [Google Scholar]
- 21.Guignard JP, Drukker MD. Why do newborn infants have a high plasma creatinine? Pediatrics. 1999;103:e49. doi: 10.1542/peds.103.4.e49. [DOI] [PubMed] [Google Scholar]
- 22.Anderson BJ, Allegaert K, Van den Anker JN, Cossey V, Holford NH. Vancomycin pharmacokinetics in preterm neonates and the prediction of adult clearance. Br J Clin Pharmacol. 2006;63:75–84. doi: 10.1111/j.1365-2125.2006.02725.x. [DOI] [PMC free article] [PubMed] [Google Scholar]
- 23.Li M, Anderson GD, Phillips BR, Kong W, Shen DD, Wang J. Interactions of amoxicillin and cefaclor with human renal organic anion and peptide transporters. Drug Metab Dispos. 2006;34:547–55. doi: 10.1124/dmd.105.006791. [DOI] [PubMed] [Google Scholar]
- 24.Fanos V, Benini D, Vinco S, Pizzini C, Khoory BJ. Glycopeptides and the newborn infant's kidney. Pediatr Med Chir. 1997;19:259–62. [PubMed] [Google Scholar]