

Abstract
The genetic etiology of prostate cancer, the most common form of male cancer in western countries, is complex and the interplay of disease genes with environmental factors is far from being understood. Studies on somatic mitochondrial DNA (mtDNA) mutations have become an important aspect of cancer research because these mutations might have functional consequences and/or might serve as biosensors for tumor detection and progression. We sequenced the entire mitochondrial genome (16,569 bp) from 30 prospectively collected pairs of macrodissected cancerous and benign cells from prostate cancer patients and compared their genetic variability. Given recent concerns regarding the authenticity of newly discovered mtDNA mutations, we implemented a high-quality procedure for mtDNA whole-genome sequencing. In addition, the mitochondrial genes MT-CO2, MT-CO3, MT-ATP6, and MT-ND6 were sequenced in further 35 paired samples from prostate cancer patients. We identified a total of 41 somatic mutations in 22 out of 30 patients: the majority of these mutations have not previously been observed in the human phylogeny. The presence of somatic mutations in transfer RNAs (tRNAs) was found to be associated with elevated PSA levels (14.25 ± 5.44 versus 7.15 ± 4.32 ng/ml; p = 0.004). The level and degree of heteroplasmy increased with increasing tumor activity. In summary, somatic mutations in the mitochondrial genome are frequent events in prostate cancer. Mutations mapping to mitochondrial tRNAs, ribosomal RNAs, and protein coding genes might impair processes that occur within the mitochondrial compartment (e.g., transcription, RNA processing, and translation) and might finally affect oxidative phosphorylation.
Introduction
Prostate cancer is the most frequent cancer among men in the United States1 and the third most common cancer in the European Union.2 Although genome-wide association studies identified several risk loci for prostate cancer on autosomal genes,3–7 extensive analyses on the roles of mitochondrial DNA (mtDNA) mutations are missing.
Mitochondria have been implicated in the process of carcinogenesis because of their vital role in energy production8 and apoptosis.9 The mitochondrial genome exhibits a high mutation rate10 and accumulates somatic mutations and deletions in tumor tissue.11–14 The evolution of the human mitochondrial genome is characterized by the emergence of haplogroups, clusters of evolutionary closely related pedigrees that are defined by certain polymorphisms.15 These haplogroup-specific polymorphisms are widely neutral, and presumable associations of these evolutionary informative polymorphisms to cancer risk have led to ongoing discussion.16 The haplogroup affiliation was found to have no influence on prostate cancer in a European17 as well as in an Asian population18 but was reported to be a risk factor in a North American population.19
Another feature of mtDNA is the occurrence of heteroplasmy, which is defined as the coexistence of two or more populations of mtDNA molecules with slightly different nucleotide composition in a single cell, tissue, or individual. Identification of low levels of heteroplasmy are thought to allow an early identification and monitoring of neoplastic progression to malignancy.
Up to now, the influence of mtDNA on the origin and progression of prostate cancer has not been understood. Although many studies seem to support an active role of mtDNA in prostate tumorigenesis,20–22 there are concerns regarding the data quality, interpretation, and even the experimental design, which undermine the original claims. A critical reassessment of reported somatic mutations in cancers employing phylogenetic algorithms revealed that many of these investigations were affected by erroneous data and that the high frequency of mutations could be attributed to artifacts instead of real somatic events.23
The aim of the present study was to clarify the role of somatic mtDNA mutations in prostate cancer by analyzing frequency and nature of somatic mtDNA mutations and their suitability for monitoring malignant transformation, tumor progression, and metastasis. We sequenced the entire mitochondrial genome in macrodissected prostate cancer tissue with varying Gleason scores and distant benign cells by using a rigorous high-quality sequencing strategy. With this strategy, low levels of heteroplasmy can be identified, which may allow the identification of an early stage of tumorigenesis and the monitoring of further progression to malignancy.
Material and Methods
Patient Data
Tissue samples were prospectively collected over a time frame of 18 months starting in January 2009. Patients aged 18 or older, who had signed an informed consent, were consecutively included in the study. Patients with a prostate carcinoma that had been treated with chemotherapy or radiotherapy before prostatectomy were excluded. Because we expected a higher mutation rate in patients with advanced stages of prostate cancer, we selected a higher proportion of patients with Gleason score 8 and 9, followed by those with score 7 and less with low scores. The following clinical parameters were collected: age; prostate-specific antigen (PSA) level at diagnosis; development of a tumor relapse during follow-up; Gleason score of the radical prostatectomy diagnosis; TNM-stadium (including extraprostatic extension24); and Epstein criteria (significant versus insignificant).25 On average, the patients were followed for 24 months after tumor diagnosis (interquartile range: 8–41 months). This study was approved by the ethics committee of the Innsbruck Medical University (study code UN3426).
Tissue Samples and DNA Extraction
DNA from prostate cancer was extracted from 65 patients (primary screen: n = 30; targeted screen: n = 35) who underwent a radical prostatectomy (Table S1 available online). A uropathologist determined benign and predominantly malign regions on HE-stained slides from frozen sections. Because prostate cancer shows heterogeneous growth patterns with various amounts of benign glands between tumor cells, areas with the highest possible density of cancer were selected. The chosen tissue was additionally confirmed to be either cancerous or tumor-free by immunohistochemistry (benign: positive expression of the basal cell marker p63; cancer: no expression of p63).26 Quantitative cell number analysis of the macrodissected areas was performed by the combination of an image acquisition and data management module (HistoFAXS, TissueGnostics, Vienna) plus an analysis module for immunohistochemical staining (HistoQuest). This system automatically acquires immunohistochemically stained sections with nuclear counterstaining and performs quantitative analysis via algorithms, which allow the identification of the total cell number (with Hematoxylin as marker) and specific cell numbers (with the specific antibodies E-Cadherin and p63 as markers). Thereby, the total number and percentage of epithelial prostate cancer cells, benign epithelial prostate cells, and nonepithelial cells (stromal/endothelial/inflammatory/blood cells) could be calculated.
In several patients, cancer from the prostate gland had already invaded the seminal vesicles. In one of these patients we extracted DNA from seminal vesicle-invasive cancer formations in addition to the intraprostatic tumor. Per patient, three frozen sections corresponding to the selected area on the HE-stained slides were used for macrodissection. Regions with predominantly malignant and purely benign cells were each encircled with a sapphire cutter, and the DNA extraction buffer was applied directly onto the frozen section. After a few minutes, the buffers retaining the dissolved tissue of the corresponding regions were gathered with a pipette and fused into one reaction tube. DNA was extracted with a BioRobot EZ1 advanced Workstation with the EZ1 DNA tissue kit (QIAGEN, Hilden, Germany) and quantified with a NanoDrop spectrophotometer (Thermo Fisher Scientific Inc., Waltham, MA).
Amplification and Sequencing of the Entire Mitochondrial Genome
The entire mitochondrial genome from 30 patients was sequenced separately for both benign and cancerous tissue samples. Amplification was done in two overlapping fragments of approximately 9 kb each according to the strategy published by Gonder et al.27 with minor modifications (fragments A and B; Table S2). Fragment B could not be amplified in samples harboring a mutation on m.C10670T, so we used an alternative primer pair in these cases (region 9754 to 3557, fragment B2, Table S2). The DNA was amplified in a total reaction volume of 100 μl, containing about 560 ng (fragment A) or 400 ng (fragment B) of DNA, 2 μl of Herculase II Fusion DNA Polymerase (Stratagene, La Jolla, CA), 20 μl of 5×PCR reaction buffer, 250 μM each dNTP (Stratagene), and 0.25 μM each primer. The amplification reaction was conducted on a 96-well thermal cycler (Bio-Rad Laboratories GmbH, Munich, Germany). The reaction cocktails were heated to 95°C (2 min) and then put through 10 touch-down reaction cycles: 95°C for 20 s, 69°C–0.5C°/cycle for 20 s, and 72°C for 4 min 30 s, followed by 40 amplification cycles with an annealing temperature of 64°C and a final extension phase at 72°C for 10 min. For better cycling performance, PCR mastermixes were split into two 50 μl reactions and fused again after purification with the QiaVac (QIAquick Multiwell PCR Purification Kit; QIAGEN). Each sample was sequenced with 96 primers (48 for each fragment) that were arrayed on a primer master-plate similar to Fendt et al.28 with mostly published27–34 and several newly designed primers (Table S2). For cycle sequencing, 2 μl of purified PCR product were combined with the sequencing master mix (containing 1 μl BigDye Terminator v1.1 Cycle Sequencing RR mix [Applied Biosystems, AB, Foster City, CA], 3 μl Sequencing Buffer [AB], 0.3 μM primer, and distilled water up to 10 μl) and cycled (after a first denaturation step of 96°C, 1 min) for 25 cycles of 10 s at 96°C, 5 s at 50°C, and 4 min at 60°C. Purification of cycle-sequencing products with Sephadex (GE Healthcare) was according to the procedure described in Brandstätter et al.30 Electrophoretic separation was carried out on an ABI3130xl capillary sequencer with POP-7 and a 36 cm capillary array.
Amplification and Sequencing of Selected Regions
After the primary screen, mitochondrial genes that were hit by somatic mutations several times were selectively targeted in further 35 patients. Three mitochondrial fragments were amplified and sequenced: Fragment C1 (amplified with primers F7249 and R9509; sequenced with primers F7249, R7773, F7619, F7956, R8082, F8129) spanned 1830 bp, including MT-TS1 (MIM 590080), MT-TD (MIM 590015), MT-CO2 (MIM 516040), and MT-TK (MIM 590060). Fragment C2 (amplified with primers F8355 and R10259; sequenced with primers F8355, F8559, F8708, F9123, R9383, F9330, F9507, F9770, F9892) spanned 1928 bp, including MT-ATP6 (MIM 516060), MT-CO3 (MIM 516050), and MT-TG (MIM 590035). Fragment D (amplified with primers F13920 and R14976; sequenced with primers F13920, F14189, F14311, F14490) spanned 1098 bp, including MT-ND6 (MIM 516006) and MT-TE (MIM 590025). The reaction cocktails were heated to 95°C (2 min) and then put through 30 amplification cycles: 95°C for 20 s, 62°C for 20 s, and 72°C for 1 min, followed by a final extension phase at 72°C for 3 min. 40 ng of DNA were amplified in a total reaction volume of 20 μl, containing 0.2 μl of Herculase II Fusion DNA Polymerase, 4 μl of 5×PCR reaction buffer, 250 μM each dNTP, and 0.25 μM each primer. Post-PCR treatment and cycle sequencing was performed as described above.
Sequence Evaluation, Quality Management, and Haplogroup Determination
Sequence electropherograms were aligned to the revised Cambridge Reference Sequence (rCRS; NC_01292035) with Sequencher (v4.9, GeneCodes, Ann Arbor, MI). A nucleotide position was considered heteroplasmic if a secondary peak of more than about 10% of the height of the primary peak was present. This needed to be confirmed with at least one forward and one reverse sequencing reaction or two different forward reactions. In the case of homopolymeric cytosine tracts, we determined the number of cytosines by counting the number of “dominant Cs.” Point heteroplasmic mixtures were characterized by comparing the heights of the two contributing peaks36 (Figure 1).
Figure 1.

HE Staining and Immunohistochemical Expression of p63 in Prostate Tissue Sections
(A) 40-fold magnification of frozen sections showing HE staining of benign (A1 and A3, left side) and prostate cancer (A3, right side) tissue and immunohistochemical staining for the basal cell marker p63 (brown) with positive expression in benign (A2 and A4, left side) and negative expression in cancer glands (A4, right side).
(B) 40-fold magnification of paraffin slides (from formalin-fixed tissue adjacent to the frozen material) showing HE staining of benign (B1) and prostate cancer (B3) tissue and immunohistochemical staining for p63 in benign cells (B2) and negative expression in cancer glands (B4).
(C) 400-fold magnification of selected cut-outs of the slides shown in (B).
(D) Example of a heteroplasmic mutation in MT-CO3 in the cancerous tissue of one sample, which was not present in the normal tissue.
Every mtDNA genome was evaluated independently by two mtDNA technicians and validated by a senior mtDNA scientist with the mtDNA management software eCOMPAGT.37,38 eCOMPAGT enables an error-free postlaboratory data handling of human mtDNA profiles, because mtDNA profiles can be imported from different sequence evaluation programs, compared between evaluations, and connected to phenotype data for genetic association analyses. In addition, somatic mutations, i.e., differences between benign and cancerous mtDNA profiles from one patient, were automatically extracted with eCOMPAGT. The mtDNA haplotypes were affiliated to haplogroups with HaploGrep39 based on patterns of haplogroup-specific or haplogroup-associated polymorphisms as summarized in PhyloTree.15 For quality assurance and in order to exclude contamination as potential source for the observed heteroplasmies, entire mtDNA profiles were generated from four lab technicians, who were involved in sample handling and genotyping.
Bioinformatic and Statistical Analyses
The potential functional impact of all identified nonsynonymous mutations was analyzed with tools from the GenEpi Toolbox,40 namely Polyphen,41 SIFT,42 and PMUT.43 The predictions were combined as reported in Table S3 to form a three-staged rating of the functional relevance of each mutation. For analyzing the impact of somatic transfer RNA (tRNA) mutations, we consulted Mamit-tRNA.44
Expectations between two unrelated variables were tested for equality via a Mann-Whitney U-test. Pearson's chi-square test was used to assess whether paired observations on two categorical variables were independent of each other. Where sample sizes were small, Fisher's exact test was used. Linear regression was applied to analyze the relationship between several independent variables and the PSA value as dependent variable. Statistical analyses were performed with SPSS 17.0 (SPSS Inc., Chicago, IL).
Results
We sequenced the entire mitochondrial genome (16,569 bp) in benign and cancerous tissue samples from 30 patients with prostate cancer and four lab technicians (Figure 2 and Table S4). The mtDNA sequences can be accessed via GenBank (HM625678–HM625711HM625678HM625679HM625680HM625681HM625682HM625683HM625684HM625685HM625686HM625687HM625688HM625689HM625690HM625691HM625692HM625693HM625694HM625695HM625696HM625697HM625698HM625699HM625700HM625701HM625702HM625703HM625704HM625705HM625706HM625707HM625708HM625709HM625710HM625711). The haplogroup distribution was equivalent to the haplogroup structure of a local population sample of 273 healthy Austrians30 (p = 0.498). The profiles obtained from 35 further patients sequenced for selected regions are summarized in Table S5.
Figure 2.

Phylogenetic Tree Representing the Benign Profiles of 30 Prostate Cancer Patients and Four Lab Technicians
The sequences are stored in GenBank (accession numbers HM625678–HM625711HM625678HM625679HM625680HM625681HM625682HM625683HM625684HM625685HM625686HM625687HM625688HM625689HM625690HM625691HM625692HM625693HM625694HM625695HM625696HM625697HM625698HM625699HM625700HM625701HM625702HM625703HM625704HM625705HM625706HM625707HM625708HM625709HM625710HM625711, corresponding to PCA001–PCA030 and Lab001–Lab004). The position of the rCRS is indicated for reading off sequence motifs. Mutations are transitions unless a base is explicitly indicated. The prefix “@” designates reversions, whereas suffixes indicate transversions (to A, G, C, or T), indels (.1, d), and heteroplasmies (R, Y). The variation in number of Cs at nucleotide position 16193, 309, and 315 was not included in the phylogeny; detailed information regarding each mtDNA is available in Table S4. Point heteroplasmic mutations that were observed in benign tissue samples are highlighted in turquoise.
In the primary entire mtDNA genome screen of 30 patients, we detected 41 somatic mutations in the cancerous tissue as point or length heteroplasmies on 39 nucleotide positions in 22 patients (Table S6 and Figure 3). In order to ensure that the somatic mutations in the cancerous tissue were definitely not derived from germline mutations, we additionally collected blood samples from 10 patients who exhibited a somatic tumor mutation (patients PCA003, PCA009, PCA012, PCA014, PCA018, PCA020, PCA022, PCA023, PCA025, and PCA027) and sequenced their entire mitochondrial genome from white blood cells. All of these blood samples showed the identical mtDNA profile as the benign tissue samples and were free of the somatic tumor mutations observed in the respective cancerous tissue.
Figure 3.
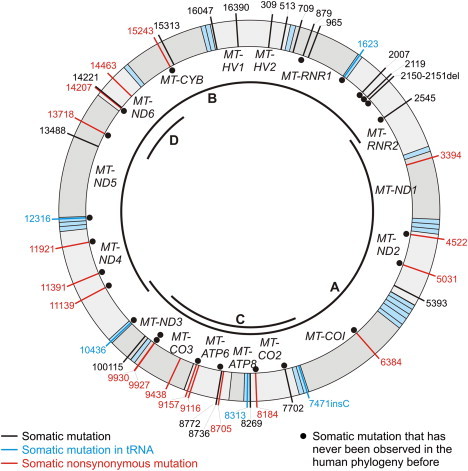
Distribution of All Observed Somatic Mutations over the Mitochondrial Genome
Transfer RNAs are shaded in light blue. The location of the PCR fragments for the primary screen of entire mtDNA genomes (fragments A and B) and the secondary, targeted screen (fragments C and D) are indicated in the inner circle of the mtDNA.
In the secondary targeted scan in 35 patients, we identified five additional somatic tumor mutations on different positions in three patients (Table S6). Thus, the targeted sequencing did not support our hypothesis that these specific genes were more susceptible to somatic mutations than other parts of the mitochondrial genome.
Somatic Mutations in the Control Region
The control region (16024–16569; 1–576) presented a low degree of somatic mutations. Three point heteroplasmic mutations on m.G16047R, m.G16390R, and m.G513R were observed; interestingly, the latter two were observed only in the seminal vesicle from invasive cancer formations in patient PCA015, but not in the same patient's intraprostatic tumor tissue. m.G16390R was also present in the benign tissue from this patient (at low level, ∼15%), but m.G513R was exclusively seen in the malignant seminal vesicle.
Somatic Mutations in Ribosomal RNAs
In total, seven somatic mutations within ribosomal RNA genes (MT-RNR1 [MIM 561000] and MT-RNR2 [MIM 561010]) were observed in 30 mitochondrial genomes. As the major components of mitochondrial ribosomes, ribosomal RNAs play essential roles in mitochondrial protein synthesis.45 None of the somatic MT-RNR2 mutations has previously been observed in the human phylogeny overseeing data from 5140 individuals,46 thus suggesting a high pathological character of these mutations.
Two mutations are especially interesting. The somatic deletion at position m.2150_2151delTA is located in the GTPase-associated center, which is involved in binding of elongation factor EFG, which catalyzes the translocation of tRNAs on the ribosome;47 the mutation might thus delay protein synthesis by interfering with mitochondrial tRNA translocation. The mutation m.T879Y disrupts a pseudoknot-interaction within MT-RNR1, which might result in an interference with mitochondrial protein synthesis and function. m.T879Y was also observed in an independent study on cancer samples.48
Interestingly, we observed point heteroplasmy (m.T1443Y) in the benign tissue of sample PCA026, which was not present in the corresponding tumor tissue. We repeated the entire analysis with freshly extracted DNA, but obtained an identical result. We observed a slight tendency to higher Gleason scores in tumors with a somatic ribosomal RNA mutation (p = 0.043).
Somatic Mutations in Transfer RNAs
Within 30 entire mtDNA genomes, we observed five somatic mutations mapping within tRNA genes with possibly dramatic consequences (Figure 4). m.T10436Y was located within the anticodon of MT-TR (MIM 590005) and changes the arginine anticodon to a glutamine anticodon, most probably resulting in a misincorporation of arginine at glutamine codons. m.G1623R was located in the D-stem of MT-TV (MIM 590105) and could be expected to disrupt a Watson-Crick base pair with a possible impact on the D-loop, thus disturbing the global conformation of the tRNA. Length heteroplasmy was detected at m.7471_7472insC in MT-TS1 in the prostate carcinoma and malignant seminal vesicle of patient PCA015, with the heteroplasmy being more pronounced in the tumor of the seminal vesicle. m.7471_7472insC was already found in gastric carcinoma.49 Interestingly, the presence of somatic tRNA mutations was strongly associated with the occurrence of somatic control region mutations (p = 0.018). Patients with a somatic tRNA mutation had a significantly higher PSA value at diagnosis than patients without a somatic tRNA mutation (14.25 ± 5.44 versus 7.15 ± 4.32 ng/ml; p = 0.004) (Figure 5).
Figure 4.
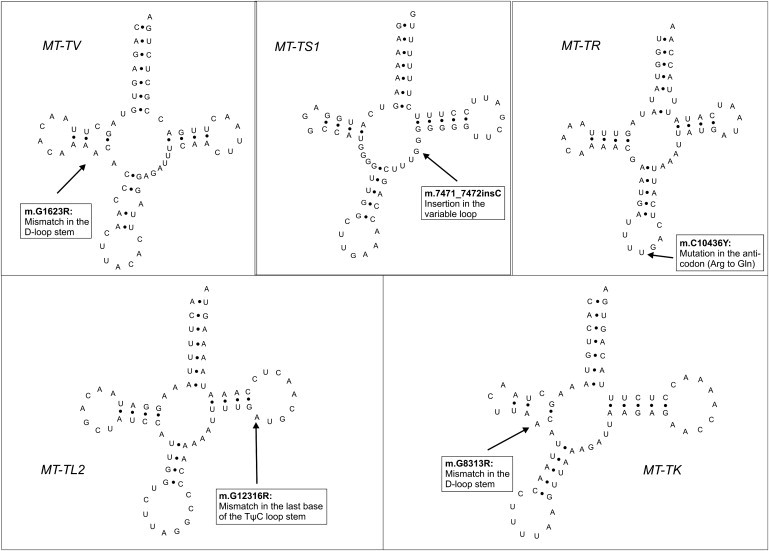
Location of Somatic tRNA Mutations in the Secondary Structure of the tRNAs
Figure 5.

Difference in PSA at Diagnosis between Patients with and without Somatic tRNA Mutations
Somatic Mutations in Protein-Coding Regions
The mutation m.G8184R was found in the benign tissue as well as in the tumor tissue from the prostate gland and the seminal vesicle from patient PCA015: the amount of the mutated nucleotide increased from the benign tissue (15%) to prostate tumor (30%) to seminal vesicle tumor (40%), which supports the hypothesis that the proportion of mutated mtDNA molecules increases with malignancy. A similar observation was made with the MT-ATP6 mutation m.C870Y: whereas the benign tissue exhibited 40% of the mutated nucleotide, in the cancerous tissue the mutated predominated over the wild-type nucleotide. The observation of three further mutations on m.T8736Y, m.T8772Y, and m.T9116Y in the relatively small region of MT-ATP6 (680 bp) suggested that MT-ATP6 could be especially susceptible to somatic mutations. Therefore, we genotyped further 35 prostate cancer patients specifically in MT-ATP6, but we found only one additional mutation (m.G9157R).
Linear Regression Analysis
The presence of a somatic tRNA mutation was significantly associated with PSA levels after controlling for age and Gleason score (p = 0.014) (Table 1). The influence of the Gleason score on PSA levels was borderline significant (p = 0.055).
Table 1.
Linear Regression on PSA Levels
| Variable | Coefficient | SE | p Value |
|---|---|---|---|
| Age at diagnosis | −0.286 | 0.117 | 0.021 |
| Gleason score | 1.089 | 0.543 | 0.055 |
| Somatic mutation in tRNA | 5.778 | 2.203 | 0.014 |
The outcome variable was the PSA level; the influence of somatic mutations in tRNAs was evaluated by adjusting also for age and Gleason score.
Discussion
Although many tumors have been found to contain somatic mtDNA mutations, little is known about whether these mutations alter the signature of a tumor cell. The amount of mitochondrial MT-RNR1, MT-CO2, and MT-ATP6 transcripts was found to be decreased in tumor samples when compared to their paired normal samples, suggesting that mitochondrial gene expression is altered in prostate cancer.50 In addition, highly metastatic cells showed reduced activity of NADH dehydrogenase, and these defects were shown to result from pathogenic mutations in the mtDNA.51 Another recent study20,52 introduced an mtDNA mutation into human prostate cancer cells, which substantially increased tumor growth in the bone, supporting the concept that mtDNA mutations enhance prostate cancer bone metastasis. Clearly, mtDNA copy number increases during prostate cancer development53 and could thus further increase the effects of pathogenic mutations. Indeed, it was found that in somatic cancer sequences, mtDNA genes show relaxed negative selection relative to germline, with considerably higher cancer missense mutation rates, suggesting that tumors select for mutations located at highly functional positions within the mitochondrial genome.54
The majority (55.8%) of somatic mutations that we found in our sample have so far not been observed in the human phylogeny, and further 30.2% of somatic mutations occurred at frequencies below 1% in a database of 5140 entire human genomes.46 Notably, 14% of the somatic mutations are well known to be associated with various mitochondrial diseases (Table S6), thus again emphasizing their deleterious signature. Interestingly, however, none of the mutations described in Petros et al.,20 who focused on somatic MT-COI mutations (MIM 516030), were found in our study population. This suggests that a screening for specific mutations will not be effective but rather sequencing of selected mitochondrial regions might result in a mutation spectrum useful for prognosis. This line is supported by the different mutation spectrum we have found in the second part (targeted screen) of our study.
The most intriguing observation from our mutation screen was the association between the presence of somatic tRNA mutations and PSA levels at diagnosis. PSA is produced in the prostatic glands inside the prostate and functions in the liquidification of the seminal fluid. The basement membrane surrounding the normal prostate gland prevents PSA from entering the blood. When the tissue and basement membranes are injured, this barrier is decreased. Transfer RNAs are key molecules in translation of genetic information from mRNA into proteins. The mitochondrial tRNA machinery consists of only 22 different tRNAs, thereby lacking tRNA isoacceptor variants for most mitochondrial mRNA codons, with the exception of serine and leucine.55 Given this low redundancy, it is not surprising that a growing number of human diseases are found to be correlated to point mutations in mitochondrial tRNA genes. Mutations in tRNAs can impair the processing of genes, the aminoacylation, and the protein synthesis. The accumulation of nonfunctional mitochondrial proteins could affect tissue integrity, resulting in increased leaking of PSA into the blood circulation, which could then lead to elevated PSA levels. Alternatively, cancer cells disrupt the blood-prostate barrier, thereby causing leakage of PSA.
In general, all tRNA mutations and at least two of the described ribosomal RNA mutations might have a converging negative effect on protein synthesis in mitochondria by interfering with the translation machinery. The expected result from such interference in protein synthesis is a lack of mitochondrial function, in particular a reduction or inhibition of oxidative phosphorylation.
Another intriguing observation was that somatic mutations in tRNAs were associated with somatic mutations in the noncoding control region. The control region is the main regulatory region; it contains stem-loop hairpins forming mitochondrial origins of replication (OL). Additionally, tRNA genes also form OL-like structures that initiate mitochondrial replication and thus function as alternative OLs.56 It was shown that pathogenic mutations in tRNA genes, especially within anticodon loops, increase the tRNA's capacities to form secondary structures resembling mitochondrial OL, which might then invoke bidirectional replication.56 This could subsequently cause secondary mutations in other genomic regions such as the mitochondrial control region.
Our study cannot unambiguously answer the question whether mutations were the cause for or merely a reflection of genomic instability. An excess of amino acid changes relative to the rate of silent changes indicates positive selection; fewer missense mutations indicate negative selection.54 Indeed, there were exactly twice as many somatic missense mutations as synonymous mutations in our sample, hinting to a highly relaxed negative selection in cancer cells relative to germline. The somatic mutations found in the HVS-II C-stretch of the control region suggest genome vulnerability; however, the plethora of nonsynonymous mutations in genes contributing products to the electron transport process predicts a negative effect on metabolic processes. Moreover, mutations in mitochondrial tRNAs will very probably severely interfere with mitochondrial protein synthesis. The occurrence of somatic cancer mutations in highly conserved residues therefore suggests that mutations impairing mitochondrial function may confer a mitogenic advantage in the changing cancer microenvironment.
The investigation of the patient with a tumor in the prostate gland that had invaded the seminal vesicle sheds further light on the question of whether the processes of somatic mtDNA mutation accumulation and increase of tumor progression were independent events. Indeed, the invasive tumor tissue showed two additional somatic mutations that were not present in the primary tumor, and in addition the proportion of the mutant nucleotide was higher in the invasive tumor compared to the primary tumor. Another interesting observation was that all patients with heteroplasmic point mutations in benign tissue samples had a Gleason score of 9; however, given the high percentage of Gleason 9 tumors in our sample of 30 entire mtDNA genome patients, the chance of randomly observing all benign heteroplasmic point mutations in Gleason 9 tumors was 20.1%. So this could either be a perchance observation or it could hint to a pre-existing condition of low-level heteroplasmy, which either initiated carcinogenesis or induced tumor proliferation, higher aggressiveness, and invasive growth pattern, because the level of heteroplasmy was considerably more pronounced in the tumor tissue compared to the benign tissue. We can exclude contamination of the benign tissue with tumor cells, because the DNA was extracted from different and distant frozen sections for benign and cancerous tissue samples and the selected benign tissue was confirmed to be tumor free by immunohistochemistry.
The selection of tumors for our study was intentionally biased toward high-grade tumors because we expected mutations to occur mainly in these advanced stages. Compared to long-term observations from our clinic, we selected about three times more patients with Gleason score 8 to 9 with an underrepresentation of those with score 5 to 6. This is clearly not representative of patients with prostate cancer who are treated by radical prostatectomy. However, this selection would not have an effect on the observation that somatic mtDNA mutations are common in advanced stages of prostate cancer.
The possibility to detect heteroplasmy by PCR and consecutive Sanger sequencing strongly depends on the amplification strategy57 and on the overall quality of the electropherograms. Low-level heteroplasmy (mixtures with minor components below 20%) can be spotted only in sequences with low background noise.36 However, Sanger sequencing allows semiquantitative estimations only on the actual amounts within the mixture. Depending on the position and direction of the sequencing primer (forward or reverse) and on the sequence neighborhood of the heteroplasmic position, the proportion of the overlapping basecalls on one position can vary dramatically (this phenomenon can be seen, for example, in Figure 1). Our approach to tackle the problem was to average the mixture ratio over all available sequence reads on a given heteroplasmic position. A very comprehensive overview of the capacities of next-generation sequencing to detect and quantify mtDNA heteroplasmy is provided by a recent study of Li and coworkers.58 The authors found that by following stringent quality control measures for avoiding false positive resulting from sequencing error, heteroplasmy could be reliably detected down to a level of 10% of the minor component. Therefore, next-generation sequencing technologies can provide new insights into genome-wide aspects of mtDNA heteroplasmy.
In summary, our study has several strengths: (1) it targets the entire mitochondrial genome in cancer and benign tissue from the same patient with a superior sequencing strategy that has stringent quality assurance procedures; (2) the prospective character of the study enabled the evaluation of the incidence of a tumor relapse depending on the occurrence of somatic mutations; and (3) the paired design of our study targeting both benign and carcinogenic tissue within the same person increases the power of our study, because the detection probability of cancer-related mutations is higher in paired samples than case-control studies involving people without prostate cancer. The small sample size (n = 30) and the lack of a functional characterization of the detected somatic mutations could be considered as limitations of our study. However, with the increasing implementation of next-generation sequencing technologies, it should be possible to screen larger well-characterized prostate cancer samples for somatic mutations and to validate the association of somatic tRNA mutations with PSA levels.
Acknowledgments
The project was supported by Dr. Legerlotz-Stiftung (2007-02) and by ONCOTYROL (SFB 021). We appreciate the excellent technical assistance of Irma Sottsas, Birgit Stenzel, Eberhard Steiner (Department of Urology, Innsbruck Medical University), and Margot Haun (Division of Genetic Epidemiology, Innsbruck Medical University). We thank Krista Trappl (Division of Genomics & RNomics, Innsbruck Medical University) and Hervé Seligmann (Department of Biology, University of Oslo) for useful discussion.
Supplemental Data
Web Resources
The URLs for data presented herein are as follows:
GenBank, http://www.ncbi.nlm.nih.gov/nuccore
GenEpi Toolbox, http://genepi_toolbox.i-med.ac.at/
HaploGrep, http://haplogrep.uibk.ac.at/index.html
Mamit-tRNA, http://mamit-trna.u-strasbg.fr/
Online Mendelian Inheritance in Man, http://www.ncbi.nlm.nih.gov/Omim
PhyloTree, http://www.phylotree.org/
Polyphen, http://genetics.bwh.harvard.edu/pph/
Stanford Genome Technology Center, http://insertion.stanford.edu/primers.html
Accession Numbers
The GenBank accession numbers for the 34 entire mitochondrial genomes reported in this paper are HM625678–HM625711HM625678HM625679HM625680HM625681HM625682HM625683HM625684HM625685HM625686HM625687HM625688HM625689HM625690HM625691HM625692HM625693HM625694HM625695HM625696HM625697HM625698HM625699HM625700HM625701HM625702HM625703HM625704HM625705HM625706HM625707HM625708HM625709HM625710HM625711.
References
- 1.Jemal A., Siegel R., Ward E., Hao Y., Xu J., Thun M.J. Cancer statistics, 2009. CA Cancer J. Clin. 2009;59:225–249. doi: 10.3322/caac.20006. [DOI] [PubMed] [Google Scholar]
- 2.La Vecchia C., Bosetti C., Lucchini F., Bertuccio P., Negri E., Boyle P., Levi F. Cancer mortality in Europe, 2000-2004, and an overview of trends since 1975. Ann. Oncol. 2010;21:1323–1360. doi: 10.1093/annonc/mdp530. [DOI] [PubMed] [Google Scholar]
- 3.Gudmundsson J., Sulem P., Manolescu A., Amundadottir L.T., Gudbjartsson D., Helgason A., Rafnar T., Bergthorsson J.T., Agnarsson B.A., Baker A. Genome-wide association study identifies a second prostate cancer susceptibility variant at 8q24. Nat. Genet. 2007;39:631–637. doi: 10.1038/ng1999. [DOI] [PubMed] [Google Scholar]
- 4.Yeager M., Orr N., Hayes R.B., Jacobs K.B., Kraft P., Wacholder S., Minichiello M.J., Fearnhead P., Yu K., Chatterjee N. Genome-wide association study of prostate cancer identifies a second risk locus at 8q24. Nat. Genet. 2007;39:645–649. doi: 10.1038/ng2022. [DOI] [PubMed] [Google Scholar]
- 5.Gudmundsson J., Sulem P., Gudbjartsson D.F., Blondal T., Gylfason A., Agnarsson B.A., Benediktsdottir K.R., Magnusdottir D.N., Orlygsdottir G., Jakobsdottir M. Genome-wide association and replication studies identify four variants associated with prostate cancer susceptibility. Nat. Genet. 2009;41:1122–1126. doi: 10.1038/ng.448. [DOI] [PMC free article] [PubMed] [Google Scholar]
- 6.Eeles R.A., Kote-Jarai Z., Giles G.G., Olama A.A., Guy M., Jugurnauth S.K., Mulholland S., Leongamornlert D.A., Edwards S.M., Morrison J., UK Genetic Prostate Cancer Study Collaborators. British Association of Urological Surgeons' Section of Oncology. UK ProtecT Study Collaborators Multiple newly identified loci associated with prostate cancer susceptibility. Nat. Genet. 2008;40:316–321. doi: 10.1038/ng.90. [DOI] [PubMed] [Google Scholar]
- 7.Thomas G., Jacobs K.B., Yeager M., Kraft P., Wacholder S., Orr N., Yu K., Chatterjee N., Welch R., Hutchinson A. Multiple loci identified in a genome-wide association study of prostate cancer. Nat. Genet. 2008;40:310–315. doi: 10.1038/ng.91. [DOI] [PubMed] [Google Scholar]
- 8.Shutt T.E., Shadel G.S. A compendium of human mitochondrial gene expression machinery with links to disease. Environ. Mol. Mutagen. 2010;51:360–379. doi: 10.1002/em.20571. [DOI] [PMC free article] [PubMed] [Google Scholar]
- 9.Riemer J., Bulleid N., Herrmann J.M. Disulfide formation in the ER and mitochondria: two solutions to a common process. Science. 2009;324:1284–1287. doi: 10.1126/science.1170653. [DOI] [PubMed] [Google Scholar]
- 10.Soares P., Ermini L., Thomson N., Mormina M., Rito T., Röhl A., Salas A., Oppenheimer S., Macaulay V., Richards M.B. Correcting for purifying selection: an improved human mitochondrial molecular clock. Am. J. Hum. Genet. 2009;84:740–759. doi: 10.1016/j.ajhg.2009.05.001. [DOI] [PMC free article] [PubMed] [Google Scholar]
- 11.Parr R.L., Dakubo G.D., Thayer R.E., McKenney K., Birch-Machin M.A. Mitochondrial DNA as a potential tool for early cancer detection. Hum. Genomics. 2006;2:252–257. doi: 10.1186/1479-7364-2-4-252. [DOI] [PMC free article] [PubMed] [Google Scholar]
- 12.Maki J., Robinson K., Reguly B., Alexander J., Wittock R., Aguirre A., Diamandis E.P., Escott N., Skehan A., Prowse O. Mitochondrial genome deletion aids in the identification of false- and true-negative prostate needle core biopsy specimens. Am. J. Clin. Pathol. 2008;129:57–66. doi: 10.1309/UJJTH4HFEPWAQ78Q. [DOI] [PubMed] [Google Scholar]
- 13.Gómez-Zaera M., Abril J., González L., Aguiló F., Condom E., Nadal M., Nunes V. Identification of somatic and germline mitochondrial DNA sequence variants in prostate cancer patients. Mutat. Res. 2006;595:42–51. doi: 10.1016/j.mrfmmm.2005.10.012. [DOI] [PubMed] [Google Scholar]
- 14.Chen J.Z., Gokden N., Greene G.F., Mukunyadzi P., Kadlubar F.F. Extensive somatic mitochondrial mutations in primary prostate cancer using laser capture microdissection. Cancer Res. 2002;62:6470–6474. [PubMed] [Google Scholar]
- 15.van Oven M., Kayser M. Updated comprehensive phylogenetic tree of global human mitochondrial DNA variation. Hum. Mutat. 2009;30:E386–E394. doi: 10.1002/humu.20921. [DOI] [PubMed] [Google Scholar]
- 16.Mosquera-Miguel A., Alvarez-Iglesias V., Carracedo A., Salas A., Vega A., Carracedo A., Milne R., de León A.C., Benitez J., Carracedo A., Salas A. Is mitochondrial DNA variation associated with sporadic breast cancer risk? Cancer Res. 2008;68:623–625. doi: 10.1158/0008-5472.CAN-07-2385. author reply 624. [DOI] [PubMed] [Google Scholar]
- 17.Mueller E.E., Eder W., Mayr J.A., Paulweber B., Sperl W., Horninger W., Klocker H., Kofler B. Mitochondrial haplogroups and control region polymorphisms are not associated with prostate cancer in Middle European Caucasians. PLoS ONE. 2009;4:e6370. doi: 10.1371/journal.pone.0006370. [DOI] [PMC free article] [PubMed] [Google Scholar]
- 18.Kim W., Yoo T.K., Shin D.J., Rho H.W., Jin H.J., Kim E.T., Bae Y.S. Mitochondrial DNA haplogroup analysis reveals no association between the common genetic lineages and prostate cancer in the Korean population. PLoS ONE. 2008;3:e2211. doi: 10.1371/journal.pone.0002211. [DOI] [PMC free article] [PubMed] [Google Scholar]
- 19.Booker L.M., Habermacher G.M., Jessie B.C., Sun Q.C., Baumann A.K., Amin M., Lim S.D., Fernandez-Golarz C., Lyles R.H., Brown M.D. North American white mitochondrial haplogroups in prostate and renal cancer. J. Urol. 2006;175:468–472. doi: 10.1016/S0022-5347(05)00163-1. discussion 472–473. [DOI] [PubMed] [Google Scholar]
- 20.Petros J.A., Baumann A.K., Ruiz-Pesini E., Amin M.B., Sun C.Q., Hall J., Lim S., Issa M.M., Flanders W.D., Hosseini S.H. mtDNA mutations increase tumorigenicity in prostate cancer. Proc. Natl. Acad. Sci. USA. 2005;102:719–724. doi: 10.1073/pnas.0408894102. [DOI] [PMC free article] [PubMed] [Google Scholar]
- 21.Jerónimo C., Nomoto S., Caballero O.L., Usadel H., Henrique R., Varzim G., Oliveira J., Lopes C., Fliss M.S., Sidransky D. Mitochondrial mutations in early stage prostate cancer and bodily fluids. Oncogene. 2001;20:5195–5198. doi: 10.1038/sj.onc.1204646. [DOI] [PubMed] [Google Scholar]
- 22.Parr R.L., Dakubo G.D., Crandall K.A., Maki J., Reguly B., Aguirre A., Wittock R., Robinson K., Alexander J.S., Birch-Machin M.A. Somatic mitochondrial DNA mutations in prostate cancer and normal appearing adjacent glands in comparison to age-matched prostate samples without malignant histology. J. Mol. Diagn. 2006;8:312–319. doi: 10.2353/jmoldx.2006.050112. [DOI] [PMC free article] [PubMed] [Google Scholar]
- 23.Salas A., Yao Y.G., Macaulay V., Vega A., Carracedo A., Bandelt H.-J. A critical reassessment of the role of mitochondria in tumorigenesis. PLoS Med. 2005;2:e296. doi: 10.1371/journal.pmed.0020296. [DOI] [PMC free article] [PubMed] [Google Scholar]
- 24.Sobin L.H., Gospodarowicz M.K., Wittekind C.H., editors. TNM Classification of Malignant Tumours. Seventh Edition. John Wiley & Sons; Hoboken, NJ: 2002. [Google Scholar]
- 25.Epstein J.I., Walsh P.C., Carmichael M., Brendler C.B. Pathologic and clinical findings to predict tumor extent of nonpalpable (stage T1c) prostate cancer. JAMA. 1994;271:368–374. [PubMed] [Google Scholar]
- 26.Weinstein M.H., Signoretti S., Loda M. Diagnostic utility of immunohistochemical staining for p63, a sensitive marker of prostatic basal cells. Mod. Pathol. 2002;15:1302–1308. doi: 10.1097/01.MP.0000038460.95912.6E. [DOI] [PubMed] [Google Scholar]
- 27.Gonder M.K., Mortensen H.M., Reed F.A., de Sousa A., Tishkoff S.A. Whole-mtDNA genome sequence analysis of ancient African lineages. Mol. Biol. Evol. 2007;24:757–768. doi: 10.1093/molbev/msl209. [DOI] [PubMed] [Google Scholar]
- 28.Fendt L., Zimmermann B., Daniaux M., Parson W. Sequencing strategy for the whole mitochondrial genome resulting in high quality sequences. BMC Genomics. 2009;10:139. doi: 10.1186/1471-2164-10-139. [DOI] [PMC free article] [PubMed] [Google Scholar]
- 29.Coble M.D., Just R.S., O'Callaghan J.E., Letmanyi I.H., Peterson C.T., Irwin J.A., Parsons T.J. Single nucleotide polymorphisms over the entire mtDNA genome that increase the power of forensic testing in Caucasians. Int. J. Legal Med. 2004;118:137–146. doi: 10.1007/s00414-004-0427-6. [DOI] [PubMed] [Google Scholar]
- 30.Brandstätter A., Niederstätter H., Pavlic M., Grubwieser P., Parson W. Generating population data for the EMPOP database - an overview of the mtDNA sequencing and data evaluation processes considering 273 Austrian control region sequences as example. Forensic Sci. Int. 2007;166:164–175. doi: 10.1016/j.forsciint.2006.05.006. [DOI] [PubMed] [Google Scholar]
- 31.Bannwarth S., Procaccio V., Paquis-Flucklinger V. Rapid identification of unknown heteroplasmic mutations across the entire human mitochondrial genome with mismatch-specific Surveyor Nuclease. Nat. Protoc. 2006;1:2037–2047. doi: 10.1038/nprot.2006.318. [DOI] [PubMed] [Google Scholar]
- 32.Brandstätter A., Salas A., Niederstätter H., Gassner C., Carracedo A., Parson W. Dissection of mitochondrial superhaplogroup H using coding region SNPs. Electrophoresis. 2006;27:2541–2550. doi: 10.1002/elps.200500772. [DOI] [PubMed] [Google Scholar]
- 33.Palanichamy M.G., Sun C., Agrawal S., Bandelt H.-J., Kong Q.-P., Khan F., Wang C.-Y., Chaudhuri T.K., Palla V., Zhang Y.-P. Phylogeny of mitochondrial DNA macrohaplogroup N in India, based on complete sequencing: implications for the peopling of South Asia. Am. J. Hum. Genet. 2004;75:966–978. doi: 10.1086/425871. [DOI] [PMC free article] [PubMed] [Google Scholar]
- 34.Brandstätter A., Parsons T.J., Parson W. Rapid screening of mtDNA coding region SNPs for the identification of west European Caucasian haplogroups. Int. J. Legal Med. 2003;117:291–298. doi: 10.1007/s00414-003-0395-2. [DOI] [PubMed] [Google Scholar]
- 35.Andrews R.M., Kubacka I., Chinnery P.F., Lightowlers R.N., Turnbull D.M., Howell N. Reanalysis and revision of the Cambridge reference sequence for human mitochondrial DNA. Nat. Genet. 1999;23:147. doi: 10.1038/13779. [DOI] [PubMed] [Google Scholar]
- 36.Brandstätter A., Niederstätter H., Parson W. Monitoring the inheritance of heteroplasmy by computer-assisted detection of mixed basecalls in the entire human mitochondrial DNA control region. Int. J. Legal Med. 2004;118:47–54. doi: 10.1007/s00414-003-0418-z. [DOI] [PubMed] [Google Scholar]
- 37.Schönherr S., Weissensteiner H., Coassin S., Specht G., Kronenberg F., Brandstätter A. eCOMPAGT — efficient combination and management of phenotypes and genotypes for genetic epidemiology. BMC Bioinformatics. 2009;10:139. doi: 10.1186/1471-2105-10-139. [DOI] [PMC free article] [PubMed] [Google Scholar]
- 38.Weissensteiner H., Schönherr S., Specht G., Kronenberg F., Brandstätter A. eCOMPAGT integrates mtDNA: import, validation and export of mitochondrial DNA profiles for population genetics, tumour dynamics and genotype-phenotype association studies. BMC Bioinformatics. 2010;11:122. doi: 10.1186/1471-2105-11-122. [DOI] [PMC free article] [PubMed] [Google Scholar]
- 39.Kloss-Brandstätter A., Pacher D., Schönherr S., Weissensteiner H., Binna R., Specht G., Kronenberg F. HaploGrep: a fast and reliable algorithm for automatic classification of mitochondrial DNA haplogroups. Hum. Mutat. 2010 doi: 10.1002/humu.21382. in press. Published online October 19, 2010. [DOI] [PubMed] [Google Scholar]
- 40.Coassin S., Brandstätter A., Kronenberg F. Lost in the space of bioinformatic tools: a constantly updated survival guide for genetic epidemiology. The GenEpi Toolbox. Atherosclerosis. 2010;209:321–335. doi: 10.1016/j.atherosclerosis.2009.10.026. [DOI] [PubMed] [Google Scholar]
- 41.Sunyaev S., Ramensky V., Koch I., Lathe W., 3rd, Kondrashov A.S., Bork P. Prediction of deleterious human alleles. Hum. Mol. Genet. 2001;10:591–597. doi: 10.1093/hmg/10.6.591. [DOI] [PubMed] [Google Scholar]
- 42.Ng P.C., Henikoff S. SIFT: Predicting amino acid changes that affect protein function. Nucleic Acids Res. 2003;31:3812–3814. doi: 10.1093/nar/gkg509. [DOI] [PMC free article] [PubMed] [Google Scholar]
- 43.Ferrer-Costa C., Gelpí J.L., Zamakola L., Parraga I., de la Cruz X., Orozco M. PMUT: a web-based tool for the annotation of pathological mutations on proteins. Bioinformatics. 2005;21:3176–3178. doi: 10.1093/bioinformatics/bti486. [DOI] [PubMed] [Google Scholar]
- 44.Pütz J., Dupuis B., Sissler M., Florentz C. Mamit-tRNA, a database of mammalian mitochondrial tRNA primary and secondary structures. RNA. 2007;13:1184–1190. doi: 10.1261/rna.588407. [DOI] [PMC free article] [PubMed] [Google Scholar]
- 45.Noller H.F., Green R., Heilek G., Hoffarth V., Hüttenhofer A., Joseph S., Lee I., Lieberman K., Mankin A., Merryman C. Structure and function of ribosomal RNA. Biochem. Cell Biol. 1995;73:997–1009. doi: 10.1139/o95-107. [DOI] [PubMed] [Google Scholar]
- 46.Pereira L., Freitas F., Fernandes V., Pereira J.B., Costa M.D., Costa S., Máximo V., Macaulay V., Rocha R., Samuels D.C. The diversity present in 5140 human mitochondrial genomes. Am. J. Hum. Genet. 2009;84:628–640. doi: 10.1016/j.ajhg.2009.04.013. [DOI] [PMC free article] [PubMed] [Google Scholar]
- 47.Clementi N., Polacek N. Ribosome-associated GTPases: The role of RNA for GTPase activation. RNA Biol. 2010;7:1–7. doi: 10.4161/rna.7.5.12467. [DOI] [PubMed] [Google Scholar]
- 48.Santos C., Martínez M., Lima M., Hao Y.J., Simões N., Montiel R. Mitochondrial DNA mutations in cancer: a review. Curr. Top. Med. Chem. 2008;8:1351–1366. doi: 10.2174/156802608786141151. [DOI] [PubMed] [Google Scholar]
- 49.Hung W.Y., Wu C.W., Yin P.H., Chang C.J., Li A.F., Chi C.W., Wei Y.H., Lee H.C. Somatic mutations in mitochondrial genome and their potential roles in the progression of human gastric cancer. Biochim. Biophys. Acta. 2010;1800:264–270. doi: 10.1016/j.bbagen.2009.06.006. [DOI] [PubMed] [Google Scholar]
- 50.Abril J., de Heredia M.L., González L., Clèries R., Nadal M., Condom E., Aguiló F., Gómez-Zaera M., Nunes V. Altered expression of 12S/MT-RNR1, MT-CO2/COX2, and MT-ATP6 mitochondrial genes in prostate cancer. Prostate. 2008;68:1086–1096. doi: 10.1002/pros.20771. [DOI] [PubMed] [Google Scholar]
- 51.Ishikawa K., Takenaga K., Akimoto M., Koshikawa N., Yamaguchi A., Imanishi H., Nakada K., Honma Y., Hayashi J.-I. ROS-generating mitochondrial DNA mutations can regulate tumor cell metastasis. Science. 2008;320:661–664. doi: 10.1126/science.1156906. [DOI] [PubMed] [Google Scholar]
- 52.Arnold R.S., Sun C.Q., Richards J.C., Grigoriev G., Coleman I.M., Nelson P.S., Hsieh C.L., Lee J.K., Xu Z., Rogatko A. Mitochondrial DNA mutation stimulates prostate cancer growth in bone stromal environment. Prostate. 2009;69:1–11. doi: 10.1002/pros.20854. [DOI] [PMC free article] [PubMed] [Google Scholar]
- 53.Mizumachi T., Muskhelishvili L., Naito A., Furusawa J., Fan C.Y., Siegel E.R., Kadlubar F.F., Kumar U., Higuchi M. Increased distributional variance of mitochondrial DNA content associated with prostate cancer cells as compared with normal prostate cells. Prostate. 2008;68:408–417. doi: 10.1002/pros.20697. [DOI] [PMC free article] [PubMed] [Google Scholar]
- 54.Stafford P., Chen-Quin E.B. The pattern of natural selection in somatic cancer mutations of human mtDNA. J. Hum. Genet. 2010;55:605–612. doi: 10.1038/jhg.2010.76. [DOI] [PubMed] [Google Scholar]
- 55.Helm M., Brulé H., Friede D., Giegé R., Pütz D., Florentz C. Search for characteristic structural features of mammalian mitochondrial tRNAs. RNA. 2000;6:1356–1379. doi: 10.1017/s1355838200001047. [DOI] [PMC free article] [PubMed] [Google Scholar]
- 56.Seligmann H. Mitochondrial tRNAs as light strand replication origins: similarity between anticodon loops and the loop of the light strand replication origin predicts initiation of DNA replication. Biosystems. 2010;99:85–93. doi: 10.1016/j.biosystems.2009.09.003. [DOI] [PubMed] [Google Scholar]
- 57.Brandstätter A., Parson W. Mitochondrial DNA heteroplasmy or artefacts—a matter of the amplification strategy? Int. J. Legal Med. 2003;117:180–184. doi: 10.1007/s00414-002-0350-7. [DOI] [PubMed] [Google Scholar]
- 58.Li M., Schönberg A., Schaefer M., Schroeder R., Nasidze I., Stoneking M. Detecting heteroplasmy from high-throughput sequencing of complete human mitochondrial DNA genomes. Am. J. Hum. Genet. 2010;87:237–249. doi: 10.1016/j.ajhg.2010.07.014. [DOI] [PMC free article] [PubMed] [Google Scholar]
Associated Data
This section collects any data citations, data availability statements, or supplementary materials included in this article.