

Abstract
Recent studies suggest progranulin (GRN) is a neurotrophic factor. Loss-of-function mutations in the progranulin gene (GRN) cause frontotemporal lobar degeneration (FTLD), a progressive neurodegenerative disease affecting ∼10% of early-onset dementia patients. Using an enzyme-linked immunosorbent assay, we previously showed that GRN is detectable in human plasma and can be used to predict GRN mutation status. This study also showed a wide range in plasma GRN levels in non-GRN mutation carriers, including controls. We have now performed a genome-wide association study of 313,504 single-nucleotide polymorphisms (SNPs) in 533 control samples and identified on chromosome 1p13.3 two SNPs with genome-wide significant association with plasma GRN levels (top SNP rs646776; p = 1.7 × 10⁻³⁰). The association of rs646776 with plasma GRN levels was replicated in two independent series of 508 controls (p = 1.9 × 10⁻¹⁹) and 197 FTLD patients (p = 6.4 × 10⁻¹²). Overall, each copy of the minor C allele decreased GRN levels by ∼15%. SNP rs646776 is located near sortilin (SORT1), and the minor C allele of rs646776 was previously associated with increased SORT1 mRNA levels. Supporting these findings, overexpression of SORT1 in cultured HeLa cells dramatically reduced GRN levels in the conditioned media, whereas knockdown of SORT1 increased extracellular GRN levels. In summary, we identified significant association of a locus on chromosome 1p13.3 with plasma GRN levels through an unbiased genome-wide screening approach and implicated SORT1 as an important regulator of GRN levels. This finding opens avenues for future research into GRN biology and the pathophysiology of neurodegenerative diseases.
Main Text
Progranulin (GRN) is a secreted growth factor expressed in a variety of tissues and has many important cellular functions, including the regulation of early embryogenesis, wound repair, inflammation, and tumor formation.1 Recently, a novel role for GRN was suggested in the field of neurobiology when we identified loss-of-function mutations in the progranulin gene (GRN [MIM 138945]) as a major cause of frontotemporal lobar degeneration (FTLD [MIM 607485]).2,3
The term FTLD encompasses several different neurodegenerative diseases characterized by atrophy of the frontal and temporal lobes of the brain.4 The clinical symptoms associated with FTLD are also diverse and include behavior and personality changes, language disorders of expression and comprehension, cognitive impairment, and sometimes an extrapyramidal movement disorder or motor-neuron disease.5 To date, there is no approved disease-modifying drug or cure for FTLD, and pharmacological treatment is predominantly aimed at the management of symptoms such as difficult behaviors and cognitive impairment.6
Since the identification of mutations in GRN in 2006, more than 65 different loss-of-function mutations in GRN have been identified in 226 families affected by dementia worldwide (FTD mutation database),7 and considerable progress has been made toward the study GRN's role in neurodegeneration. In vitro and in vivo functional studies now suggest that GRN is a neurotrophic factor involved in maintaining neuronal function during aging.8–11 In this respect, it is interesting that a number of potentially pathogenic GRN missense mutations have also been identified in patients affected by neurodegenerative diseases other than FTLD; such diseases includeAlzheimer disease (AD [MIM 104300]),12 amyotrophic lateral sclerosis (ALS [MIM 105400]),13 and Parkinson disease (MIM 168600).14 In addition, common genetic variants in GRN have been associated with an increased risk for disease in clinical AD series12,15 and a reduced survival in patients with ALS.13 These findings suggest that a partial loss of GRN function could also contribute to the neurodegenerative disease process in dementias other than FTLD.16
Using an enzyme-linked immunosorbent assay (ELISA), we and others recently reported that GRN is detectable in plasma,17,18 serum,19,20 and cerebrospinal fluid10,18 (CSF). In plasma samples from a large cohort of Mayo Clinic Jacksonville FTLD patients and controls, we showed significantly reduced levels of GRN in both symptomatic and asymptomatic GRN-mutation carriers compared to FTLD patients without GRN mutations and controls.17 These results indicated that plasma GRN levels are a reliable biomarker for the detection of GRN mutations. Our analysis also indicated a wide range in plasma GRN levels, even in healthy controls, suggesting that other genetic and environmental factors play a role in regulating plasma GRN levels. However, with the exception of genetic variants in GRN, no other genetic loci affecting GRN levels are currently known.
To identify genetic loci that influence plasma GRN levels and to further aid in our general understanding of GRN biology, we undertook a genome-wide association study (GWAS) of plasma GRN levels in a large cohort of healthy controls. The identification of factors that could increase the amount of GRN available to cells is important and could form the basis for future disease-modifying therapies for FTLD and related neurodegenerative diseases.
Subjects included in the GWAS cohort consisted of 533 healthy non-Hispanic white controls (Table 1), who had been genotyped previously with Illumina HumanHap300 BeadChips as part of a GWAS that aimed to identify genes for late-onset AD.21 All samples included in this study met quality-control measures described in the AD GWAS publication.21 In addition, genotype clusters for the top 30 single-nucleotide polymorphisms (SNPs) with the most significant p values in our GWAS were visually inspected, and all SNPs were found to have satisfactory clusters. We measured plasma GRN levels by using the Human Progranulin Quantikine ELISA Kit (R&D Systems) and undiluted plasma samples. To increase accuracy, we analyzed all samples in duplicate. Readings from duplicate samples with a coefficient of variation > 21.06% (n = 15) were excluded from further analysis. Known concentrations of recombinant human GRN provided with the ELISA kit were used as a standard. We used linear mixed-effects models with natural logarithms of measured GRN levels, including levels of six inter-plate control samples, to estimate plate effects and to subtract these plate effects so as to obtain GRN levels adjusted for plate-plate variation for subsequent analysis. All analyses of GRN levels used logarithms because of the skewed nature of the distributions, and also because the log scale is more natural for estimating the n-fold change.
Table 1.
Cohort Description
| Cohort | N | Agea(yr) | Females (%) | Sample Source (N Samples) |
|---|---|---|---|---|
| GWAS | 533 | 73.1 ± 4.3 | 61.2 | Mayo Clinic Jacksonville (266) |
| Mayo Clinic Rochester (267) | ||||
| Replication | 508 | 77.8 ± 7.5 | 57.9 | Mayo Clinic Jacksonville (508) |
| FTLD | 197 | 67.4 ± 8.2 | 50.3 | Mayo Clinic Jacksonville (197) |
| eQTL | 359 | 51.2 ± 26.1 | 34.0 | University of Maryland Brain Bank (228) |
| Johns Hopkins University Brain Bank (36) | ||||
| University of Miami Brain Bank (17) | ||||
| Sun Health Brain Bank (78) |
One of the most common causes of death in the eQTL cohort was multiple injuries, explaining the relatively young mean age at death in this cohort. Subjects included in the GWAS, replication, and eQTL cohorts were healthy non-Hispanic white individuals in whom a clinical history of neurological or cerebrovascular disease was excluded, as was a diagnosis of cognitive impairment. The ethnicity of the FTLD cohort was 98% non-Hispanic white individuals, 1% Hispanic white individuals, and 1% Asian individuals. Subjects from all cohorts agreed to be in the study and biological samples were obtained after informed consent with ethical committee approval from the respective institutions.
Age is shown as the mean ± standard deviation. Provided are the age at blood draw of the subjects included in the GWAS, replication, and FTLD cohorts and the age at death of subjects included in the eQTL cohort.
We used linear-regression analyses in PLINK to test for association between plasma GRN levels (by using the natural log of the average, adjusted concentration) and the 313,504 GWAS SNPs that met genotype quality control. We used an additive model for each SNP (0, 1, or 2 minor alleles) and included age at blood draw, series (Mayo Clinic Jacksonville and Mayo Clinic Rochester), and sex as additional covariates. Two SNPs, rs646776 and rs611917, located in the same chromosomal region at 1p13.3, showed genome-wide significant association with plasma GRN levels (Table 2). The SNP with the most significant p value, rs646776 (p = 1.7 × 10⁻³⁰), is located in a small linkage disequilibrium (LD) block containing two genes: cadherin EGF LAG seven-pass G-type receptor 2 (CELSR2 [MIM 604265]) and proline/serine-rich coiled-coil 1 (PSRC1 [MIM 613126]). This SNP was previously shown to associate with mRNA expression levels of CELSR2, PSRC1, and sortilin 1 (SORT1 [MIM 602458]), which is located in an adjacent LD block at chromosome 1p13.3 (Figure 1).22,23 In the GWAS cohort, each copy of the minor C allele of rs646776 decreased plasma GRN levels by ∼16% (Figure S1 available online).
Table 2.
SNPs Significantly Associated with Plasma GRN Levels
| rs Number | Position (NCBI Build 36) | Minor Allele | MAF |
GWAS Cohort (N = 518) |
Replication Cohort (N = 495) |
||||
|---|---|---|---|---|---|---|---|---|---|
| Beta | SE | p Value | Beta | SE | p Value | ||||
| rs646776 | chr1:109,620,053 | G | 0.21 | −0.18 | 0.01 | 1.7 × 10⁻³⁰ | −0.14 | 0.02 | 1.0 × 10⁻¹⁹ |
| age | 0.00 | 0.00 | 0.36 | 0.00 | 0.00 | 0.79 | |||
| series | −0.01 | 0.02 | 0.58 | ||||||
| sex | 0.07 | 0.02 | 8.9 × 10⁻⁵ | 0.09 | 0.02 | 1.7 × 10⁻⁶ | |||
| rs611917 | chr1:109,616,775 | C | 0.30 | −0.10 | 0.01 | 5.1 × 10⁻¹³ | −0.08 | 0.01 | 2.3 × 10−08 |
| age | 0.00 | 0.00 | 0.29 | 0.00 | 0.00 | 0.77 | |||
| series | −0.01 | 0.02 | 0.49 | ||||||
| sex | 0.07 | 0.02 | 2.3 × 10⁻⁴ | 0.09 | 0.02 | 2.1 × 10⁻⁶ | |||
| rs17586966 | chr1:109,757,092 | C | 0.06 | −0.10 | 0.02 | 7.7 × 10−05 | −0.12 | 0.03 | 1.3 × 10−04 |
| age | 0.00 | 0.00 | 0.31 | 0.00 | 0.00 | 0.69 | |||
| series | 0.00 | 0.02 | 0.83 | ||||||
| sex | 0.08 | 0.02 | 7.8 × 10⁻⁵ | 0.09 | 0.02 | 9.9 × 10⁻⁶ | |||
The estimated effect (beta) and its standard error (SE) as well as the unadjusted p values are shown for the two SNPs (rs646776 and rs611917) that achieved genome wide-significance in the GWAS and for one additional SNP (rs17586966) that reached genome-wide significance when the GWAS and replication cohorts were combined (p = 3.2 × 10⁻⁸). The beta, SE, and p value are also shown for each of the covariates that were included in the linear-regression analyses: age at blood draw, series (only in the GWAS), and sex. Whereas the GWAS cohort consisted of samples from the Mayo Clinic Jacksonville and the Mayo Clinic Rochester, all the samples in the replication cohort came from the Mayo Clinic Jacksonville; therefore, series was not included as a covariate in the linear-regression analysis of the replication cohort. With a global significance threshold of α = 0.05, a Bonferroni correction for the 313,504 SNPs tested required a p value of 1.6 × 10⁻⁷ for genome-wide significance. MAF = minor allele frequency.
Figure 1.
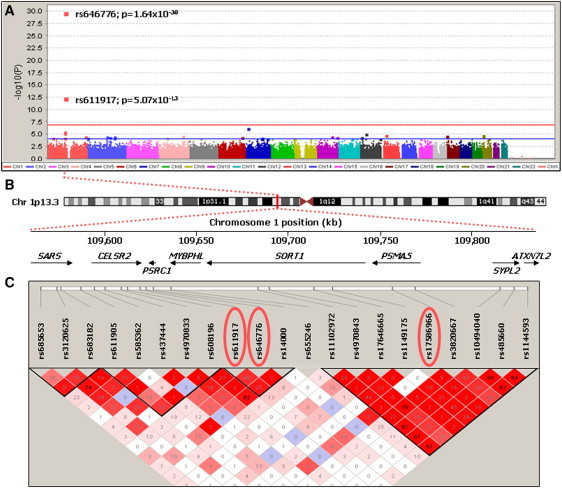
p Values for Association with Plasma GRN Levels in the Genome-wide Association Study with Genetic Architecture of the Associated Region
(A) Association results by chromosome. The –log10 of the p value is shown for genotyped SNPs (squares). The red horizontal line indicates the Bonferroni threshold of p = 1.6 × 10⁻⁷, and the blue horizontal line indicates an arbitrarily chosen threshold for suggestive association of p < 1.0 × 10⁻⁴.
(B) Schematic of chromosome 1 with genomic positions of genes within the associated region at chromosome 1p13.3. SARS = seryl-tRNA synthetase, CELSR2 = cadherin EGF LAG seven-pass G-type receptor 2, PSRC1 = proline/serine-rich coiled-coil 1, MYBPHL = myosin binding protein H-like, SORT1 = sortilin, PSMA5 = proteasome subunit, alpha-type 5, SYPL2 = synaptophysin-like 2, and ATXN7L2 = ataxin 7-like 2.
(C) Linkage disequilibrium plot (Haploview 4.0, solid-spine haplotype block definition, r2 values with D′ color scheme) of the region encompassing the three SNPs (circled in red) that showed genome-wide significant association with plasma GRN levels in the combined GWAS and replication cohort.
To replicate these findings, we selected the two genome-wide significant SNPs and the top 28 additional SNPs that had nominal significant association with plasma GRN levels at p < 1 × 10⁻⁴ for genotyping in our replication cohort. This cohort consisted of 508 additional healthy non-Hispanic white controls (Table 1), and we performed genotyping with SEQUENOM's MassArray iPLEX technology according to the manufacturer's instructions. Plasma GRN levels were quantified with the Human Progranulin Quantikine ELISA Kit (R&D Systems) as described for the GWAS cohort, and duplicate readings were taken for 495 samples passing quality control. We performed linear-regression analyses in PLINK to test for association between plasma GRN levels (by using the natural log of the average, adjusted concentration) and the 30 SNPs by using an additive model with age at blood draw and sex as covariates.24 In this cohort, rs646776 (p = 1.9 × 10⁻¹⁹) and rs611917 (p = 2.3 × 10⁻⁸) were also significantly associated with plasma GRN levels; there was a decrease of ∼13% in plasma GRN levels for each copy of the minor allele of rs646776 (Table 2, Figure S1). Among the other 28 SNPs included in the replication analysis, one additional SNP, rs17586966, also located at chromosome 1p13.3 and in moderate LD with rs646776 (D′ = 0.76; r2 = 0.16), showed significant association in the replication cohort (p = 1.3 × 10⁻⁴), further confirming the importance of this chromosomal region in GRN regulation in plasma (Table 2, Table S2). Finally, Taqman SNP genotyping of rs646776 in a third cohort consisting of Mayo Clinic FTLD patients who did not have GRN mutations and for whom plasma GRN levels had previously been generated (Table 1)17 also showed highly significant association (beta = −0.18, SE = 0.02, p = 6.4 × 10⁻¹²) according to linear-regression analysis corrected for age and sex. Moreover, although plasma GRN levels were reduced by at least 50% in all FTLD patients with GRN mutations when these patients were compared to non-GRN mutation carriers and controls,17 lower plasma GRN levels were observed in GRN-mutation carriers who had one copy as opposed to zero copies of the rs646776 C allele (CT: 11.4 ± 3.7 ng/ml, n = 4; TT: 18.0 ± 6.3 ng/ml, n = 12; R&D Systems ELISA).
Both the GWAS and the replication cohorts also showed a significant association between plasma GRN levels and sex, demonstrating consistently higher plasma GRN levels in females than in males (GWAS cohort: beta = 0.07, SE = 0.02, p = 2 × 10⁻⁴. Replication cohort: beta = 0.09, SE = 0.02, p < 1 × 10⁻⁴). No significant association between plasma GRN levels and age was observed (GWAS cohort p = 0.20, replication cohort p = 0.69). When the coefficient of determination (r2) was used for estimating the proportion of variance in log plasma GRN levels explained by the rs646776 genotype in the additive regression model that includes age at draw, series, and sex as covariates, only ∼0.3% of the variance in plasma GRN levels was explained by age at draw, series heterogeneity, or sex; when rs646776 was included, an additional ∼21.4% was explained.
The minor C allele of rs646776, the most significantly associated SNP identified in this study, was previously shown to correlate with increased mRNA expression levels of multiple genes in the chromosome 1p13.3 region. Two independent groups reported significant association of liver transcript levels of CELSR2, PSRC1, and SORT1 with the strongest regulatory effect observed for SORT1 mRNA.22,23 SORT1 is known to be highly expressed in multiple cells, including neurons within the brain, and has important physiological roles, including acting as a receptor for neuromediators and growth factors.25,26 These findings led us to hypothesize that SORT1 could be involved in the regulation of GRN and prompted us to model the functional effects of SORT1 overexpression and knockdown on GRN levels in cell culture. First, we overexpressed full-length SORT1 in HeLa cells, selected for their high levels of endogenous GRN expression, and measured endogenous GRN levels in the conditioned media and cell lysates by immunoblotting 5 days after transfection. SORT1-overexpressing cells showed a dramatic reduction in GRN levels in the conditioned media to 35% the levels of control transfected cells (p < 0.001) (Figures 2A and 2C). No significant changes were observed in the GRN levels in the cell lysates. We further confirmed these studies by using two different siRNAs targeting SORT1 to knockdown SORT1 prior to immunoblotting. Knockdown of SORT1 resulted in a significant 70%–80% increase in GRN levels in the conditioned media in comparison to cells transfected with a negative control siRNA (p < 0.001 for both SORT1 siRNAs) (Figures 2B and 2D), whereas GRN levels in the cell lysates were unchanged. Finally, we used a GRN ELISA to more accurately quantify the significant changes in extracellular levels of GRN resulting from the overexpression and knockdown of SORT1, which confirmed the immunoblot data (Figure S2).
Figure 2.
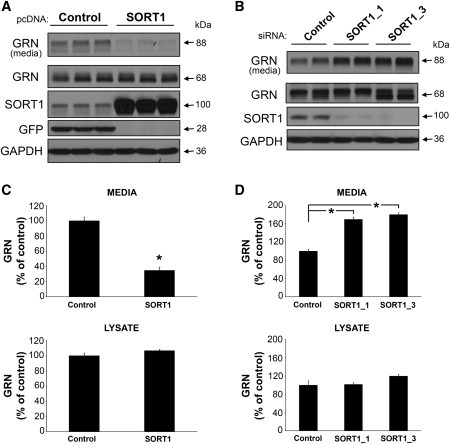
Changes in SORT1 Expression Alter the Amount of GRN in the Media of Cultured HeLa Cells
(A) Lipofectamine 2000 (Invitrogen) was used for transfection of HeLa cells at 60% confluency with 1 μg control vector (pCMV6-AC-mGFP; Origene) or SORT1 (pCMV6-XL5-SORT1; Origene) pcDNA. The media were replaced both 4 hr and 2 days after transfection before cells were harvested at 5 days. Lysates from these cells were prepared in radioactive immunoprecipitation assay (RIPA) buffer. Lysates and media from their corresponding wells were diluted with an equivalent volume of 2× Novex Tris-glycine sodium-dodecyl sulfate (SDS) sample buffer (Invitrogen), and equal volumes were run on SDS-polyacrylamide gels (Invitrogen), transferred to Immobilon membranes (Millipore), and immunoblotted. Antibodies were used against GRN (1:1000; Invitrogen), SORT1 (1:10,000; R&D Systems), or GFP (1:5000; Invitrogen). Using GAPDH (1:500,000; Meridian Life Sciences) ensured equal protein loading.
(B) HeLa cells cultured as described above were transfected with 5 nM negative-control siRNA (QIAGEN) or SORT1-specific (SORT1_1 or SORT1_3; QIAGEN) siRNAs via the HiPerFect transfection reagent (QIAGEN). After 2 days, the cells were retransfected with the same amount of siRNA and maintained for an additional 3 days before harvesting and immunoblotting took place as described above.
(C and D) Densitometric analysis of media and lysate GRN levels in HeLa cells transfected as described in (A) and (B), respectively, was done with an EPSON Expression 1680 flatbed scanner and ImageJ software. Values in the graphs represent the mean ± SEM of six independent experiments. Two-sample statistical analysis was performed with the two-sample Student's t test (C). Additionally, siRNA experiment data were analyzed with a one-way ANOVA followed by Tukey's HSD post hoc test (D). ∗Differs from control vector (C) or negative control siRNA (D); p < 0.001.
SORT1 is a member of the mammalian family of neuronal receptors defined by the unique vps10-domain that binds neurotrophic factors and neuropeptides.27,28 It is an endocytic and intracellular sorting receptor contributing to the targeting of ligands to lysosomes and the sorting between the golgi apparatus and the endosomes. SORT1 also engages in signaling by triggering neuronal apoptosis when forming a trimeric complex with the pro-domain of pro-neurotrophins and the p75 neurotrophic receptor.25,26,29 The mature SORT1 receptor binds various ligands, including neurotensin,30 the proforms of nerve growth factor-β,25 and brain-derived neurotrophic factor.29 On the basis of these known properties of SORT1, the significant effect of altered SORT1 levels on extracellular free GRN observed in our cell-culture studies would support either a direct or an indirect role for SORT1 in the secretory trafficking of GRN or in GRN endocytosis. In this regard, it is of interest that while our paper was in preparation, SORT1 was identified in an unbiased expression cloning screen as the principal neuronal binding site for GRN.31 According to this study, GRN binding to SORT1 on the cell surface is followed by rapid endocytosis and delivery of GRN to lysosomes. This study further showed that SORT1-mediated endocytosis of GRN is a major determinant of GRN levels in both intracellular and extracellular compartments, as demonstrated by a significant elevation of GRN in both serum and brains of mice lacking Sort1.31
The chromosomal region at 1p13.3, and rs646776 in particular, received increased attention recently when multiple studies identified strong association of this locus with elevated low-density lipoprotein (LDL) cholesterol levels in the blood and an increased risk for myocardial infarction in humans.32–36 In fact, this locus shows the strongest association with serum lipoproteins of any genetic locus in the genome. The association with LDL cholesterol levels in this region was recently explained by the identification of rs12740374, a proxy of rs646776 (r2 = 1.0), which alters the expression of SORT1 mRNA specifically in the liver (by binding to a SORT1 liver-specific transcription factor binding site) and thereby affects the secretion of very low-density lipoproteins by liver cells.23 These recent findings suggest that although rs646776 shows an effect on GRN levels in the periphery because of the regulation of SORT1 mRNA levels in the liver by its proxy rs12740374, it is unlikely that rs646776 will show association with brain expression levels of SORT1 mRNA. To address this question and to determine whether other SNPs at this locus are associated with SORT1 mRNA levels in the brain, we next performed an expression quantitative trait locus (eQTL) analysis by using cerebellum and frontal-cortex brain samples from 359 non-Hispanic white controls and 2,366 SNPs located in cis with SORT1, where cis is the region ±1 Mb from transcription start or end or within the gene (Table 1, Figure 3). Processing and analysis of the genotype and mRNA expression data was performed in a manner similar to methods previously described for a study including 150 of these 359 subjects37 (GEO accession number: GSE15745. dbGAP study accession number: phs000249.v1.p1). Genotyping was performed with DNA extracted from cerebellum tissue samples on the Illumina HumanHap550 v3, Human610-Quad v1, and Human660W-Quad v1 Infinium Beadchips. Subjects were filtered with PLINK on the basis of genotype checks including call rate, gender check, subject relatedness, and population-outlier status.24 We then imputed genotypes by using the CEU phased data from the March 2010 release of the 1000 Genomes Project using Mach.38,39 Expression profiling for mRNA transcripts was assayed via the Illumina HumanHT-12 v3 Expression Beadchip and normalized via cubic spline. The SORT1 expression 50-mer probe was checked for design issues with the ReMOAT tool.40 Subjects were also filtered on the basis of their overall expression profile; if an expression sample was found to be ±3 standard deviations from the tissue group mean in either detection rate or mean expression in either tissue, then the subject was removed. After filtering based on genotype and expression summary metrics, data for 322 subjects passed our quality control and were included in the analysis (Figure 3). The expression data for SORT1 were then adjusted for known covariates: age, sex, post-mortem interval, originating tissue bank, preparation/hybridization batch, and principal components 1 and 2 as determined from the identity-by-state pair-wise distances computed with PLINK for our subjects.24 The SORT1 eQTL analysis was then performed by linear regression of allele dosage and SORT1 expression with mach2qtl.38,39
Figure 3.
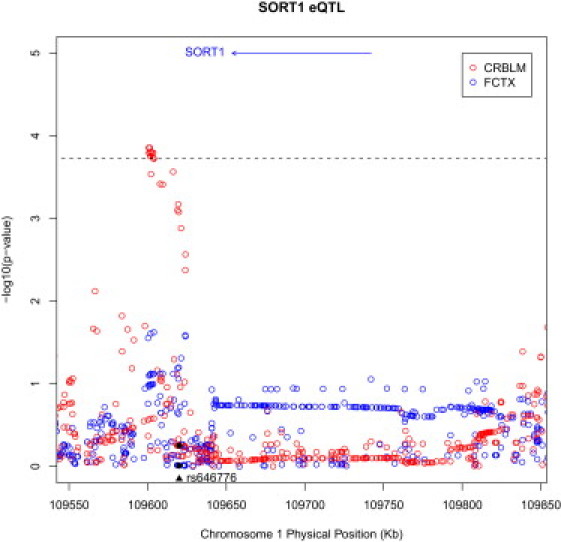
Correlation of Brain SORT1 mRNA Transcripts with Genotypes of SNPs Located within and Flanking SORT1
Manhattan plot for ∼290 kb region around SORT1 on chromosome 1 in cerebellum (red) and frontal cortex (blue). Correlation p values between SNPs and the SORT1 mRNA transcript are shown. Conservative Bonferroni correction based on all 2,366 tests performed within a tissue revealed that none of the SNPs reached the significance threshold of p = 2.1 × 10⁻⁵. We therefore applied a second less conservative correction on the basis of a false discovery rate (FDR)44 of 5% to test for suggestive association. This threshold was p = 4.4 × 10⁻⁴ and is indicated with a dashed line. The x axis represents the physical position for the region on the chromosome, and the y axis is the –log10 of the correlation p value. The relative position of the SORT1 transcript is drawn as a black arrow in the top portion of the plot. SNP rs646776, most significantly associated with GRN levels in plasma, is indicated with a black triangle in the bottom portion of the plot. The corresponding p values for this SNP in cerebellum (p = 0.56) and frontal cortex (p = 0.98) are indicated as black dots.
We did not detect a significant correlation between rs646776 genotypes and SORT1 mRNA levels in brain samples from either the cerebellum (p = 0.56) or frontal cortex (p = 0.98) (Figure 3). Because rs646776 is therefore unlikely to show an effect on levels of GRN in the brain, it is not surprising that rs646776 was not associated with an increased risk for FTLD-TDP in a recent GWAS study. However, correlation of SORT1 mRNA levels with genotypes for 2,366 SNPs located ± 1 Mb from the mRNA transcript start or end site of SORT1 did show suggestive association in cerebellum with 15 SNPs that were in strong LD and were located in an approximately 15 kb region about 50 kb upstream of SORT1 within intron 1 of CELSR2 (top SNP rs649281, p = 1.4 × 10⁻⁴; Figure 3 and Table S2). These genetic variants affecting SORT1 expression in the brain will be ideal candidates for future association studies aimed at the identification of genetic risk factors or disease modifiers in the development of FTLD and related disorders.
In recent months, much interest has focused on plasma GRN levels as both a surrogate marker for disease and as a disease risk factor.41 The assumption has been that factors associated with reduced levels of plasma GRN will increase the risk of developing FTLD, and this was in part the rationale for the current study design. Using a genome-wide association approach, we have now identified association of rs646776 with levels of GRN in human plasma. However, in contrast to the effect of GRN loss-of-function mutations, which affect GRN levels in every tissue and cell type, the effect of rs646776 on GRN presumably results from a liver-specific regulation of SORT1,23 and therefore it is unlikely that rs646776 will be associated with GRN levels in the brain. This also explains the lack of genetic association of rs646776 in the recent FTLD-TDP GWAS. Importantly, the finding that some factors might regulate GRN in a tissue- or organ-specific manner suggests that plasma GRN levels might not accurately reflect levels of GRN in the brain of an individual subject. This discrepancy offers a potential explanation for some of the previously published unexpected results, including the lack of correlation between plasma GRN levels and the onset age in families harboring GRN mutations and the absence of reduced plasma GRN levels in FTLD patient populations in general.17,20 In the future, a careful examination of the correlation between GRN levels in plasma and those in brain tissue or CSF is clearly warranted so that the utility of plasma GRN as a biomarker in FTLD can be determined.
With the exception of markers in the 1p13.3 chromosomal region near SORT1, our study did not identify other SNPs with significant association with plasma GRN levels in the GWAS and replication cohorts. The presence of additional, potentially rarer, functional variants not targeted by the SNPs used in this study or variants with smaller effect sizes for which our study might have been underpowered cannot, however, be excluded. More importantly, the current study does not exclude the possibility that in addition to SORT1, other transcripts coregulated by rs646776/rs12740374 at the chromosome 1p13.3 locus might also affect GRN regulation. Future in vitro functional analyses systematically targeting each of the other candidate proteins in this region will need to address this question. It also remains possible that there are other GRN regulators whose effects cannot be detected in human plasma. In fact, the percentage of cis eQTLs that show tissue specificity has now been suggested to be as high as 50%–90%.42,43 In this regard it is important to note that, in the future, our approach could be applied to other tissue types or biofluids, including CSF, which could lead to the identification of additional regulators of GRN and potential therapeutic targets for FTLD.
In conclusion, we have used an unbiased genetic approach to identify genes and proteins involved in the regulation of GRN and identified the multiligand receptor SORT1 as a major regulator of extracellular GRN levels. This finding opens avenues for future research into GRN biology and the pathophysiology of neurodegenerative diseases.
Acknowledgments
The authors wish to acknowledge and thank the families who contributed samples that were critically important to this study. This work was supported by the National Institutes of Health (grant numbers P50 AG16574 [Mayo Alzheimer's Disease Research Center, R.C.P. as PI; to R.R., N.R.G.-R., and S.G.Y.], U01 AG06576 [Mayo Alzheimer's Disease Patient Registry: R.C.P. as PI], R01 NS065782 [to R.R.], and R01 AG18023 [to N.R.G.-R. and S.G.Y.]).This project was also generously supported by the Consortium for Frontotemporal Dementia Research (to R.R.), the Robert and Clarice Smith Postdoctoral Fellowship (to M.M.C.), the Robert and Clarice Smith and Abigail Van Buren Alzheimer's Disease Research Program (to R.C.P., N.R.G.-R., and S.G.Y.), and the Palumbo Professorship in Alzheimer's Disease Research (to S.G.Y.). I.R.M. was supported by the Canadian Institutes of Health Research Operating (#74580) and the Pacific Alzheimer's Disease Research Foundation. This work was supported in part by the Intramural Research Program of the National Institute on Aging, National Institutes of Health, Department of Health and Human Services; project number ZIA AG000932-03.
Supplemental Data
Web Resources
The URLs for data presented herein are as follows:
1000 Genomes Project: http://1000genomes.org/
Alzheimer Disease & Frontotemporal Dementia Mutation Database, http://www.molgen.ua.ac.be/FTDMutations/
Online Mendelian Inheritance in Man (OMIM), http://www.ncbi.nlm.nih.gov/Omim/
UCSF Genome Browser, http://genome.ucsc.edu/
References
- 1.Bateman A., Bennett H.P. The granulin gene family: From cancer to dementia. Bioessays. 2009;31:1245–1254. doi: 10.1002/bies.200900086. [DOI] [PubMed] [Google Scholar]
- 2.Baker M., Mackenzie I.R., Pickering-Brown S.M., Gass J., Rademakers R., Lindholm C., Snowden J., Adamson J., Sadovnick A.D., Rollinson S. Mutations in progranulin cause tau-negative frontotemporal dementia linked to chromosome 17. Nature. 2006;442:916–919. doi: 10.1038/nature05016. [DOI] [PubMed] [Google Scholar]
- 3.Cruts M., Gijselinck I., van der Zee J., Engelborghs S., Wils H., Pirici D., Rademakers R., Vandenberghe R., Dermaut B., Martin J.J. Null mutations in progranulin cause ubiquitin-positive frontotemporal dementia linked to chromosome 17q21. Nature. 2006;442:920–924. doi: 10.1038/nature05017. [DOI] [PubMed] [Google Scholar]
- 4.Mackenzie I.R., Neumann M., Bigio E.H., Cairns N.J., Alafuzoff I., Kril J., Kovacs G.G., Ghetti B., Halliday G., Holm I.E. Nomenclature and nosology for neuropathologic subtypes of frontotemporal lobar degeneration: an update. Acta Neuropathol. 2010;119:1–4. doi: 10.1007/s00401-009-0612-2. [DOI] [PMC free article] [PubMed] [Google Scholar]
- 5.Graff-Radford N.R., Woodruff B.K. Frontotemporal dementia. Semin. Neurol. 2007;27:48–57. doi: 10.1055/s-2006-956755. [DOI] [PubMed] [Google Scholar]
- 6.Mendez M.F. Frontotemporal dementia: Therapeutic interventions. Front Neurol. Neurosci. 2009;24:168–178. doi: 10.1159/000197896. [DOI] [PubMed] [Google Scholar]
- 7.Gijselinck I., Van Broeckhoven C., Cruts M. Granulin mutations associated with frontotemporal lobar degeneration and related disorders: An update. Hum. Mutat. 2008;29:1373–1386. doi: 10.1002/humu.20785. [DOI] [PubMed] [Google Scholar]
- 8.Ahmed Z., Sheng H., Xu Y.F., Lin W.L., Innes A.E., Gass J., Yu X., Hou H., Chiba S., Yamanouchi K. Accelerated lipofuscinosis and ubiquitination in granulin knockout mice suggest a role for progranulin in successful aging. Am. J. Pathol. 2010;177:311–324. doi: 10.2353/ajpath.2010.090915. [DOI] [PMC free article] [PubMed] [Google Scholar]
- 9.Ryan C.L., Baranowski D.C., Chitramuthu B.P., Malik S., Li Z., Cao M., Minotti S., Durham H.D., Kay D.G., Shaw C.A. Progranulin is expressed within motor neurons and promotes neuronal cell survival. BMC Neurosci. 2009;10:130. doi: 10.1186/1471-2202-10-130. [DOI] [PMC free article] [PubMed] [Google Scholar]
- 10.Van Damme P., Van Hoecke A., Lambrechts D., Vanacker P., Bogaert E., van Swieten J., Carmeliet P., Van Den Bosch L., Robberecht W. Progranulin functions as a neurotrophic factor to regulate neurite outgrowth and enhance neuronal survival. J. Cell Biol. 2008;181:37–41. doi: 10.1083/jcb.200712039. [DOI] [PMC free article] [PubMed] [Google Scholar]
- 11.Yin F., Banerjee R., Thomas B., Zhou P., Qian L., Jia T., Ma X., Ma Y., Iadecola C., Beal M.F. Exaggerated inflammation, impaired host defense, and neuropathology in progranulin-deficient mice. J. Exp. Med. 2010;207:117–128. doi: 10.1084/jem.20091568. [DOI] [PMC free article] [PubMed] [Google Scholar]
- 12.Brouwers N., Sleegers K., Engelborghs S., Maurer-Stroh S., Gijselinck I., van der Zee J., Pickut B.A., Van den Broeck M., Mattheijssens M., Peeters K. Genetic variability in progranulin contributes to risk for clinically diagnosed Alzheimer disease. Neurology. 2008;71:656–664. doi: 10.1212/01.wnl.0000319688.89790.7a. [DOI] [PubMed] [Google Scholar]
- 13.Sleegers K., Brouwers N., Maurer-Stroh S., van Es M.A., Van Damme P., van Vught P.W., van der Zee J., Serneels S., De Pooter T., Van den Broeck M. Progranulin genetic variability contributes to amyotrophic lateral sclerosis. Neurology. 2008;71:253–259. doi: 10.1212/01.wnl.0000289191.54852.75. [DOI] [PubMed] [Google Scholar]
- 14.Nuytemans K., Pals P., Sleegers K., Engelborghs S., Corsmit E., Peeters K., Pickut B., Mattheijssens M., Cras P., De Deyn P.P. Progranulin variability has no major role in Parkinson disease genetic etiology. Neurology. 2008;71:1147–1151. doi: 10.1212/01.wnl.0000327563.10320.2b. [DOI] [PubMed] [Google Scholar]
- 15.Viswanathan J., Mäkinen P., Helisalmi S., Haapasalo A., Soininen H., Hiltunen M. An association study between granulin gene polymorphisms and Alzheimer's disease in Finnish population. Am. J. Med. Genet. B. Neuropsychiatr. Genet. 2009;150B:747–750. doi: 10.1002/ajmg.b.30889. [DOI] [PubMed] [Google Scholar]
- 16.Rademakers R., Rovelet-Lecrux A. Recent insights into the molecular genetics of dementia. Trends Neurosci. 2009;32:451–461. doi: 10.1016/j.tins.2009.05.005. [DOI] [PMC free article] [PubMed] [Google Scholar]
- 17.Finch N., Baker M., Crook R., Swanson K., Kuntz K., Surtees R., Bisceglio G., Rovelet-Lecrux A., Boeve B., Petersen R.C. Plasma progranulin levels predict progranulin mutation status in frontotemporal dementia patients and asymptomatic family members. Brain. 2009;132:583–591. doi: 10.1093/brain/awn352. [DOI] [PMC free article] [PubMed] [Google Scholar]
- 18.Ghidoni R., Benussi L., Glionna M., Franzoni M., Binetti G. Low plasma progranulin levels predict progranulin mutations in frontotemporal lobar degeneration. Neurology. 2008;71:1235–1239. doi: 10.1212/01.wnl.0000325058.10218.fc. [DOI] [PubMed] [Google Scholar]
- 19.Schofield E.C., Halliday G.M., Kwok J., Loy C., Double K.L., Hodges J.R. Low serum progranulin predicts the presence of mutations: A prospective study. J. Alzheimers Dis. 2010 doi: 10.3233/JAD-2010-101032. [DOI] [PubMed] [Google Scholar]
- 20.Sleegers K., Brouwers N., Van Damme P., Engelborghs S., Gijselinck I., van der Zee J., Peeters K., Mattheijssens M., Cruts M., Vandenberghe R. Serum biomarker for progranulin-associated frontotemporal lobar degeneration. Ann. Neurol. 2009;65:603–609. doi: 10.1002/ana.21621. [DOI] [PubMed] [Google Scholar]
- 21.Carrasquillo M.M., Zou F., Pankratz V.S., Wilcox S.L., Ma L., Walker L.P., Younkin S.G., Younkin C.S., Younkin L.H., Bisceglio G.D. Genetic variation in PCDH11X is associated with susceptibility to late-onset Alzheimer's disease. Nat. Genet. 2009;41:192–198. doi: 10.1038/ng.305. [DOI] [PMC free article] [PubMed] [Google Scholar]
- 22.Kathiresan S., Melander O., Guiducci C., Surti A., Burtt N.P., Rieder M.J., Cooper G.M., Roos C., Voight B.F., Havulinna A.S. Six new loci associated with blood low-density lipoprotein cholesterol, high-density lipoprotein cholesterol or triglycerides in humans. Nat. Genet. 2008;40:189–197. doi: 10.1038/ng.75. [DOI] [PMC free article] [PubMed] [Google Scholar]
- 23.Musunuru K., Strong A., Frank-Kamenetsky M., Lee N.E., Ahfeldt T., Sachs K.V., Li X., Li H., Kuperwasser N., Ruda V.M. From noncoding variant to phenotype via SORT1 at the 1p13 cholesterol locus. Nature. 2010;466:714–719. doi: 10.1038/nature09266. [DOI] [PMC free article] [PubMed] [Google Scholar]
- 24.Purcell S., Neale B., Todd-Brown K., Thomas L., Ferreira M.A., Bender D., Maller J., Sklar P., de Bakker P.I., Daly M.J., Sham P.C. PLINK: A tool set for whole-genome association and population-based linkage analyses. Am. J. Hum. Genet. 2007;81:559–575. doi: 10.1086/519795. [DOI] [PMC free article] [PubMed] [Google Scholar]
- 25.Nykjaer A., Lee R., Teng K.K., Jansen P., Madsen P., Nielsen M.S., Jacobsen C., Kliemannel M., Schwarz E., Willnow T.E. Sortilin is essential for proNGF-induced neuronal cell death. Nature. 2004;427:843–848. doi: 10.1038/nature02319. [DOI] [PubMed] [Google Scholar]
- 26.Jansen P., Giehl K., Nyengaard J.R., Teng K., Lioubinski O., Sjoegaard S.S., Breiderhoff T., Gotthardt M., Lin F., Eilers A. Roles for the pro-neurotrophin receptor sortilin in neuronal development, aging and brain injury. Nat. Neurosci. 2007;10:1449–1457. doi: 10.1038/nn2000. [DOI] [PubMed] [Google Scholar]
- 27.Hermey G. The Vps10p-domain receptor family. Cell. Mol. Life Sci. 2009;66:2677–2689. doi: 10.1007/s00018-009-0043-1. [DOI] [PMC free article] [PubMed] [Google Scholar]
- 28.Petersen C.M., Nielsen M.S., Nykjaer A., Jacobsen L., Tommerup N., Rasmussen H.H., Roigaard H., Gliemann J., Madsen P., Moestrup S.K. Molecular identification of a novel candidate sorting receptor purified from human brain by receptor-associated protein affinity chromatography. J. Biol. Chem. 1997;272:3599–3605. doi: 10.1074/jbc.272.6.3599. [DOI] [PubMed] [Google Scholar]
- 29.Teng H.K., Teng K.K., Lee R., Wright S., Tevar S., Almeida R.D., Kermani P., Torkin R., Chen Z.Y., Lee F.S. ProBDNF induces neuronal apoptosis via activation of a receptor complex of p75NTR and sortilin. J. Neurosci. 2005;25:5455–5463. doi: 10.1523/JNEUROSCI.5123-04.2005. [DOI] [PMC free article] [PubMed] [Google Scholar]
- 30.Mazella J., Zsürger N., Navarro V., Chabry J., Kaghad M., Caput D., Ferrara P., Vita N., Gully D., Maffrand J.P., Vincent J.P. The 100-kDa neurotensin receptor is gp95/sortilin, a non-G-protein-coupled receptor. J. Biol. Chem. 1998;273:26273–26276. doi: 10.1074/jbc.273.41.26273. [DOI] [PubMed] [Google Scholar]
- 31.Hu F., Padukkavidana T., Vaegter C.B., Brady O.A., Zheng Y., Mackenzie I.R., Feldman H.H., Nykjaer A., Strittmatter S.M. Sortilin-mediated endocytosis determines levels of the frontotemporal dementia protein, progranulin. Neuron. 2010;68:654–667. doi: 10.1016/j.neuron.2010.09.034. [DOI] [PMC free article] [PubMed] [Google Scholar]
- 32.Lu Y., Feskens E.J., Boer J.M., Imholz S., Verschuren W.M., Wijmenga C., Vaarhorst A., Slagboom E., Müller M., Dollé M.E. Exploring genetic determinants of plasma total cholesterol levels and their predictive value in a longitudinal study. Atherosclerosis. 2010;213:200–205. doi: 10.1016/j.atherosclerosis.2010.08.053. [DOI] [PubMed] [Google Scholar]
- 33.Muendlein A., Geller-Rhomberg S., Saely C.H., Winder T., Sonderegger G., Rein P., Beer S., Vonbank A., Drexel H. Significant impact of chromosomal locus 1p13.3 on serum LDL cholesterol and on angiographically characterized coronary atherosclerosis. Atherosclerosis. 2009;206:494–499. doi: 10.1016/j.atherosclerosis.2009.02.040. [DOI] [PubMed] [Google Scholar]
- 34.Ronald J., Rajagopalan R., Ranchalis J.E., Marshall J.K., Hatsukami T.S., Heagerty P.J., Jarvik G.P. Analysis of recently identified dyslipidemia alleles reveals two loci that contribute to risk for carotid artery disease. Lipids Health Dis. 2009;8:52. doi: 10.1186/1476-511X-8-52. [DOI] [PMC free article] [PubMed] [Google Scholar]
- 35.Sandhu M.S., Waterworth D.M., Debenham S.L., Wheeler E., Papadakis K., Zhao J.H., Song K., Yuan X., Johnson T., Ashford S., Wellcome Trust Case Control Consortium LDL-cholesterol concentrations: a genome-wide association study. Lancet. 2008;371:483–491. doi: 10.1016/S0140-6736(08)60208-1. [DOI] [PMC free article] [PubMed] [Google Scholar]
- 36.Kleber M.E., Renner W., Grammer T.B., Linsel-Nitschke P., Boehm B.O., Winkelmann B.R., Bugert P., Hoffmann M.M., März W. Association of the single nucleotide polymorphism rs599839 in the vicinity of the sortilin 1 gene with LDL and triglyceride metabolism, coronary heart disease and myocardial infarction. The Ludwigshafen Risk and Cardiovascular Health Study. Atherosclerosis. 2010;209:492–497. doi: 10.1016/j.atherosclerosis.2009.09.068. [DOI] [PubMed] [Google Scholar]
- 37.Gibbs J.R., van der Brug M.P., Hernandez D.G., Traynor B.J., Nalls M.A., Lai S.L., Arepalli S., Dillman A., Rafferty I.P., Troncoso J. Abundant quantitative trait loci exist for DNA methylation and gene expression in human brain. PLoS Genet. 2010;6:e1000952. doi: 10.1371/journal.pgen.1000952. [DOI] [PMC free article] [PubMed] [Google Scholar]
- 38.Li Y., Willer C., Sanna S., Abecasis G. Genotype imputation. Annu. Rev. Genomics Hum. Genet. 2009;10:387–406. doi: 10.1146/annurev.genom.9.081307.164242. [DOI] [PMC free article] [PubMed] [Google Scholar]
- 39.Li Y., Abecasis G.R. Mach 1.0: Rapid haplotype reconstruction and missing genotype inference. Am. J. Hum. Genet. 2006;S79:2290. [Google Scholar]
- 40.Barbosa-Morais N.L., Dunning M.J., Samarajiwa S.A., Darot J.F., Ritchie M.E., Lynch A.G., Tavaré S. A re-annotation pipeline for Illumina BeadArrays: Improving the interpretation of gene expression data. Nucleic Acids Res. 2010;38:e17. doi: 10.1093/nar/gkp942. [DOI] [PMC free article] [PubMed] [Google Scholar]
- 41.Sleegers K., Brouwers N., Van Broeckhoven C. Role of progranulin as a biomarker for Alzheimer's disease. Biomark Med. 2010;4:37–50. doi: 10.2217/bmm.09.82. [DOI] [PubMed] [Google Scholar]
- 42.Dimas A.S., Deutsch S., Stranger B.E., Montgomery S.B., Borel C., Attar-Cohen H., Ingle C., Beazley C., Gutierrez Arcelus M., Sekowska M. Common regulatory variation impacts gene expression in a cell type-dependent manner. Science. 2009;325:1246–1250. doi: 10.1126/science.1174148. [DOI] [PMC free article] [PubMed] [Google Scholar]
- 43.Emilsson V., Thorleifsson G., Zhang B., Leonardson A.S., Zink F., Zhu J., Carlson S., Helgason A., Walters G.B., Gunnarsdottir S. Genetics of gene expression and its effect on disease. Nature. 2008;452:423–428. doi: 10.1038/nature06758. [DOI] [PubMed] [Google Scholar]
- 44.Benjamini Y., Hochberg Y. Controlling the false discovery rate: a practical and powerful approach to multiple testing. J. R. Statist. Soc. B. 1995;57:289–300. [Google Scholar]
Associated Data
This section collects any data citations, data availability statements, or supplementary materials included in this article.