

Abstract
Determining historical sex ratios throughout human evolution can provide insight into patterns of genomic variation, the structure and composition of ancient populations, and the cultural factors that influence the sex ratio (e.g., sex-specific migration rates). Although numerous studies have suggested that unequal sex ratios have existed in human evolutionary history, a coherent picture of sex-biased processes has yet to emerge. For example, two recent studies compared human X chromosome to autosomal variation to make inferences about historical sex ratios but reached seemingly contradictory conclusions, with one study finding evidence for a male bias and the other study identifying a female bias. Here, we show that a large part of this discrepancy can be explained by methodological differences. Specifically, through reanalysis of empirical data, derivation of explicit analytical formulae, and extensive simulations we demonstrate that two estimators of the effective sex ratio based on population structure and nucleotide diversity preferentially detect biases that have occurred on different timescales. Our results clarify apparently contradictory evidence on the role of sex-biased processes in human evolutionary history and show that extant patterns of human genomic variation are consistent with both a recent male bias and an earlier, persistent female bias.
Main Text
Although studies of DNA variation have revealed important insights into human demographic history, comparatively little is known about mating patterns and sex ratio during human evolution.1 Sex-biased processes, such as matrilocality—when females remain in their natal territory—and polygyny—when males have multiple female mates—are widespread in mammals and can have profound effects on genomic patterns of variation.2,3 One measure of the sex bias within a population is the effective sex ratio (ESR)—defined here as the female proportion of the effective population (). Diversity measures from the mtDNA and the nonrecombining portion of the Y chromosome (NRY) provide relative estimates of Nefemale and Nemale. Previous studies comparing mtDNA and NRY have shown evidence for local-scale sex biases in migration rates of humans4–8 and other species.9–12 Because these uniparentally inherited markers experience no recombination, however, selection on any part of the mtDNA or NRY will affect the entire locus and make ESR estimates difficult to interpret.13
Recently, the availability of sequence data has enabled comparisons of X chromosome and autosomal variation levels,14–18 which have higher power for making global-scale inferences about human sex biases than for making inferences based on mtDNA or NRY.13,19 These comparisons rely on a consequence of male hemizygosity: the effective number of X chromosomes in a population (NeX) depends on the ESR. If males and females are present in equal numbers (ESR = 0.5), then the effective population size of the X chromosome is three-quarters that of the autosomes.3 This relationship is described by the ratio Q:17
| (Equation 1) |
However, sex biases can lead to deviations from Q = 0.75: in cases of a male bias (Nefemale < Nemale) there is a relative reduction in the number of X chromosomes, decreasing Q (Q < 0.75); in cases of a female bias (Nefemale > Nemale) there is a relative increase in the number of X chromosomes, which increases Q (Q > 0.75). Because the effective population size of the X chromosome determines the rate of genetic drift on the X chromosome, Q can be estimated by comparing levels of genetic diversity between the X chromosome and the autosomes. In population data, Q can be estimated from statistics such as the fixation index (FST) and nucleotide diversity (π)16,17 and serves as a proxy for the ESR in detecting sex biases. Several recent studies have compared X chromosome and autosomal variation to make inferences regarding sex biases in Drosophila20–22 and in humans.14,16,17,23,24
Recently, two studies estimated Q in order to detect sex biases in similar human populations16,17 and found seemingly contradictory conclusions.25 Using SNP data from the International HapMap Project,26 Keinan et al. found evidence for a male bias during the dispersal of modern humans out of Africa (Figure 1A).17 Hammer and colleagues, however, found evidence for a female bias throughout human history in six populations from the Human Genome Diversity Panel (HGDP) (Figure 1A).16 Although these two analyses differ in several respects, such as the specific populations and markers analyzed, we were especially interested in whether methodological differences could account for the disparate results. In particular, the primary analysis of Keinan et al. used FST to estimate Q, whereas Hammer et al. estimated Q by using π (we will denote these estimators as QFST and Qπ):
| (Equation 2) |
| (Equation 3) |
Figure 1.
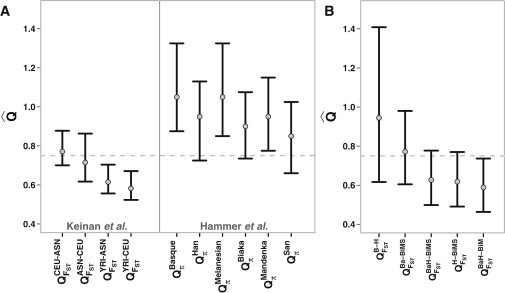
Estimates of QFST in Hammer's Resequencing Data Are Consistent with a Male Bias during the Out-of-Africa Dispersal
Point estimates of Q are indicated by gray dots, and vertical black bars represent 95% confidence intervals. The dashed gray line indicates the expected value of Q = 0.75 with no sex bias.
(A) Summary of two previous studies of human sex bias.16,17 The x axis shows the populations (superscript) and the variation measure used (subscript). A comparison between two populations is denoted by the population names connected by a hyphen. HapMap population abbreviations: ASN, Japanese in Tokyo and Han Chinese in Beijing; CEU, Utah residents with ancestry from northern and western Europe; YRI, Yoruba in Ibadan, Nigeria.
(B) Reanalysis of Hammer's data with the FST method. Several Q estimates are below 0.75, in contrast to estimates of Qπ in the same data set. Ba, Basque; H, Han; BaH, Basque+Han; BiM, Biaka+Mandenka; BiMS, Biaka+Mandenka+Han.
We investigated the properties of these estimators of Q by using three independent methods, including reanalysis of empirical data, a coalescent theoretical model, and detailed coalescent simulations.
The most direct way to explore the methodological differences in Q obtained by Keinan et al. and Hammer et al. is to calculate both Qπ and QFST on the same empirical data set. To this end, we obtained the resequencing data from Hammer et al., which consists of 20 regions (∼5 kb) each for the X chromosome and autosomes, and calculated QFST for all possible population pairs. The populations included in the data set are French Basque, Biaka, Han Chinese, Mandenka, Melanesian, and San.27 To mitigate the effects of recent sex biases unique to one population on estimates of QFST, we also performed analyses with combinations of populations (Biaka+Mandenka, Basque+Han, and Biaka+Mandenka+San). To calculate FST from this data, we tabulated allele frequencies in each population, excluding SNPs with a minor allele frequency < 0.05 (SNPA = 276, SNPX = 252). We calculated all pairwise FST estimates by using Weir and Cockerham's estimator,28 and we performed nonparametric bootstrapping over the SNPs to estimate 95% confidence intervals from 1000 bootstrap replicates. Combining the 1000 FSTX estimates and 1000 FSTA estimates into all 1,000,000 possible combinations, we obtained 1,000,000 estimates of QFST for each pair of populations by using Equation 3.
In the populations most closely related to the HapMap populations, most estimates of QFST are below 0.75 (Figure 1B), which is more consistent with the observations of Keinan et al. (using the same method) than with those of Hammer et al. (using the same data). Of the 25 possible comparisons of a non-African to an African population, only four exhibit a female bias (Figure S1 available online). In fact, over half of these non-African versus African comparisons display a male bias (four significantly so). Given the exact same data set, we still see marked differences between Qπ and QFST estimates in resequencing data, which is a compelling reason to investigate the methodological differences further.
To better understand the differences between QFST and Qπ, we first derived analytical expressions for both estimators under a coalescent model. Equation 4 can be used to calculate the expected value for π on either the X chromosome or autosomes, using the appropriate mutation rate μ (see the Appendix for a complete derivation):
| (Equation 4) |
Equation 4 is derived from a model based on a single lineage that is partitioned into nonoverlapping intervals described in terms of a series of population sizes, Nn, Nn-1, Nn-2, … N2, N1, proceeding from the present backward in time. Each interval has an associated duration describing how long the population remained at that size, giving a series of durations, Tn, Tn-1, Tn-2, … T2, T1, measured in generations.
We can extend the above model to two subpopulations that diverged from the same ancestral population t generations ago. The ancestral population has population sizes and associated durations N′n, N′n-1, N′n-2, … N′2, N′1 and T′n, T′n-1, T′n-2, … T′2, T′1. We can also derive an expression (Equation 5) for the expectation of π between subpopulations 1 and 2, which we denote as π12:
| (Equation 5) |
By using a formula for FST in terms of the three measures π1, π2, and π12,29 we can calculate approximate expected values for FST on the X chromosome or on the autosomes (see Appendix):
| (Equation 6) |
A model of the African (Af), Asian (As), and European (Eu) populations in terms of N and T parameter pairs is given in Figure S2. We used expressions 4, 5, and 6 to calculate πX, πA, FSTX, and FSTA under this model, and we then used Equations 2 and 3 to obtain QFST and Qπ. The expected values of both Qπ and QFST from the theoretical model without sex biases are slightly below 0.75, with the notable exception of QπAf (QπAf = 0.778; QπEu = 0.740; QπAs = 0.736; QFSTEu-Af = 0.740; QFSTAs-Af = 0.738; QFSTAs-Eu = 0.735). Population-size dynamics alone can have a significant impact on the null expectation of Qπ in the absence of sex bias,30 and it is interesting to note that this phenomenon also affects QFST.
To investigate the effects of a sex bias, we calculated QFST and Qπ in each population for sex biases of varying severity at 295 different time points for each of the three populations (Figure 2 and Figures S3, S4, and S5). Specifically, we introduced a 1400-generation-long sex bias into a single population 225,000 generations ago and moved this bias forward in time in 250-generation increments. At each increment, QFST and Qπ were calculated as described above. The African lineage most clearly demonstrates the different effects of the same sex bias on the two estimators of Q (Figures 2A and 2D). Qπ in Africans is virtually unaffected by the time of the bias, whereas the magnitude of QFST in Africans shifts further away from Q = 0.75 for recent biases. The same general patterns are observed for biases introduced into the European and Asian lineages (Figures 2B, 2C, 2E, and 2F).
Figure 2.
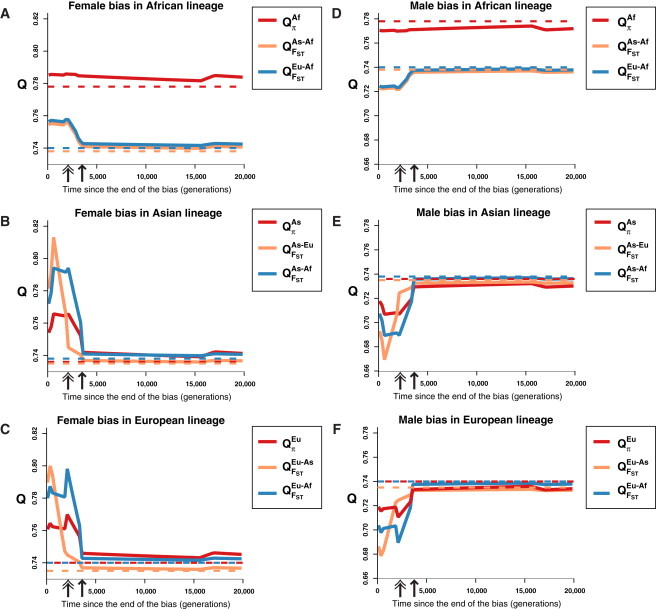
Expected Values of QFST and Qπ after a Bias in a Population's History, Using a Theoretical Coalescent Model
Each plot displays the expected values of relevant Q estimators after a single female bias (ESR = 0.9) (A–C) or male bias (ESR = 0.1) (D–F) lasting 1400 generations introduced into a single lineage's history. The x axis indicates the number of generations elapsed since the bias ended. Double-headed arrows indicate the time of the split between Asian and European populations, and single-headed arrows indicate the time of the split between Africans and non-Africans. Solid lines denote the results after introducing a bias, whereas dashed lines in a corresponding color indicate the null theoretical expectation of each Q estimator in the absence of a sex bias.
For non-African populations, Qπ does change as the bias becomes more recent, but the magnitude of the changes in QFST is much larger. These changes in Qπ for non-Africans are attributable to the introduction of a bias during or near a population bottleneck, growth, or expansion event that amplifies the signal of the bias. The sensitivity of QFST to a recent bias is explained by closely examining the expected values of the estimator in a non-African population; for instance, Europeans. There are two QFST comparisons for the European population: QFSTEu-As and QFSTEu-Af. There is a region of time—between double- and single-headed arrows—when QFSTEu-As is still largely unchanged while QFSTEu-Af has already decreased (male bias; Figure 2B) or increased (female bias; Figure 2E). When the bias ends before the divergence of Asians and Europeans, it has less of an effect on QFST As-Eu because the bias occurred during their shared history. When the bias starts after the two populations diverge, however, only one population experiences the bias, so the differences between the two populations are greater. These results suggest a timescale hypothesis, which posits that QFST and Qπ are influenced by biases on different timescales: QFST is influenced mainly by sex biases occurring in the portion of time after two populations diverge, whereas Qπ is influenced by biases along the whole lineage.
To complement and extend the theoretical analyses described above, we also performed extensive coalescent simulations to explore the behavior of QFST and Qπ under more complex demographic situations with different magnitudes and durations of male and female sex biases. We used the program ms31 to simulate samples from Africans, Europeans, and Asians by using a best-fit model of evolution derived from the HapMap SNP data,32 including bottlenecks, population expansions, and population splits with no migration (see Tables S1 and S2 for model parameters and ms command lines). Using this basic coalescent model, we first simulated autosomal and X-chromosomal regions with recombination, similar to those sampled by Hammer et al. To simulate regions on the X chromosome (with no sex bias), we scaled θ (θ = 4Neμ) from the autosomal simulation by 0.75 and also scaled the population recombination rate ρ (ρ = 4Ner) to be half that of the autosomes. For this simulated sequence data, we calculated both πA and πX for Africans, Europeans, Asians, and non-Africans (nA) and used Equation 2 to estimate Qπ in each population. To model the sampling method of Keinan et al., we simulated unlinked SNPs on the autosomes and on the X chromosome—again scaling the X chromosome parameters appropriately—and simulated the ascertainment process by matching the global minor allele frequency spectrum to that of the HapMap SNPs. From these SNPs, we obtained FSTA and FSTX for the four comparisons: (1) non-Africans versus Africans (nA-Af), (2) Europeans versus Africans (Eu-Af), (3) Asians versus Africans (As-Af), and (4) Asians versus Europeans (As-Eu). Then, we used Equation 3 to estimate QFST for each comparison.
To incorporate sex biases into the coalescent model of the X chromosome, we scaled the population size during the out-of-Africa bottleneck event (50 generations long) by using Equation 733 to determine the effective size on the X chromosome given the autosomal effective size during the bottleneck and an arbitrary ESR.
| (Equation 7) |
We used this scaling procedure to simulate sex biases on the X chromosome by using the NeA value corresponding to the out-of-Africa bottleneck, with ESR values ranging from 0.1 (extreme male bias) to 0.9 (extreme female bias). Because our simulations directly manipulate the number of X chromosomes found in human populations, they are agnostic to the specific mechanism causing the bias. According to Equation 7, the X chromosome experiences a more severe bottleneck than the autosomes in the case of a male bias (ESR < 0.5) and a less severe bottleneck in the case of a female bias (ESR > 0.5). We also simulated an extended bias beyond the duration of the bottleneck, with 150 to 1350 additional generations of sex bias, resulting in biases lasting from 50 to 1400 generations in total.
In the absence of a sex bias, some of our null estimates of Qπ are above 0.75 (QπnA = 0.769; QπAf = 0.791; QπEu = 0.753; QπAs = 0.751). This shift is due to the bottlenecks and periods of expansion in our model of human evolution and is consistent with the observations of Pool and Nielsen.30 In keeping with the theoretical results described above, simulations show that our model of human evolution leads to a lower QFST estimate than the 0.75 expectation in the absence of a sex bias (QFSTEu-Af = 0.708; QFSTAs-Af = 0.708; QFSTAs-Eu = 0.718; QFSTnA-Af = 0.719). Simulated null estimates for QFST are lower than those obtained with the theoretical framework, which may be due to the differences between Equation 6 and the Weir and Cockerham estimator of FST, or to the effects of recombination. For all of the analyses described below, we will use the simulated null estimates of Q for hypothesis-testing purposes.
As shown in Figures S6 and S7, both Qπ and QFST decrease in response to a simulated male bias and increase in response to a simulated female bias. Notably, the relative change in the value of Qπ is much smaller than the change in the value of QFST. The simulated bias occurs after non-Africans diverge from Africans and has a stronger effect on QFST than on Qπ. From the data in Figure S6, it is clear that Qπ is not well suited for detecting recent sex biases associated with the out-of-Africa dispersal. These observations, along with the reanalysis of Hammer's data with QFST and some previous implications in the literature,13,17,19,34,35 support the hypothesis that Qπ and QFST detect biases on different timescales. π in each population is a function of polymorphism along the whole lineage, whereas FST is a function of polymorphism differences between two populations; therefore, Qπ is affected by sex biases both before and after two populations have split, whereas QFST is primarily affected by sex biases occurring after the split.
To more explicitly evaluate the different timescales on which Qπ and QFST detect biases, we performed additional coalescent simulations using the best-fit model of human evolution and including two separate sex biases (Figure 3A). We first introduced a female bias lasting for 20,000 generations along the ancestral human lineage, corresponding to the time before the dispersal of modern humans out of Africa. We then introduced a male bias in the non-African lineage, lasting for the 1400 generations before the split between European and Asian populations. Using this basic set of model parameters, we simulated both linked sequence regions and unlinked SNPs to repeat the Qπ and QFST estimation procedure described above. We simulated scenarios with an ESR of 0.9, 0.8, 0.7, or 0.6 for the female bias and an ESR of 0.1, 0.2, 0.3, or 0.4 for the male bias.
Figure 3.
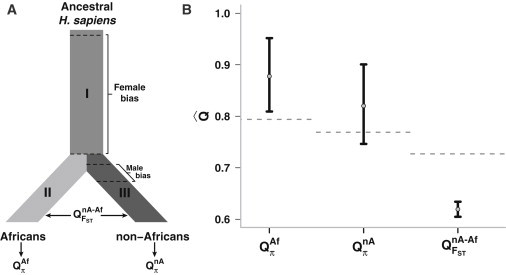
Coalescent Simulations Show that QFST and Qπ Detect Sex-Biased Events on Different Timescales
(A) Graphical representation of the simulation model. For simplicity, population-size changes are not shown and the branch lengths are not to scale. The three possible Q estimates are shown. πAf measures diversity along sections I and II of the lineage, πnA measures diversity along sections I and III, and FSTnA-Af measures divergence between sections II and III.
(B) Results from the simulations of the scenario in (A). Gray dashed lines are the null estimates determined by simulations (Figures S6 and S7). As predicted by the timescale hypothesis, the two estimates of Qπ are above 0.75, detecting the early female bias. The estimate of QFST, however, is below 0.75, detecting the recent male bias. Female bias: ESR = 0.9, 20,000 generations; Male bias: ESR = 0.1, 1400 generations.
Black bars represent 95% confidence intervals.
If QFST and Qπ preferentially detect sex biases acting on different timescales, the model considered in Figure 3A leads to three testable predictions: (1) QπAf should be much greater than 0.75, (2) QπnA should be slightly greater than 0.75, and (3) QFSTnA-Af should be less than 0.75. The simulation results are in complete agreement with these predictions (Figure 3A and Figure 4). Interestingly, at least one simulated scenario (Figure 3B) produces results for QπAf and QFSTnA-Af that are consistent with some of the observations by Hammer et al. and Keinan et al. Bilinear interpolation heat maps (Figure 4) show the relationship between the magnitude (ESR) of male and female biases and the resulting Q ratio. Contours in Figures 4B and 4C show that QπAf depends primarily on the magnitude of the older female bias whereas QFSTnA-Af depends primarily on the magnitude of the recent male bias. Figure 3A, however, shows that the more complex pattern of QπnA is jointly influenced by the magnitudes of both biases.
Figure 4.
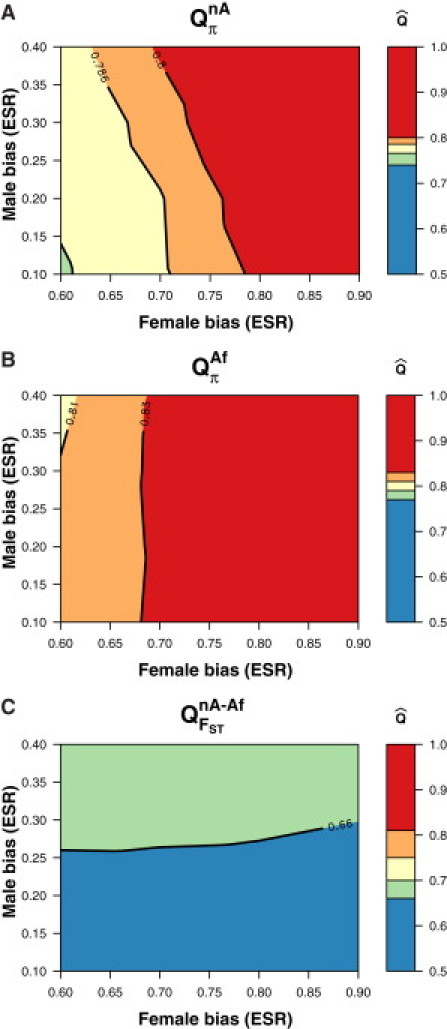
Coalescent Simulations Show that QFST Is Primarily Influenced by the ESR of a Recent Bias, Whereas Qπ Is Primarily Influenced by the ESR of an Ancestral Bias
Each panel shows a set of Q estimates from simulated data under the model in Figure 3A. The y axis and x axis indicate the ESR for the male and female bias, respectively, in the model. The color indicates the value of Q for a combination of male and female ESRs (note the Q scales are different in each plot).
(A) Qπ in non-Africans is jointly influenced by both the recent and ancient biases, but the signal from the older bias dominates.
(B) Africans experience only the female bias, shifting Qπ in Africans above 0.75.
(C) Although non-Africans experience both the male and female biases, QFST comparing the two shows no evidence of the older female-biased event.
In summary, our theoretical and simulation results demonstrate that the seemingly contradictory results of Hammer et al. and Keinan et al. are in fact reconcilable. Qπ is well suited for detecting sex biases in the ancestral human population, so it is probable that the female biases detected by Hammer and colleagues represent a female bias that is a shared legacy of all human populations. Long-term sex-biased processes, such as polygyny or higher female dispersal rates in ancestral human populations, likely caused the Qπ estimates found by Hammer et al. Furthermore, a recent study that compared relative recombination rates on the X chromosome and autosomes found evidence for an ESR greater than 0.5 (female bias) in all three HapMap populations.18,36,37 These results are consistent with the Qπ observations of Hammer et al. because, like π, recombination rates detect events along the whole lineage of the human population.
The male bias detected by Keinan et al. can be explained by a recent event associated with the out-of-Africa dispersal, as initially proposed by the authors. The Q ratios detected by Keinan et al. suggest a very strong male bias for the entire portion of the non-African lineage before the split of Asians from Europeans. A subsequent study has shown that a model of continuous male-biased migration from African into non-African populations before the split of Asians and Europeans can account for the magnitude of the previously observed male bias.35
In their supplementary analyses, Keinan et al. also estimated a Qπ-like measure in shotgun genome sequences from a small number of individuals. Their results were consistent with the pattern that they observed for QFST in that Q is much lower in non-African than in African populations.17 Recently, a new study found that regions close to genes have a deficit of X-linked diversity (Qπ < 0.75) whereas regions further from genes have an excess of X-linked diversity (Qπ > 0.75), suggesting that positive selection has had a widespread effect on X-linked genes.38 These results are consistent with previous studies that have detected signatures of selection across the X chromosome.39,40 The correlation between Qπ and genetic distance from genes can potentially explain the contrasting results for Qπ, but not the discrepancy between Keinan's QFST and Hammer's Qπ. We have demonstrated methodological differences between QFST and Qπ that can account for the majority of this discrepancy, but it remains to be seen what other factors are contributing to the conflicting results, such as small sample sizes, different sample populations, and different outgroup species.
More broadly, our results illustrate that complicated demographic models can influence different summary statistics of genetic variation in distinct ways. Thus, evaluating the operating characteristics and behavior of summary statistics under complex demographic models provides important insights into whether different summaries of genetic variation could have been generated by the same evolutionary forces. These insights will be critical in interpreting the deluge of next-generation sequencing data sets41 and developing a more comprehensive understanding of human evolutionary history.
Acknowledgments
We thank Mike Hammer and Alon Keinan for providing data from their previous studies and Alon Keinan, Abigail Bigham, and members of the Akey lab for helpful discussions. We also acknowledge two anonymous reviewers for their thoughtful comments. This research was supported in part by National Institutes of Health (NIH) grant RO1GM078105 and an NIH/National Human Genome Research Institute (NHGRI) Genome Training Grant. J.F.'s participation was funded by National Science Foundation grant 0814322 (P.I. Mary Kuhner) and by “life support” funding from the Department of Genome Sciences.
Appendix
Derivation of Formula for Evaluating Qπ
Using a coalescent approach based on previous work,30,42 we can derive a formula for the expected value of π in a population with a given history. As shown in Figure S4, the genealogy of a population can be partitioned into a series of discrete intervals, described by the parameters N1, N2, …,Nn and T1, T2, …,Tn, where Ni and Ti denote the population size and number of generations for the ith interval, respectively. To derive an analytical formula for evaluating Qπ, we need to express π, the probability that two randomly sampled copies of a locus differ, as a function of the Ni's and Ti's. Assuming biallelic loci and an infinite-sites model of evolution, π is equivalent to the probability that a single mutation occurred at some point in the genealogy of a locus.42 The probability of a mutation occurring in a given genealogy is equal to 2μτ, where μ is the mutation rate per site per generation and τ is the time to coalescence for the two sampled copies.
Assuming an infinitely long lineage (i.e., the two sampled loci do coalesce eventually), then the total coalescent time, τ, can be determined by considering the contribution of each interval to τ. τ is a function of the coalescent times of each interval, denoted as τ1, τ2, … τn and the probability, Pc(i), that the two copies will coalesce in the ith interval:
| (Equation 8) |
Note that each interval's contribution to τ is the product of the probability that the two sampled copies coalesce in that interval and the expected coalescent time if coalescence does occur there.
Following standard coalescent theory, going backward in time, Pc(i) can be approximated as an exponential function, conditional on the probability of not coalescing in all previous segments:
| (Equation 9) |
Note that the first term in Equation 9 is the probability of not coalescing in all previous intervals of the lineage and the second term is the probability of coalescing in the ith interval given that coalescence has not occurred previously. For the most recent interval, n, the probability of not coalescing in all previous intervals becomes unity and therefore:
| (Equation 10) |
We assume that T1 = ∞ and therefore the probability of coalescing in interval 1 becomes unity, conditional on lack of coalescence in all previous sections and thus:
| (Equation 11) |
Finally, we can express the expected coalescent time for the ith interval, τi, in terms of the N and T parameters. Specifically, the expected value of τi is:
| (Equation 12) |
Evaluating the integral, the expected value of τi becomes:
| (Equation 13) |
The final interval, where we have assumed that T1 = ∞, yields the following limit:
| (Equation 14) |
and therefore τ1 ≃ 2N1. By substituting the expressions for τi and Pc(i) into Equation 8, we obtain the final expression for π as provided in the main text (Equation 4).
Derivation of Formula for Evaluating QFST
We extended the previous model to include two subpopulations that diverged from an ancestral population, which is described by a series of n discrete intervals that are characterized by the parameters T′i and N′i. In order to evaluate QFST, we first derived an expression for the average pairwise divergence, π12, between the two subpopulations, which diverged t generations ago. When one copy of a locus is sampled from each subpopulation, π12 is also equivalent to the probability that a mutation occurred on the genealogy of the two sampled copies; however, because we assume no migration, coalescence can only occur in the ancestral population. The expected value of π12 is derived in the same way as that of π, but requires a modified form of Equation 8:
| (Equation 15) |
Note that 2t is added to the expression for the coalescent time in each interval because the genealogy of the two sampled copies will always include a branch for subpopulation 1 and a branch for subpopulation 2, both of length t, where coalescence cannot occur. Substituting Equation 15 into Equation 8 yields the final equation for the expected value of π12 provided in the main text (Equation 5).
Using the formulas for π and π12 derived above, we can obtain approximate expected values for FST between two subpopulations using the following formula from Hudson et al.:29
| (Equation 16) |
Note that Hw is the mean of nucleotide diversity in each subpopulation and Hb is the nucleotide diversity in the combined subpopulations:
| (Equation 17) |
Using these expressions for Hw and Hb we obtain the final formula for FST in terms of π that is presented as Equation 6 in the main text.
Supplemental Data
References
- 1.Quinlan R. Human pair-bonds: Evolutionary functions, ecological variation, and adaptive development. Evol. Anthropol. 2008;17:227–238. [Google Scholar]
- 2.Greenwood P. Mating systems, philopatry and dispersal in birds and mammals. Anim. Behav. 1980;28:1140–1162. [Google Scholar]
- 3.Hedrick P.W. Sex: differences in mutation, recombination, selection, gene flow, and genetic drift. Evolution. 2007;61:2750–2771. doi: 10.1111/j.1558-5646.2007.00250.x. [DOI] [PubMed] [Google Scholar]
- 4.Seielstad M.T., Minch E., Cavalli-Sforza L.L. Genetic evidence for a higher female migration rate in humans. Nat. Genet. 1998;20:278–280. doi: 10.1038/3088. [DOI] [PubMed] [Google Scholar]
- 5.Oota H., Settheetham-Ishida W., Tiwawech D., Ishida T., Stoneking M. Human mtDNA and Y-chromosome variation is correlated with matrilocal versus patrilocal residence. Nat. Genet. 2001;29:20–21. doi: 10.1038/ng711. [DOI] [PubMed] [Google Scholar]
- 6.Wilder J.A., Kingan S.B., Mobasher Z., Pilkington M.M., Hammer M.F. Global patterns of human mitochondrial DNA and Y-chromosome structure are not influenced by higher migration rates of females versus males. Nat. Genet. 2004;36:1122–1125. doi: 10.1038/ng1428. [DOI] [PubMed] [Google Scholar]
- 7.Wilder J.A., Mobasher Z., Hammer M.F. Genetic evidence for unequal effective population sizes of human females and males. Mol. Biol. Evol. 2004;21:2047–2057. doi: 10.1093/molbev/msh214. [DOI] [PubMed] [Google Scholar]
- 8.Hamilton G., Stoneking M., Excoffier L. Molecular analysis reveals tighter social regulation of immigration in patrilocal populations than in matrilocal populations. Proc. Natl. Acad. Sci. USA. 2005;102:7476–7480. doi: 10.1073/pnas.0409253102. [DOI] [PMC free article] [PubMed] [Google Scholar]
- 9.Melnick D., Hoelzer G. Differences in male and female macaque dispersal lead to contrasting distributions of nuclear and mitochondrial DNA variation. Int. J. Primatol. 1992;13:379–393. [Google Scholar]
- 10.Eriksson J., Siedel H., Lukas D., Kayser M., Erler A., Hashimoto C., Hohmann G., Boesch C., Vigilant L. Y-chromosome analysis confirms highly sex-biased dispersal and suggests a low male effective population size in bonobos (Pan paniscus) Mol. Ecol. 2006;15:939–949. doi: 10.1111/j.1365-294X.2006.02845.x. [DOI] [PubMed] [Google Scholar]
- 11.Douadi M.I., Gatti S., Levrero F., Duhamel G., Bermejo M., Vallet D., Menard N., Petit E.J. Sex-biased dispersal in western lowland gorillas (Gorilla gorilla gorilla) Mol. Ecol. 2007;16:2247–2259. doi: 10.1111/j.1365-294X.2007.03286.x. [DOI] [PubMed] [Google Scholar]
- 12.Langergraber K.E., Siedel H., Mitani J.C., Wrangham R.W., Reynolds V., Hunt K., Vigilant L. The genetic signature of sex-biased migration in patrilocal chimpanzees and humans. PLoS ONE. 2007;2:e973. doi: 10.1371/journal.pone.0000973. [DOI] [PMC free article] [PubMed] [Google Scholar]
- 13.Wilkins J.F., Marlowe F.W. Sex-biased migration in humans: what should we expect from genetic data? Bioessays. 2006;28:290–300. doi: 10.1002/bies.20378. [DOI] [PubMed] [Google Scholar]
- 14.Ramachandran S., Rosenberg N.A., Zhivotovsky L.A., Feldman M.W. Robustness of the inference of human population structure: a comparison of X-chromosomal and autosomal microsatellites. Hum. Genomics. 2004;1:87–97. doi: 10.1186/1479-7364-1-2-87. [DOI] [PMC free article] [PubMed] [Google Scholar]
- 15.Ramachandran S., Rosenberg N.A., Feldman M.W., Wakeley J. Population differentiation and migration: coalescence times in a two-sex island model for autosomal and X-linked loci. Theor. Popul. Biol. 2008;74:291–301. doi: 10.1016/j.tpb.2008.08.003. [DOI] [PMC free article] [PubMed] [Google Scholar]
- 16.Hammer M.F., Mendez F.L., Cox M.P., Woerner A.E., Wall J.D., Petrov D. Sex-biased evolutionary forces shape genomic patterns of human diversity. PLoS Genet. 2008;4:e1000202. doi: 10.1371/journal.pgen.1000202. [DOI] [PMC free article] [PubMed] [Google Scholar]
- 17.Keinan A., Mullikin J.C., Patterson N., Reich D. Accelerated genetic drift on chromosome X during the human dispersal out of Africa. Nat. Genet. 2009;41:66–70. doi: 10.1038/ng.303. [DOI] [PMC free article] [PubMed] [Google Scholar]
- 18.Labuda D., Lefebvre J.F., Nadeau P., Roy-Gagnon M.H. Female-to-male breeding ratio in modern humans-an analysis based on historical recombinations. Am. J. Hum. Genet. 2010;86:353–363. doi: 10.1016/j.ajhg.2010.01.029. [DOI] [PMC free article] [PubMed] [Google Scholar]
- 19.Goudet J., Perrin N., Waser P. Tests for sex-biased dispersal using bi-parentally inherited genetic markers. Mol. Ecol. 2002;11:1103–1114. doi: 10.1046/j.1365-294x.2002.01496.x. [DOI] [PubMed] [Google Scholar]
- 20.Begun D.J., Whitley P. Reduced X-linked nucleotide polymorphism in Drosophila simulans. Proc. Natl. Acad. Sci. USA. 2000;97:5960–5965. doi: 10.1073/pnas.97.11.5960. [DOI] [PMC free article] [PubMed] [Google Scholar]
- 21.Musters H., Huntley M.A., Singh R.S. A genomic comparison of faster-sex, faster-X, and faster-male evolution between Drosophila melanogaster and Drosophila pseudoobscura. J. Mol. Evol. 2006;62:693–700. doi: 10.1007/s00239-005-0165-5. [DOI] [PubMed] [Google Scholar]
- 22.Singh N.D., Macpherson J.M., Jensen J.D., Petrov D.A. Similar levels of X-linked and autosomal nucleotide variation in African and non-African populations of Drosophila melanogaster. BMC Evol. Biol. 2007;7:202. doi: 10.1186/1471-2148-7-202. [DOI] [PMC free article] [PubMed] [Google Scholar]
- 23.Hammer M.F., Garrigan D., Wood E., Wilder J.A., Mobasher Z., Bigham A.W., Krenz J.G., Nachman M.W. Heterogeneous patterns of variation among multiple human x-linked Loci: the possible role of diversity-reducing selection in non-africans. Genetics. 2004;167:1841–1853. doi: 10.1534/genetics.103.025361. [DOI] [PMC free article] [PubMed] [Google Scholar]
- 24.Ségurel L., Martínez-Cruz B., Quintana-Murci L., Balaresque P., Georges M., Hegay T., Aldashev A., Nasyrova F., Jobling M.A., Heyer E., Vitalis R. Sex-specific genetic structure and social organization in Central Asia: insights from a multi-locus study. PLoS Genet. 2008;4:e1000200. doi: 10.1371/journal.pgen.1000200. [DOI] [PMC free article] [PubMed] [Google Scholar]
- 25.Bustamante C.D., Ramachandran S. Evaluating signatures of sex-specific processes in the human genome. Nat. Genet. 2009;41:8–10. doi: 10.1038/ng0109-8. [DOI] [PMC free article] [PubMed] [Google Scholar]
- 26.Frazer K.A., Ballinger D.G., Cox D.R., Hinds D.A., Stuve L.L., Gibbs R.A., Belmont J.W., Boudreau A., Hardenbol P., Leal S.M., International HapMap Consortium A second generation human haplotype map of over 3.1 million SNPs. Nature. 2007;449:851–861. doi: 10.1038/nature06258. [DOI] [PMC free article] [PubMed] [Google Scholar]
- 27.Wall J.D., Cox M.P., Mendez F.L., Woerner A., Severson T., Hammer M.F. A novel DNA sequence database for analyzing human demographic history. Genome Res. 2008;18:1354–1361. doi: 10.1101/gr.075630.107. [DOI] [PMC free article] [PubMed] [Google Scholar]
- 28.Weir B.S. Sinauer; Sunderland, MA: 1996. Genetic Data Analysis II. p. 73. [Google Scholar]
- 29.Hudson R.R., Slatkin M., Maddison W.P. Estimation of levels of gene flow from DNA sequence data. Genetics. 1992;132:583–589. doi: 10.1093/genetics/132.2.583. [DOI] [PMC free article] [PubMed] [Google Scholar]
- 30.Pool J.E., Nielsen R. Population size changes reshape genomic patterns of diversity. Evolution. 2007;61:3001–3006. doi: 10.1111/j.1558-5646.2007.00238.x. [DOI] [PMC free article] [PubMed] [Google Scholar]
- 31.Hudson R.R. Generating samples under a Wright-Fisher neutral model of genetic variation. Bioinformatics. 2002;18:337–338. doi: 10.1093/bioinformatics/18.2.337. [DOI] [PubMed] [Google Scholar]
- 32.Schaffner S.F., Foo C., Gabriel S., Reich D., Daly M.J., Altshuler D. Calibrating a coalescent simulation of human genome sequence variation. Genome Res. 2005;15:1576–1583. doi: 10.1101/gr.3709305. [DOI] [PMC free article] [PubMed] [Google Scholar]
- 33.Hedrick P. Jones and Bartlett; Sudbury, MA: 2005. Genetics of Populations. pp. 323. [Google Scholar]
- 34.Prugnolle F., de Meeus T. Inferring sex-biased dispersal from population genetic tools: a review. Heredity. 2002;88:161–165. doi: 10.1038/sj.hdy.6800060. [DOI] [PubMed] [Google Scholar]
- 35.Keinan A., Reich D. Can a sex-biased human demography account for the reduced effective population size of chromosome X in non-Africans? Mol. Biol. Evol. 2010;27:2312–2321. doi: 10.1093/molbev/msq117. [DOI] [PMC free article] [PubMed] [Google Scholar]
- 36.Lohmueller K.E., Degenhardt J.D., Keinan A. Sex-averaged recombination and mutation rates on the X chromosome: A comment on Labuda et al. Am. J. Hum. Genet. 2010;86:978–980. doi: 10.1016/j.ajhg.2010.03.021. author reply 980–981. [DOI] [PMC free article] [PubMed] [Google Scholar]
- 37.Labuda D., Lefebvre J., Roy-Gagnon M. Response to Lohmueller et al. Am. J. Hum. Genet. 2010;86:980–981. doi: 10.1016/j.ajhg.2010.01.029. [DOI] [PMC free article] [PubMed] [Google Scholar]
- 38.Hammer M.F., Woerner A.E., Mendez F.L., Watkins J.C., Cox M.P., Wall J.D. The ratio of human X chromosome to autosome diversity is positively correlated with genetic distance from genes. Nat. Genet. 2010;42:830–831. doi: 10.1038/ng.651. [DOI] [PubMed] [Google Scholar]
- 39.Casto A.M., Li J.Z., Absher D., Myers R., Ramachandran S., Feldman M.W. Characterization of X-linked SNP genotypic variation in globally distributed human populations. Genome Biol. 2010;11:R10. doi: 10.1186/gb-2010-11-1-r10. [DOI] [PMC free article] [PubMed] [Google Scholar]
- 40.Lambert C.A., Connelly C.F., Madeoy J., Qiu R., Olson M.V., Akey J.M. Highly punctuated patterns of population structure on the X chromosome and implications for African evolutionary history. Am. J. Hum. Genet. 2010;86:34–44. doi: 10.1016/j.ajhg.2009.12.002. [DOI] [PMC free article] [PubMed] [Google Scholar]
- 41.Li Y., Vinckenbosch N., Tian G., Huerta-Sanchez E., Jiang T., Jiang H., Albrechtsen A., Andersen G., Cao H., Korneliussen T. Resequencing of 200 human exomes identifies an excess of low-frequency non-synonymous coding variants. Nat. Genet. 2010;42:969–972. doi: 10.1038/ng.680. [DOI] [PubMed] [Google Scholar]
- 42.Polanski A., Kimmel M., Chakraborty R. Application of a time-dependent coalescence process for inferring the history of population size changes from DNA sequence data. Proc. Natl. Acad. Sci. USA. 1998;95:5456–5461. doi: 10.1073/pnas.95.10.5456. [DOI] [PMC free article] [PubMed] [Google Scholar]
Associated Data
This section collects any data citations, data availability statements, or supplementary materials included in this article.