Abstract
Polyunsaturated fatty acids (PUFAs) possess anti-cancer action both in vitro and in vivo. In the present study, we detected cell viability with methyl thiazolyl tetrazolium (MTT) assay and cell membrane permeability with propidium iodide (PI) fluorescence dyeing, and calculated cell membrane fluidity change as fluorescence anisotropy. Fatty acid content in cells was measured by gas chromatography/mass spectroscopy (GC/MS), and the relationship between fatty acid composition and cell viability was studied. We observed that n-6 PUFA linoleic acid (LA) inhibited tumor cell growth at high concentrations (≥300 µmol/L), while low concentrations (100–200 µmol/L) seemed to promote cell proliferation. Analyses of cell membrane permeability, cell membrane fluidity, and cell fatty acid composition suggested that the anti-cancer action of LA could be related to changes in the ratio of n-6 to n-3 PUFAs. We observed that pre-incubation of cancer cells with 100 µmol/L LA for 24 h enhanced cell sensitivity to the cytotoxic action of LA, whereas undifferentiated cell line LoVo seemed to have a distinct path in LA-induced death. These results showed that one of the mechanisms by which supplementation of LA induces cancer cell death could be altering the ratio of n-6/n-3 PUFAs, and this may be related to cell differentiation status.
Keywords: Anti-cancer, Fatty acids composition, Linoleic acid, In vitro
1. Introduction
Linoleic acid (LA, n-6, 18:2) and α-linolenic acid (ALA, n-3, 18:3), as essential fatty acids (FAs), form precursors to their long chain metabolites, namely γ-linolenic acid (GLA, n-6, 18:3), dihomo-GLA (DGLA, n-6, 20:3) and arachidonic acid (AA, n-6, 20:4), and eicosapentaenoic acid (EPA, n-3, 20:5) and docosahexaenoic acid (DHA, n-3, 22:6), respectively. Polyunsaturated fatty acids (PUFAs), such as GLA, DGLA, AA, EPA, and DHA, can bring about the action of EFAs, and hence are also called functional EFAs. Our previous studies showed that, under some specific conditions, PUFAs can induce tumor cell death, though the sensitivity of various cancer cell lines to different fatty acids was found to be variable, depending on the type of cancer cells tested and the type and concentration of the fatty acids used (Bégin et al., 1985; 1986a; 1986b; Das, 1991).
We observed that of all the fatty acids tested, GLA, AA, EPA, and DHA were the most effective in injuring tumor cells. LA and ALA were also effective, but at much higher concentrations compared with other PUFAs (Bégin et al., 1985; 1986a; 1986b; Das, 1991). In general, it is believed that n-6 fatty acids are unhelpful in cancer prevention and therapy, whereas n-3 fatty acids are beneficial. This is because n-6 forms precursors of several pro-inflammatory eicosanoids, whereas products formed from n-3 are much less pro-inflammatory (Das, 2006a; 2006b; Funahashi et al., 2008). When n-6 and n-3 fatty acids were tested for their effects on cancer cells, it was found that n-3 PUFAs were much more effective in inhibiting cancer cell growth compared with n-6 PUFAs (Ip, 1993; Klurfeld and Bull, 1997; Kumar and Das, 1997; Chapkin et al., 2008).
However, in most studies, even in some in vivo experiments, the researchers compared the functions of n-3 PUFAs and n-6 PUFAs in fatty acid metabolism by treating the cells or animals with the same concentration of fatty acids, without consideration of the normal cell or the fatty acid ratio of the body (Berquin et al., 2007; Hammamieh et al., 2007). Actually, n-6 PUFAs accounted for 35% of the fatty acid composition, and n-3 PUFAs accounted for only 5% in serum (Conquer et al., 1999), suggesting that the n-6 PUFAs were almost seven times as prevalent as n-3 PUFAs. Meanwhile, in most studies, PUFA was considered as a kind of drug, and not nutrition from food. Thus, a comparison was made between the PUFAs-treated groups with no-PUFAs–cultured groups, without regard to daily PUFA intake and to differences in dietary pattern.
Previously, we observed that the action of LA on cancer cell growth depends on the type of cancer cells tested and the concentration of the fatty acids supplemented. It was noted that, when cancer cells were exposed to LA at high concentrations (40 μg/ml, 1×10⁴ cells), the growth was inhibited, whereas at lower concentrations (5–10 μg/ml, 1×10⁴ cells), the growth was enhanced in some, if not all, types of cancer cells tested (Das et al., 2002).
In order to clarify the role of LA in the promotion or inhibition of the growth of cancer cells in vitro, we evaluated the effect of the fatty acid on three cell lines: two colorectal cancer cell lines, LoVo (undifferentiated) and Rko (semi-differentiated), and one normal cell line, human umbilical vein endothelial cells (HUVEC). Moreover, in order to illustrate the dietary effect on the LA sensitivity, we also performed pre-treatment with or without LA to determine whether the initial saturation of cancer cells with LA affects their survival.
2. Materials and methods
2.1. Materials
LA was obtained from Sigma (St. Louis, MO, USA). The colorectal cancer cell lines, LoVo and Rko, and normal cell line HUVEC were obtained from Shanghai Institute of Cell Biology, Chinese Academy of Sciences. RPMI-1640 medium and high-glucose Dulbecco’s modified Eagle medium (DMEM) nutrient mixture medium were purchased from GIBCO (Grand Island, NY, USA). All other chemicals were of extra-pure grade or analytical grade.
2.2. Cell culture and treatment
Colorectal cancer cell lines and human normal cell line were cultured in RPMI-1640 medium and high-glucose DMEM nutrient mixture medium, respectively, supplemented with 10% (v/v) fetal bovine serum and 100 U/ml penicillin-streptomycin in a 5% CO2 humidified incubator (Shellab, USA) at 37 °C.
LA was dissolved in 0.1 mol/L NaOH and diluted to give a final concentration of 20 mmol/L. Then the final concentration of NaOH in the fatty acid solution was ≤0.005 mol/L. Stock solutions were filter-sterilized and diluted with cell culture media for use (Shen et al., 2007).
Both the cancer cells and HUVEC were treated with LA in two different ways: (1) In the first group, the cells were cultured in the medium alone for 24 h prior to treatment with different doses of LA; (2) In the second group, the cells were pre-incubated with medium containing 100 µmol/L LA for 24 h, followed by treatment with different doses of LA as was done in the first group.
2.3. Cell growth and viability assay
Cell proliferation was assessed using methyl thiazolyl tetrazolium (MTT) assay. At different time intervals after incubation with LA, the number of viable cells grown in a 96-well plate was estimated by adding 20 µl of MTT solution (5 mg/ml in phosphate buffered saline (PBS)). After 4 h of incubation at 37 °C, the stain was diluted with 150 ml of dimethyl sulphoxide (DMSO). The absorbance in each well was then measured with a microplate reader (Thermal Lab System, Finland) at 492 nm, and viability of cells in each well was presented as percentage of the control (Shen et al., 2007).
2.4. Measurement of cell membrane permeability
Cells (about 1×10⁶ cells/ml) were collected by centrifugation at 1500×g for 5 min after treatment, and resuspended in 200 μl PBS. Then 100 ng propidium iodide (PI) was added. Upon incubation in the dark (15 min at room temperature or 30 min at 4 °C), the samples were washed with 300 μl PBS twice. The cells were then resuspended in 200 μl PBS for analysis. Fluorescence intensity was carried out on a multifunctional microplate reader (SpectraMax M5, Molecular Devices, USA), and the corresponding fluorescence intensity was calculated as F sample/F CK, where F sample and F CK are the intensities of the sample and control, respectively (Zhen et al., 2009).
2.5. Measurement of cell membrane fluidity
Treated cells were collected and resuspended at a final protein concentration of 0.75 mg/ml in PBS (detected and corrected with Bradford protein analysis kit, Sangon, Shanghai, China). Samples were incubated with 1,6-diphenyl-1,3,5-hexatriene (DPH) for 15 min in the dark at room temperature to allow complete incorporation of the probe into the membranes. Fluorescence measurements were performed on a fluorescence spectrophotometer (HITACHI F-4600, Hitachi Co., Ltd., Japan). The excitation and emission wavelengths for DPH were selected with monochromators set to 360 and 450 nm (both 5 nm slit width), respectively. The degree of fluorescence anisotropy (r) was calculated as follows: r=(Ivv−G·Ivh)/(Ivv+2·G·Ivh), where I vv and I vh are the intensities measured with the polarization plane parallel and perpendicular to that of excitation beam, respectively. G is a factor used to correct the instrument’s polarization, which is given by the ratio of vertically to horizontally polarized emission components, when the excitation light is polarized in the horizontal direction (Labieniec et al., 2009).
2.6. Measurement of fatty acid content of the cells by gas chromatography/mass spectroscopy (GC/MS)
Cells (about 1×10⁷ cells/ml) were collected by centrifugation at 1500×g for 5 min at the end of incubation period for fatty acid analysis. The collected cells were extracted with 1 ml of 5% (w/v) hydrochloric acid/methanol and reacted for 3 h at 100 °C under the sealed case. At the end of the reaction, 1 ml double-distilled water was added and mixed well, and then the suspension was extracted for fatty acid esters in 1 ml hexane thrice. At the end of the extraction, the supernatant was collected and mixed with equal amounts of double-distilled water, and then was stood for 5 min to separate into two layers. The clear supernatant solution was collected and dried under nitrogen. The dried extract was dissolved with 100 µl chloroform, and then 1 µl solution was injected into GC-MS (Agilent 6890-GC, 5973N-GC/MSD, Agilent Technologies, USA) containing an HP-5MS capillary column (0.25 mm×30 m, 0.25 μm) with the head pressure set to 60 kPa. The injector and the detector temperatures were both 240 °C; after injection, the column temperature was programmed at 3 °C/min from 150 to 180 °C, and then 5 °C/min from 180 to 240 °C (Lagerstedt et al., 2001).
2.7. Statistical analysis
All results are expressed as mean±standard deviation (SD). Statistic differences were considered significant at P<0.05 or P<0.01. Each treatment was carried out at least three times.
3. Results
3.1. Effect of LA on cell proliferation
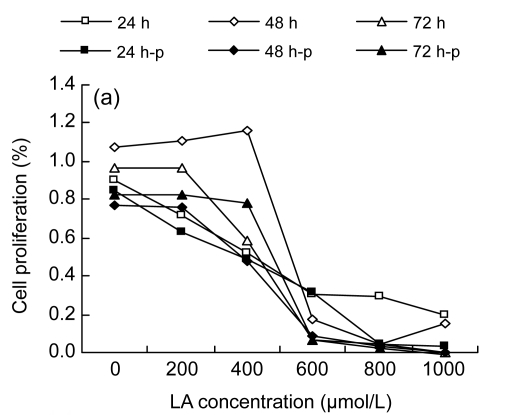
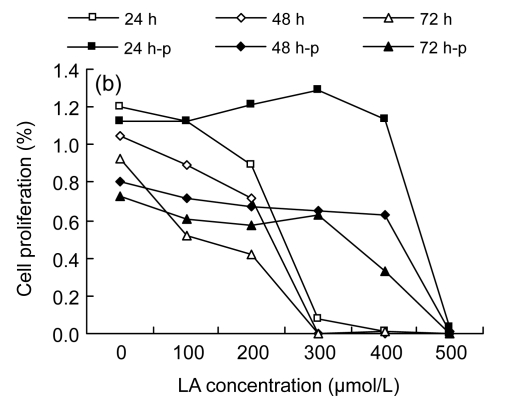
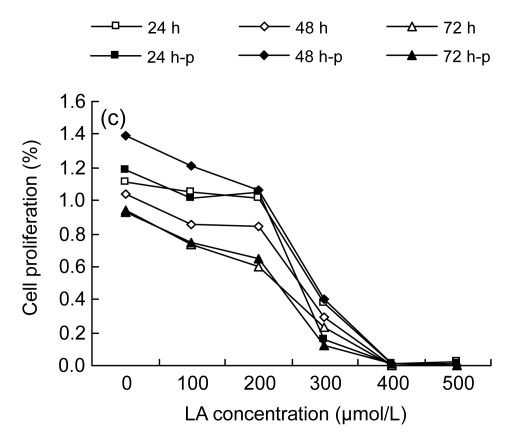
Among the three cell lines studied, the results from MTT assay displayed a similar tendency: LA promoted cell proliferation at low concentrations (100–200 µmol/L), while higher concentrations (≥300 µmol/L) inhibited the cell proliferation (Fig. 1).
Fig. 1.
MTT assay results
(a) Cell proliferation results of HUVEC; (b) Cell proliferation results of LoVo; (c) Cell proliferation results of Rko. 24 h, 48 h, and 72 h: cells were incubated with the medium without LA for 24 h before gradient LA treatment for 24, 48, and 72 h, respectively; 24 h-p, 48 h-p, and 72 h-p: cells were cultured with 100 µmol/L LA for 24 h before gradient LA treatment for 24, 48, and 72 h, respectively
It was noted that different cell lines showed different sensitivities to LA, depending on the type of cell line (Fig. 1). HUVEC were more resistant to the cytotoxic action of LA compared with the two colorectal cancer cell lines, as the apoptosis concentration of LA was beyond 400 µmol/L, though the proliferation at low concentrations (100–200 µmol/L) was not significant. Both LoVo and Rko cells could proliferate when exposed to 100 µmol/L LA, and there was a decrease in proliferation when exposed to 300 µmol/L of LA.
In addition, we studied the effect of pre-incubation of cells with 100 µmol/L LA for 24 h. Pre-incubation of HUVEC followed by further exposure to various doses of LA enhanced the sensitivity to LA. Of the two colorectal cancer lines, LoVo, when pre-incubated with 100 µmol/L LA for 24 h and then treated with different doses of LA, showed significant resistance to the cytotoxic action of LA, even at 300 µmol/L or higher concentrations, while Rko showed increased sensitivity to the cytotoxic action of the additional LA, as did HUVEC.
Based on the results described above, we chose 100 and 300 µmol/L LA treatments, and pre-incubation with 100 µmol/L LA followed by the treatments with 100 and 300 µmol/L LA, for further studies with colorectal cancer cell lines to evaluate the relationship between cell fatty acid composition and cell survival. For this study, HUVEC were taken as the normal control, which were also treated with LA in a similar fashion as was done for cancer cells.
3.2. Effects of LA on cell membrane permeability and membrane fluidity
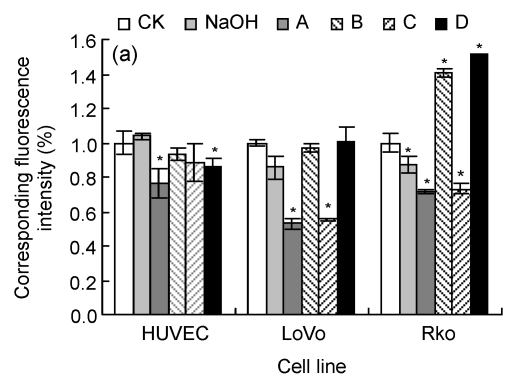
Cell membrane permeability was tested to reflect the injury degree of the cell membrane, as indicated by PI corresponding permeability (Fig. 2a). HUVEC and LoVo showed similar tendencies, as no treatment increased the cell uptake of PI compared with their CK, though a higher concentration of LA could induce cell death. Rko was more sensitive to the added LA with high concentrations, as higher concentration treatment would lead to cell membrane structural changes. We also noticed that pre-incubation would raise the fluorescence intensity of Rko, but not for HUVEC and LoVo.
Fig. 2.
Cell membrane permeability (a) and membrane fluidity (b)
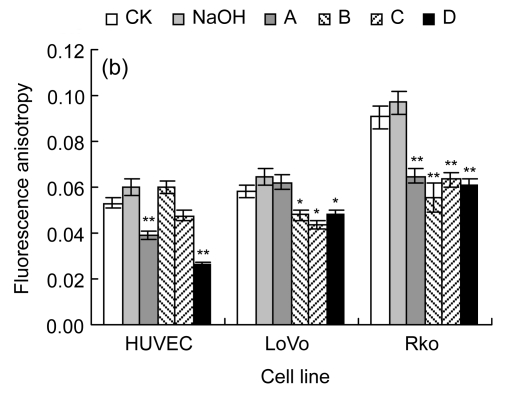
CK: case-control with medium; NaOH: case-control with 0.1 mol/L NaOH. For LoVo and Rko cells, A: 100 µmol/L without LA pre-treatment, B: 300 µmol/L without LA pre-treatment, C: 100 µmol/L with 100 µmol/L LA pre-treatment, D: 300 µmol/L with 100 µmol/L LA pre-treatment; for HUVEC, A: 200 µmol/L without LA pre-treatment, B: 400 µmol/L without LA pre-treatment, C: 200 µmol/L with 100 µmol/L LA pre-treatment, D: 400 µmol/L with 100 µmol/L LA pre-treatment. Data are expressed as mean±SD (n=3).* P<0.05, ** P<0.01 vs. the CK group
Additional LA can change the cell fatty acids composition, and then may lead to variance in membrane fluidity (Fig. 2b). Membrane fluidity of all cell lines increased after treatment with LA, which suggests that the cell fatty acid composition changes mainly occurred in the cell membrane and the additional LA may be stored as phospholipids. The variance in membrane fluidity was equally reflected by the changes in membrane permeability.
3.3. Effect of LA on fatty acid composition of cells
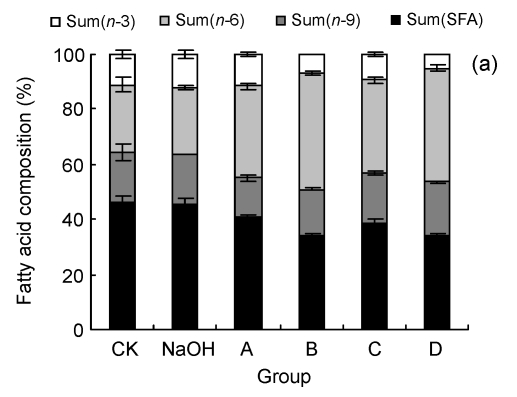
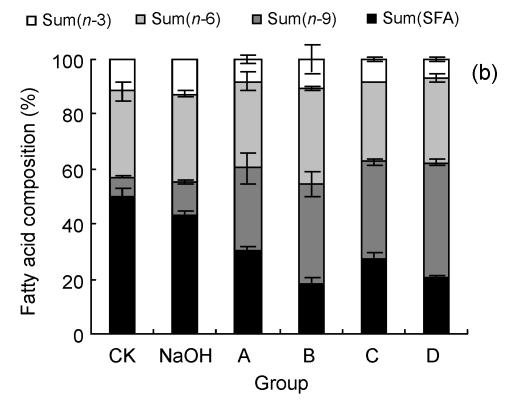
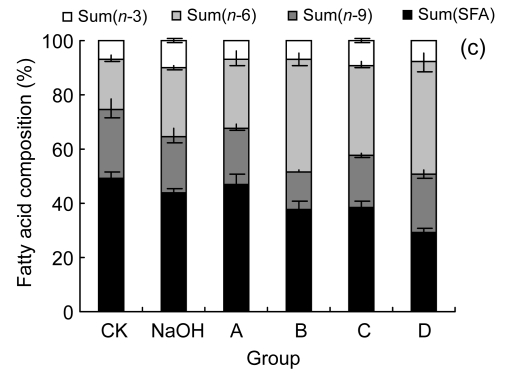
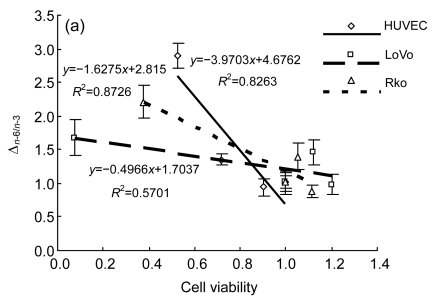
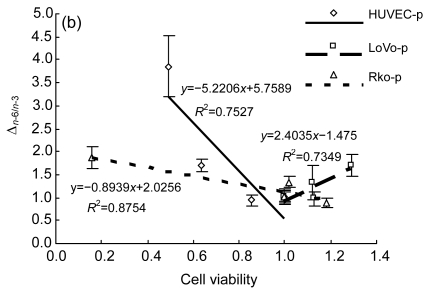
We examined the fatty acid compositions of the three cell lines after six different treatments (Fig. 3). The ratio of saturated fatty acids/unsaturated fatty acids (S/U) and the ratio of n-6 PUFAs/n-3 PUFAs (n-6/n-3) were calculated (Table 1). The rate of change in n-6/n-3 (Δn -6/n-3: the ratio of (n-6/n-3)sample/(n-6/n-3)CK) to cell viability, as indicated by the MTT result, was also performed to show the relationship between cell fatty acid composition and cell survival (Fig. 4).
Fig. 3.
Fatty acid compositions of HUVEC (a), LoVo (b), and Rko (c) cells
Sum(SFA): percent of saturated fatty acids in cell total fatty acids, including tetradecanoate (C14:0), hexadecanoic acid (C16:0), octadecanoic acid (C18:0), eicosanoic acid (C20:0), and docosanoic acid (C22:0); Sum(n-9): percent of n-9 fatty acids in cell total fatty acids, including 9-hexadecenoic acid (C16:1), 9-octadecenoic acid (C18:1), and 9-eicosenoic acid (C20:1); Sum(n-6): percent of n-6 fatty acids in cell total fatty acids, including 9,12-octadecadienoic acid (C18:2), 5,8,11,14-eicosatetraenoic acid (C20:4), 11,14-eicosadienoic acid (C20:2), and 5,11,14,17-eicosatetraenoate (C22:4); Sum(n-3): percent of n-3 fatty acids in cell total fatty acids, including 11,14,17-linolenic acid (C18:3), 5,8,11,14,17-eicosapentaenoic acid (C20:5), and 4,7,10,13,16,19-docosahexaenoic acid (C22:6). CK: case-control with medium; NaOH: case-control with 0.1 mol/L NaOH. For LoVo and Rko cells, A: 100 µmol/L without LA pre-treatment, B: 300 µmol/L without LA pre-treatment, C: 100 µmol/L with 100 µmol/L LA pre-treatment, D: 300 µmol/L with 100 µmol/L LA pre-treatment; for HUVEC, A: 200 µmol/L without LA pre-treatment, B: 400 µmol/L without LA pre-treatment, C: 200 µmol/L with 100 µmol/L LA pre-treatment, D: 400 µmol/L with 100 µmol/L LA pre-treatment. Data are expressed as mean±SD (n=3)
Table 1.
Cell fatty acid composition ratio
| Cell line | Group | S/U | n-6/n-3 | Δn-6/n-3 |
| HUVEC | CK | 0.87±0.06 | 2.19±0.10 | 1.02±0.10 |
| NaOH | 0.83±0.07 | 2.01±0.13 | 0.94±0.12 | |
| A | 0.69±0.02* | 2.89±0.05* | 1.35±0.08 | |
| B | 0.52±0.01** | 6.21±0.12** | 2.90±0.18 | |
| C | 0.63±0.07* | 3.62±0.11** | 1.69±0.13 | |
| D | 0.53±0.01** | 8.25±0.79** | 3.86±0.66 | |
| LoVo | CK | 1.01±0.12 | 2.66±0.16 | 1.01±0.17 |
| NaOH | 0.77±0.04* | 2.58±0.13 | 0.98±0.15 | |
| A | 0.44±0.04** | 3.85±0.11* | 1.46±0.18 | |
| B | 0.23±0.02** | 4.45±0.23** | 1.68±0.27 | |
| C | 0.37±0.04** | 3.48±0.48* | 1.32±0.37 | |
| D | 0.25±0.01** | 4.47±0.19** | 1.69±0.24 | |
| Rko | CK | 0.96±0.09 | 2.75±0.14 | 1.01±0.14 |
| NaOH | 0.79±0.03* | 2.40±0.06 | 0.88±0.09 | |
| A | 0.90±0.14 | 3.83±0.19** | 1.40±0.20 | |
| B | 0.60±0.08** | 6.04±0.17** | 2.21±0.25 | |
| C | 0.62±0.06** | 3.66±0.07** | 1.34±0.13 | |
| D | 0.41±0.04** | 5.13±0.22** | 1.87±0.25 | |
S/U: the ratio of saturated fatty acids/unsaturated fatty acids; n-6/n-3: the ratio of n-6 PUFAs/n-3 PUFAs; Δn -6/n-3: the ratio of (n-6/n-3)sample/(n-6/n-3)CK; CK: case-control with medium; NaOH: case-control with 0.1 mol/L NaOH. For LoVo and Rko cells, A: 100 µmol/L without LA pre-treatment, B: 300 µmol/L without LA pre-treatment, C: 100 µmol/L with 100 µmol/L LA pre-treatment, D: 300 µmol/L with 100 µmol/L LA pre-treatment; for HUVEC, A: 200 µmol/L without LA pre-treatment, B: 400 µmol/L without LA pre-treatment, C: 200 µmol/L with 100 µmol/L LA pre-treatment, D: 400 µmol/L with 100 µmol/L LA pre-treatment. Data are expressed as mean±SD (n=3)
P<0.05, vs. the CK group
P<0.01 vs. the CK group
Fig. 4.
n-3/n-6 balance with cell viability
(a) HUVEC, LoVo, Rko: three cell lines were incubated with the medium without LA for 24 h before gradient LA treatment for 24 h, respectively; (b) HUVEC-p, LoVo-p, Rko-p: three cell lines were cultured with 100 µmol/L LA for 24 h before gradient LA treatment for 24 h, respectively
All the three cell lines showed a similar, if not identical, tendency to the treatment of LA. Compared with the control, at relatively low concentrations of LA (100–200 µmol/L), the percentage of total unsaturated fatty acids in the cells increased and simultaneously the ratio of n-6/n-3 was enhanced, while for the treatment with higher concentrations of LA (≥300 µmol/L), the ratio of S/U decreased. This could be attributed to the ability of the cell membrane to retain higher proportion of n-6 PUFAs. There is evidence that HUVEC pre-incubated with 100 µmol/L LA showed a lower percentage of n-6 PUFAs, though the composition was significantly different from the control, for which the ratio of n-6/n-3 increased and S/U decreased. Δn -6/n-3 to cell viability was consistent with a linear relationship following different treatments, except that LoVo pre-culture with LA revealed that the pre-incubated cells could survive with a high concentration of LA, which may relate to the cell differentiation status.
4. Discussion
It is known that n-3 PUFAs and n-6 PUFAs follow similar metabolic pathways, leading to the formation of two arrays of eicosanoids that have opposite functions (Das, 2006a; 2006b; Funahashi et al., 2008). PUFAs of n-3 series seem to possess anti-cancer actions and have been shown to inhibit cell proliferation and induce apoptosis, whereas the products of n-6 PUFAs are believed to enhance cancer cell proliferation (Larsson et al., 2004; Kelavkar et al., 2006a). There is also evidence to suggest that the balance between n-6 to n-3 might influence cancer cell proliferation or apoptosis (Abumrad et al., 1998). However, under normal physiological conditions, the percentage of n-3 PUFAs was much lower compared with n-6 PUFAs in the cells (Larsson et al., 2004), which indicates that supplying additional n-3 fatty acids is easier to change the ratio of n-6/n-3 PUFAs in the cells than adding the same amounts of n-6 PUFAs to the cells. The results of the present study suggest that, as n-6 PUFA, LA could possess anti-cancer action in vitro with relatively less harmful action on normal cells by altering the n-6/n-3 balance in the cells and inducing colorectal cancer cell death.
There are two main pathways by which LA may affect the cells: (1) etherification into phospholipids to influence the membrane fluidity, and (2) providing energy for cell cycle, while a part of LAs would be transferred into 9/13-hydroxyoctadecadienoic acid (9/13-HODE) by the action of 15-lipoxygenase (15-LOX) enzyme, and become elongated and desaturated into long chain PUFAs by the action of elongases and desaturases (Kelavkar et al., 2006a; 2006b; Guo et al., 2006).
An increase in cell membrane permeability would provide more chances for anti-cancer elements to pass though the cell membrane and maybe even intra-cellular membranes, such as the mitochondrial membrane (Rasmussen et al., 2010). The detection of cell membrane permeability indicated that HUVEC and LoVo had similar tendencies with additional LA, though the membrane permeability of the low concentration treatment was much higher than that of the high concentration treatment within the same group. Meanwhile, Rko was more sensitive to the added LA at high concentrations in both LA normal treatment and LA pre-treatment groups. This may suggest that HUVEC and LoVo can keep their cell membrane integrity, while Rko may lose membrane selectivity, which may also help in LA in-take, further enhancing cellular LA toxicity.
Membrane fluidity was related to the fatty acid composition as it changed with the ratio of S/U. Membrane fluidity of all three cell lines increased after treatment with LA, which suggests that the cell fatty acid composition changes mainly occurred in the cell membrane, and additional LA may be stored as phospholipids. The variance of membrane fluidity was similar to changes in membrane permeability. In pre-incubated groups, both HUVEC and Rko increased the sensitivity to the additional LA, while undifferentiated cell line LoVo showed a higher tolerance to LA, either at low or high concentration, with the permeability of the cell membrane remaining within a tolerable range, which suggests that LoVo may have different metabolic paths when exposed to LA.
To some extent, n-6/n-3 may reflect the cell accumulation of LA and the change of n-6/n-3 was calculated as Δn -6/n-3. The varied changes in the fatty acid compositions of all three different cell types treated with LA in the present study suggest that different responses to the additional LA of different cells may be related to the cell differentiation status, as undifferentiated cells LoVo may have the strongest survivability in response to the environmental LA concentration changes. The fatty acid composition changes occurred in differentiated cells Rko most obviously, then to a degree in undifferentiated cells LoVo, while normal cell line HUVEC could adjust the intracellular fatty acid ratio with less harm. LA can be transformed into n-9 monounsaturated fatty acid in LoVo, which suggests that LoVo can take in LA and reconstruct fatty acid composition to minimize the effect of additional LA. HUVEC and Rko lack this function. The analysis of cell viability to Δn -6/n-3 also suggests that normal cells HUVEC can resist fatty acid composition changes, while the two colorectal cancer cells were more sensitivity. And with pre-incubation of LA, undifferentiated cell line LoVo could adjust the normal metabolic pathway to reduce the toxicity of added LA.
5. Conclusions
The results indicated that the three cell lines have varied ways to metabolize LA. For instance, Rko cells appear to be able to store LA in the cell membrane with an increase in membrane permeability and fluidity, while LoVo cells seem to desaturate and elongate the LA, which might be one of the reasons for the tolerance to the cytotoxic action of LA when they were pre-incubated with the fatty acids. The analysis of cell n-6/n-3 ratio to cell viability indicates that the ratio of n-6/n-3 was related to cell survival, either in normal treated or pre-cultured group, except for pre-cultured LoVo, which also suggests that LA-induced cell death is related to both the LA concentration and cell tumorous stage. The molecular mechanisms of LA metabolism, especially with different cell differentiated statuses, need further investigation, especially regarding whether n-6 fatty acids have an anti-tumor function.
Acknowledgments
We are thankful to the 985-Institute of Agrobiology and Environmental Sciences of Zhejiang University, China for use of the experimental equipment.
References
- 1.Abumrad N, Harmon C, Ibrahimi A. Membrane transport of long-chain fatty acids: evidence for a facilitated process. J Lipid Res. 1998;39(12):2309–2318. [PubMed] [Google Scholar]
- 2.Bégin ME, Das UN, Ells G, Horrobin DF. Selective killing of human cancer cells by polyunsaturated fatty acids. Prostaglandins Leukot Med. 1985;19(2):177–186. doi: 10.1016/0262-1746(85)90084-8. [DOI] [PubMed] [Google Scholar]
- 3.Bégin ME, Das UN, Ells G. Cytotoxic effects of essential fatty acids (EFA) in mixed cultures of normal and malignant human cells. Progr Lipid Res. 1986;25(1):573–576. doi: 10.1016/0163-7827(86)90116-5. [DOI] [Google Scholar]
- 4.Bégin ME, Ells G, Das UN, Horrobin DF. Differential killing of human carcinoma cells supplemented with n-3 and n-6 polyunsaturated fatty acids. J Natl Cancer Inst. 1986;77(5):1053–1062. [PubMed] [Google Scholar]
- 5.Berquin IM, Min Y, Wu R, Wu J, Perry D, Cline JM, Thomas MJ, Thornburg T, Kulik G, Smith A, et al. Modulation of prostate cancer genetic risk by omega-3 and omega-6 fatty acids. J Clin Invest. 2007;117(7):1866–1875. doi: 10.1172/JCI31494. [DOI] [PMC free article] [PubMed] [Google Scholar]
- 6.Chapkin RS, Seo J, McMurray DN, Lupton JR. Mechanisms by which docosahexaenoic acid and related fatty acids reduce colon cancer risk and inflammatory disorders of the intestine. Chem Phys Lipids. 2008;153(1):14–23. doi: 10.1016/j.chemphyslip.2008.02.011. [DOI] [PMC free article] [PubMed] [Google Scholar]
- 7.Conquer JA, Martin JB, Tummon I, Watson L, Tekpetey F. Fatty acid analysis of blood serum, seminal plasma, and spermatozoa of normozoospermic vs. asthenozoospermic males. Lipids. 1999;34(8):793–799. doi: 10.1007/s11745-999-0425-1. [DOI] [PubMed] [Google Scholar]
- 8.Das UN. Tumoricidal action of cis-unsaturated fatty acids and its relationship to free radicals and lipid peroxidation. Cancer Lett. 1991;56(3):235–243. doi: 10.1016/0304-3835(91)90008-6. [DOI] [PubMed] [Google Scholar]
- 9.Das UN. Essential fatty acids–a review. Curr Pharm Biotechnol. 2006;7(6):467–482. doi: 10.2174/138920106779116856. [DOI] [PubMed] [Google Scholar]
- 10.Das UN. Essential fatty acids: biochemistry, physiology, and pathology. Biotechnol J. 2006;1(4):420–439. doi: 10.1002/biot.200600012. [DOI] [PubMed] [Google Scholar]
- 11.Das UN, Swamy SMK, Tan BKH. Effect of essential fatty acids and their metabolites on human lymphocytic leukemia and human colon adenocarcinoma lymph node cells in vitro. Nutrition. 2002;18(4):348–350. doi: 10.1016/S0899-9007(02)00738-4. [DOI] [PubMed] [Google Scholar]
- 12.Funahashi H, Satake M, Hasan S, Sawai H, Newman RA, Reber HA, Hines OJ, Eibl G. Opposing effects of n-6 and n-3 polyunsaturated fatty acids on pancreatic cancer growth. Pancreas. 2008;36(4):353–362. doi: 10.1097/MPA.0b013e31815ccc44. [DOI] [PubMed] [Google Scholar]
- 13.Guo W, Huang NS, Cai J, Xie WS, Hamilton JA. Fatty acid transport and metabolism in HepG2 cells. Am J Physiol Gastrointest Liver Physiol. 2006;290(3):G528–G534. doi: 10.1152/ajpgi.00386.2005. [DOI] [PubMed] [Google Scholar]
- 14.Hammamieh R, Chakraborty N, Miller SA, Waddy E, Barmada M, Das R, Peel SA, Day AA, Jett M. Differential effects of omega-3 and omega-6 fatty acids on gene expression in breast cancer cells. Breast Cancer Res Treat. 2007;101(1):7–16. doi: 10.1007/s10549-006-9269-x. [DOI] [PubMed] [Google Scholar]
- 15.Ip C. Controversial issues of dietary fat and experimental mammary carcinogenesis. Prev Med. 1993;22(5):728–737. doi: 10.1006/pmed.1993.1067. [DOI] [PubMed] [Google Scholar]
- 16.Kelavkar UP, Hutzley J, Dhir R, Kim P, Allen KGD, Mchugh K. Prostate tumor growth and recurrence can be modulated by the ω-6:ω-3 ratio in diet: athymic mouse xenograft model simulating radical prostatectomy. Neoplasia. 2006;8(2):112–124. doi: 10.1593/neo.05637. [DOI] [PMC free article] [PubMed] [Google Scholar]
- 17.Kelavkar U, Lin Y, Landsittel D, Chandran U, Dhir R. The yin and yang of 15-lipoxygenase-1 and delta-desaturases: dietary omega-6 LA metabolic pathway in prostate. J Carcinog. 2006;5(1):9. doi: 10.1186/1477-3163-5-9. [DOI] [PMC free article] [PubMed] [Google Scholar]
- 18.Klurfeld DM, Bull AW. Fatty acids and colon cancer in experimental models. Am J Clin Nutr. 1997;66(6):1530S–1538S. doi: 10.1093/ajcn/66.6.1530S. [DOI] [PubMed] [Google Scholar]
- 19.Kumar SG, Das UN. Cytotoxic action of alpha-linolenic and eicosapentaenoic acids on myeloma cells in vitro. Prostaglandins Leukot Essent Fatty Acids. 1997;56(4):285–293. doi: 10.1016/S0952-3278(97)90572-X. [DOI] [PubMed] [Google Scholar]
- 20.Labieniec M, Przygodzki T, Čársky J, Malinska D, Rysz J, Watala C. Effects of resorcylidene aminoguanidine (RAG) on selected parameters of isolated rat liver mitochondria. Chem Biol Interact. 2009;179(2-3):280–287. doi: 10.1016/j.cbi.2008.11.005. [DOI] [PubMed] [Google Scholar]
- 21.Lagerstedt SA, Hinrichs DR, Batt SM, Magera MJ, Rinaldo P, McConnell JP. Quantitative determination of plasma C8–C26 total fatty acids for the biochemical diagnosis of nutritional and metabolic disorders. Mol Genet Metab. 2001;73(1):38–45. doi: 10.1006/mgme.2001.3170. [DOI] [PubMed] [Google Scholar]
- 22.Larsson SC, Kumlin M, Ingelman-Sundberg M, Wolk A. Dietary long-chain n-3 fatty acids for the prevention of cancer: a review of potential mechanisms. Am J Clin Nutr. 2004;79(6):935–945. doi: 10.1093/ajcn/79.6.935. [DOI] [PubMed] [Google Scholar]
- 23.Rasmussen N, Andersen JH, Jespersen H, Mouritsen OG, Ditzel HJ. Effect of free fatty acids and lysolipids on cellular uptake of doxorubicin in human breast cancer cell lines. Anti-cancer Drugs. 2010;21(7):674–677. doi: 10.1097/CAD.0b013e32833c2cf7. [DOI] [PubMed] [Google Scholar]
- 24.Shen SR, Yu HN, Chen P, Yin JJ, Xiong YK. Fatty acids in tea shoots (Camellia sinensis (L.) O. Kuntze) and their effects on the growth of retinal RF/6A endothelial cell lines. Mol Nutr Food Res. 2007;51(2):221–228. doi: 10.1002/mnfr.200600147. [DOI] [PubMed] [Google Scholar]
- 25.Zhen YZ, Lin YJ, Li Y, Zhen YS. Lidamycin shows highly potent cytotoxic to myeloma cells and inhibits tumor growth in mice. Acta Pharm Sin. 2009;30(7):1025–1032. doi: 10.1038/aps.2009.75. [DOI] [PMC free article] [PubMed] [Google Scholar]


