Abstract
Mental imagery generation is essential in the retrieval and storage of knowledge. Previous studies have indicated that the holistic properties of mental imagery generation can be evaluated more easily than the partial properties. However, the relationship between partial and holistic mental imagery generations has not been clearly demonstrated. To address this issue, we designed a task to investigate the changes in the spectrum of the electroencephalogram (EEG) during partial or holistic imagery generation. EEG signals were obtained from 18 healthy subjects, and a statistical measure of spectral dynamics between two EEG signals in per frequency band was performed. Additionally, a bicoherence spectrum analysis was used to detect the phase coupling within these two imagery conditions. Our results indicated that EEG of the partial imagery appeared earlier and stronger than that of the holistic imagery in the theta (5–8 Hz) range in a time window around 220 to 300 ms after cue onset, and a slight decrease in the alpha (8–12 Hz) band was observed at around 270 ms. The scalp topography of these changes in the theta and alpha bands distributed overall significantly in the frontal and central-temporal areas. The significant phase coupling within two conditions was remarkable at high frequency. From these results, we infer that there are complex relations between partial and holistic imageries. The generation of partial mental imagery is not a subprocess of holistic imagery, but it is relevant to holistic imagery and requires correct modification from the holistic information.
Keywords: Imagery generation, Electroencephalogram (EEG) dynamics, Holistic-partial processing
1. Introduction
Mental imagery is an important topic in both classical and modern psychology, as it is central to the study of knowledge. The generation of mental imagery is usually defined as a cognitive process producing a transient internal visual representation of an object through the reactivation of information stored in long-term memory (Tippett, 1992). Previous studies have investigated different kinds of mental imagery, such as general, specific, contextual, and episodic autobiographical (de Beni and Pazzaglia, 1995; Cornoldi and Rossana, 1998), but the relationship between partial and holistic mental imagery generations is still poorly understood. Some visual perception studies, which share the common problem of modality-specific mechanisms and similar information processing with imagery, have shown that a subject evaluates holistic properties more easily than partial properties (Shepard and Cooper, 1982; Farah, 1988; Kosslyn, 1994). Additional experiments have been designed to investigate both visual perception and mental imagery, and have proved that the identification of holistic information is more important than that of partial information during mental imagery generation (Ganis et al., 2004; Låg et al., 2006; Thomas and Forde, 2006).
This is not surprising: the holistic information, as the high-level properties, is more explicitly present, while the partial properties are buried in the holistic properties. However, what is of most relevance to mental imagery is retrieving the partial information from memory and defining the relationship between partial and holistic properties. Some study results have suggested that holistic properties might be retrieved before partial properties, but other study results have suggested that mental imagery also preserves partial features, which can be retrieved directly from memory (Peterson et al., 1992). Furthermore, most of the research results mentioned above were only based on behavioral methods. It is difficult for us to know more about the cortical process during the holistic and partial imagery generations and the possible relationship between them. To better understand the process of mental imagery generation, in the present study, we used electroencephalogram (EEG) to provide additional spatio-temporal information.
The EEG is a widely accepted method for obtaining specific information on the levels of cortical information processing and changes that occur during unconsciousness or various states of conscious awareness (Kotchoubey et al., 2005). Occurring as cognition processing, different EEG methods have been developed to quantify the difference in the frequency components of the EEG signal (Jennett et al., 2001; Borthwick and Crossley, 2004). von Stein and Sarnthein (2000) investigated the dynamics in the frequency components of the EEG signal during working memory retention and mental imagery. Their results showed specific EEG characters in processing internal mental context and proved that EEG dynamics could indicate the cortical process of information during imagery processing.
In the present study, using EEG dynamics analysis, we investigated the cortical information process of partial and holistic properties during mental imagery generation. We firstly intended to determine which EEG spectral components would be involved in the mental imagery processing and whether there were any different characteristics of regional spectral field powers in both states. Then a bicoherence spectrum analysis (Li et al., 2007a; 2007b) was used to illustrate the interaction dynamics during two imagery conditions. Finally, the relationship between the processes of holistic and partial properties in imagery is discussed.
2. Materials and methods
2.1. Subjects
Eighteen healthy students (10 males, 8 females, age 21–26 years) from Dalian University of Technology participated in this study. All subjects were right-handed, had no current or past neurological or psychiatric illness, and had normal or corrected-to-normal vision. In addition, all subjects signed an informed consent and were paid at the end of the experiment.
2.2. Stimuli
Subjects were seated in a comfortable armchair, monitored within an electrically-shielded room under dim conditions of artificial lighting. We prepared 60 gray line drawings of common and emotionally neutral objects that contained a very distinct portion for the partial properties. Objects were presented on a black background. Two sets of “cue” words (“partial” vs. “holistic”) were used for this study. The visual contrast of the “cue” words was 15% in order to reduce brain activation that would be elicited by stimuli in the visual cortex during perception (Ganis et al., 2004; Qiu et al., 2007). The words were presented in the center of the white foreground against a black background (font size 2.6 cm×2.5 cm, corresponding to a visual angle of 3.5°). All drawings were displayed twice, associated with either a “partial” or “holistic” cue word. The words were spelled by no more than 2–4 Chinese characters, and words’ frequencies (mean instances per million words) were more than 60%.
2.3. Procedure
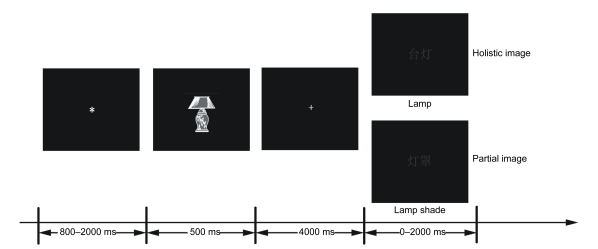
Task presentation was controlled by E-Prime software (Macwhinney et al., 1997), and displayed on a 17-inch (1 inch=2.54 cm) liquid crystal display (LCD) monitor. Prior to the EEG session, we gave the participants a hard copy album and asked them to observe the drawing stimuli during preparation for the experiment. The structure of each trial is illustrated in Fig. 1. First, an asterisk fixation point was presented for a random presentation duration between 800–2000 ms in the center of the screen, and then replaced by the line drawing stimulation, which was presented for 500 ms. After a cross fixation point appeared for 4000 ms, a “cue” word named for the partial or holistic of drawing was presented centrally, and remained on the screen until the participants responded. The participants were asked to generate the mental imagery induced by the “cue” words. They put their right index finger on the keys of SRBOX (Serial Response Box, Psychology Software Tools Inc., USA), and pressed while the imagery was generated in the mind. The total number of trials was 120, and all the trials were accessed stochastically by computer.
Fig. 1.
Schematic of the structure of a trial
Each trial begins with a presentation of a previously studied object image. Participants had to generate a special visual mental image property of the object, after seeing a cue word for the partial or holistic properties of the object. Upon generating imagery, participants performed the judgment as quickly as they could, and their response time (RT) was recorded
2.4. EEG recording
EEG data were collected from 64 channels (10–20 systems, 62 scalps and FCz as reference, AFz as ground) at a sampling rate of 500 Hz with an analog pass band of 0.01 to 100 Hz (Brain Production system, Germany). Input impedance was brought under 5 kΩ by careful scalp preparation. Horizontal and vertical electro-oculograms (EOGs) were concurrently monitored with separate bipolar channels to permit the rejection of blinks and eye-movement artifacts.
2.5. Data analysis
Offline, the vision analyzer software (Version 1.05), was used. EEG data were segmented into epoch of 1200 ms duration (−200 to 1000 ms relative to “cue” word presentation) after bandpass filtering with 0.1–70 Hz and 50 Hz notch filtering. Epochs were then re-referenced to an average reference. Eye movements and blinks were corrected via a regression procedure implemented within the vision analyzer software package. Muscle artifacts were identified and marked in the raw EEG record (maximum amplitude ±70 μV or electrode drifts) by visual inspection.
To investigate the power of oscillatory activity, the EEG signals were convolved with complex Morlet wavelets to yield the wavelet transform (Mallat, 1999). In the wavelet transform, data were exported and analyzed by custom Matlab scripts built on the open source EEGLAB toolbox (http://sccn.ucsd.edu/eeglab) (Delorme and Makeig, 2004). The number of cycles in these wavelets increased smoothly from 3 cycles at 1 Hz to 6 cycles at 23 Hz. To avoid cancelling out non-phase-locked activity in the average, each epoch was subsequently squared for computing power of activity before averaged (Min and Hermann, 2007; Arnfred et al., 2008). Finally, the wavelets were normalized within subjects so that their total energy was equal to unity.
Like most event-related spectra studies (Liu et al., 2006; Leon-Carrion et al., 2008; Min et al., 2008), the mean spectral power of both conditions was calculated separately by averaging across frequencies and epochs in each subject. To investigate the interaction effect between areas, we measured the mean power of three scalp locations, namely frontal (FP1, AF7, AF3, F7, F5, F3, FT7, Fpz, F1, Fz, F2, Fp2, AF4, AF8, F4, F6, F8), central-temporal (FT7, FC5, FC3, T7, C5, C3, TP7, CP5, CP3, FC1, FC2, C1, Cz, C2, CP1, CPz, CP2, FC4, FC6, FT8, C4, C6, T8, CP4, CP6, TP8), and parieto-occipital (P7, P5, P3, PO7, PO3, O1, P1, Pz, P2, POz, Oz, P4, P6, P8, PO4, PO8, O2). A point-wise Wilcoxon-test was used to characterize whether time periods and frequency had reliable differences in both conditions (Khateb et al., 2007). This analysis used Wilcoxon-tests to compare every frequency spectral power of both conditions across all 18 subjects at every time point (from the cue to 1000 ms post-cue) and scalp location. Only the significant P values (<0.05) over 10 consecutive time points (20 ms) were marked.
The bicoherence spectrum analysis involved a method from Li et al. (2007a; 2007b). This method is a time-scale wavelet cross-bispectrum analysis and enables one to quantify the amount of phase coupling. It is better than Fourier-based bicoherence analysis in non-linear systems and can detect short-term non-linear interactions. In this study, we first obtained the grand-average EEG signals of partial and holistic imageries from 18 subjects and then used this method to analyze the interaction within two imagery conditions from 1 to 23 Hz at three locations.
3. Results
For two conditions, the grand-average response time (RT) was (1230±113) ms (for the partial condition) and (1124±167) ms (for the holistic condition), respectively. Although RT was slightly longer in partial imagery than in holistic imagery, analysis of variance (ANOVA) performed on RTs showed no significant difference between the two conditions (F(1,32)=3.579, P=0.067).
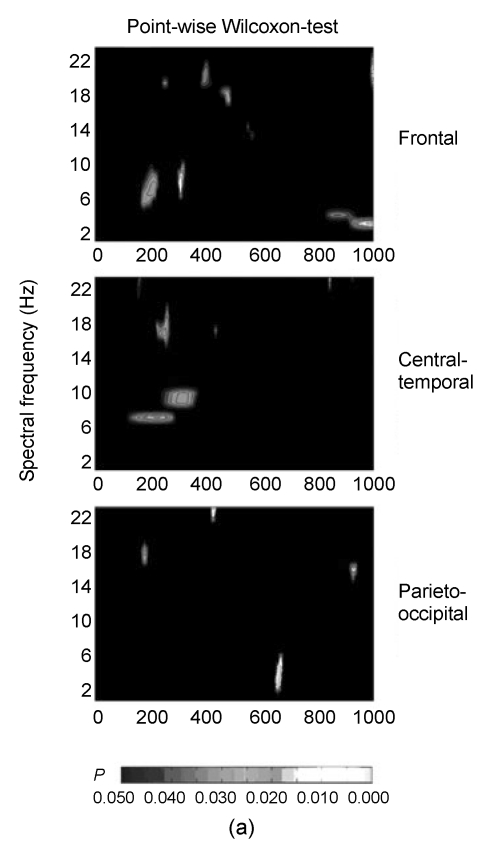
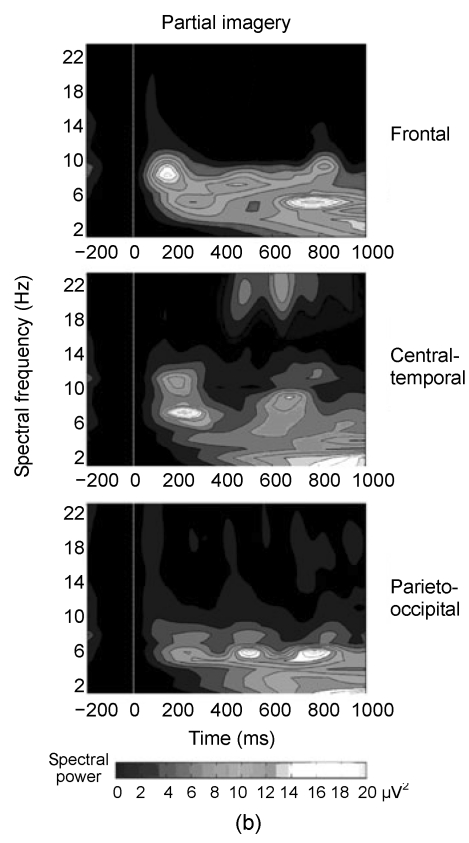
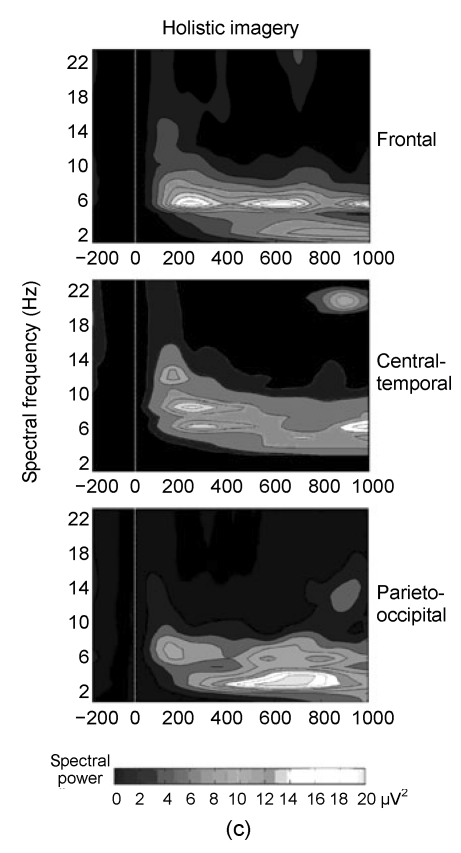
The results of point-wise paired Wilcoxon-tests are shown in Fig. 2a, which depicts the significant P values over time and locations. The first major difference appeared in the theta (5–8 Hz) range at around 220 ms post-cue and lasted up to 300 ms, and the power of theta in the partial imagery was significantly higher than that in the holistic imagery in this time window. The grand-average power spectra of partial and holistic imageries at three locations are shown in Figs. 2b and 2c. Both partial and holistic imageries induced a stronger power spectrum than baseline spectrum in the 180–310 ms time window in theta bands. Other differences were confirmed slightly after about 270 ms in alpha (8–12 Hz) spectra and its time window associated with less alpha power between partial and holistic imageries. From the grand-average power spectra, the partial imagery had lower alpha spectral powers around the 270 ms time window.
Fig. 2.
Comparison of individual spectra in partial imagery with those in holistic imagery from “cue” word onset to 1000 ms later by point-wise Wilcoxon-tests
(a) The significant P values over time and three recording areas; (b, c) Grand mean spectral power changes for the partial and holistic imageries, respectively
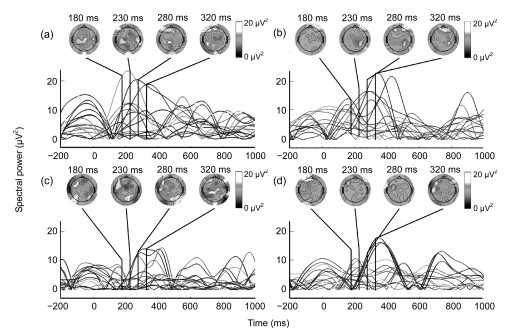
Fig. 3 shows the mean epochs that were averaged from theta (5–8 Hz) and alpha (8–12 Hz) spectra at 18 subjects over frontal, central-temporal, and parieto-occipital cortex locations. The grand-average topographical distributions for the theta and alpha power were illustrated around 180–320 ms with 50 ms time interval, and were presented above the waveform of mean epochs. The configurations of 180–320 ms time windows were made by the time period when partial and holistic imageries revealed significant difference with point-wise Wilcoxon-test procedure. Post-hoc tests were performed using one-sample t-tests at the spectral power of theta and alpha frequencies within three time windows and two imagery conditions across 18 subjects. Mean frequency power and the significance were reported in the Table 1. As shown in these, the burst time of theta power in partial imagery was at 180 ms and lasted to 240 ms, while the holistic condition occurred at 280 ms and lasted to 310 ms. The burst time of the partial imagery in theta was earlier than that of the holistic imagery. Alpha power had a similar burst time for the two imagery conditions, but the partial imagery showed less alpha power than the holistic. As shown in topographical distributions, the theta power was more distributed in pre-frontal location, and alpha power around the left frontal region has more diversity in both two conditions.
Fig. 3.
Mean epochs of each subject in the theta (5–8 Hz) (a, b) and alpha (8–12 Hz) (c, d) spectra for an electrode site (Pz) in partial (a, c) and holistic (b, d) imageries
The topographic maps of grand-mean spectral power changes are illustrated from 180–320 ms as 50 ms interval. The maps were shown from above with the left ear being realistic left
Table 1.
Mean powers of theta and alpha at time windows, locations, and imagery conditions
| Imagery conditions | Time window | Frontal |
Central-temporal |
Parieto-occipital |
|||
| Theta (μV2) | Alpha (μV2) | Theta (μV2) | Alpha (μV2) | Theta (μV2) | Alpha (μV2) | ||
| Partial imagery | 180–230 ms | 13.84* | 3.86 | 16.78 | 6.81* | 8.42 | 2.57 |
| 230–280 ms | 9.36* | 2.13* | 18.36* | 10.55 | 8.14 | 2.23* | |
| 280–320 ms | 11.88 | 1.80* | 13.16 | 7.38 | 9.33 | 0.92 | |
| Holistic imagery | 180–230 ms | 9.72* | 7.35 | 8.20 | 12.48* | 9.34 | 2.54* |
| 230–280 ms | 17.28* | 3.64* | 13.67 | 10.47 | 8.63 | 0.61 | |
| 280–320 ms | 14.33* | 1.60 | 11.67* | 10.05 | 8.30* | 2.36 | |
Significant results (P<0.05) using a one-sample t-tests within 18 subjects
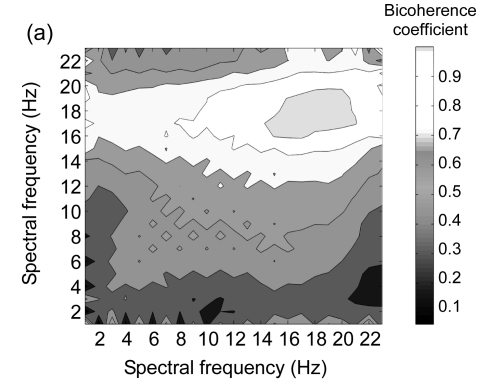
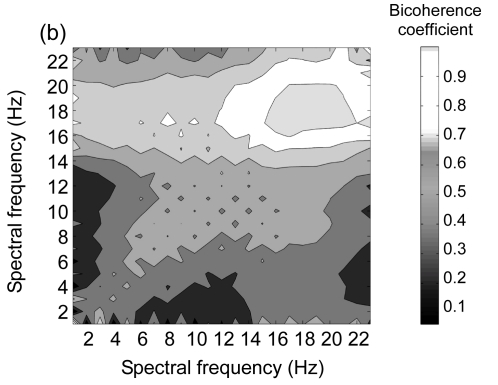
The biocherence spectrum between partial and holistic imageries is illustrated in Fig. 4. Fuscous color represents the significant interaction spectrum. The results show that there was a significant phase coupling within high frequency between the two imagery conditions across three locations. In low frequency, the phase coupling was less marked.
Fig. 4.
Bicoherence spectra between the grand-mean EEG signals of partial and holistic imageries within frequencies from 1 to 23 Hz at three scalp locations
(a) Frontal; (b) Central-temporal; (c) Parieto-occipital
4. Discussion
Our task was designed based on the Rouw et al. (1997)’s tasks with some modifications. In the Rouw’s task, the subjects see a simple picture, and then are asked to generate either the partial or holistic properties of pictures through a “cue” word and to respond as soon as possible once the imagery is generated. With respect to the holistic properties, it seems reasonable to assume that they correspond to the overall object. In our experiment, we prepared some common and emotionally neutral objects (line drawings) that contained a very distinct portion as the partial property stimuli. Another problem is that most experiments associated with mental imagery use auditory means to present “cue” words. However, auditory information is inappropriate for EEG experiment, because this requires more time to present and comprehend the stimulation. Here, we used the “cue” word picture with 15% visual contrast to reduce visual interference (Ganis et al., 2004; Qiu et al., 2007).
The purpose of the present investigation was to determine the dynamic relationship between partial and holistic conditions during visual mental imagery generation. The results indicated that most of the differences between partial and holistic imageries occurred at the theta and alpha bands, and most of the significantly different coherence was found in the frontal and central-temporal areas across subjects. Behaviorally, the analysis of subjects’ RT was not different significantly between two conditions. Consistent with previous research, in terms of response speed, our results showed a trend towards longer RT in the partial rather than in the holistic imagery (Rouw et al., 1997).
In the present study, we found that both partial and holistic imageries could induce a significantly stronger power spectral than baseline in the theta band. Several research groups have identified frontal theta in humans, which increases in power with the working memory load in the n-back and the Sternberg task (Rouw et al., 1997; Jensen and Tesche, 2002). As well, the theta rhythm (4–8 Hz) recently has been implicated in encoding and retrieving information (Caldwell et al., 2003; Srinivasan, 2007). A number of studies have shown that a mental image usually begins with the representation process of an object through the reactivation of information stored in the long-term memory (Tippett, 1992). Therefore, we could consider the changes of theta in the 220–300 ms time window as a memory retrieving process. Additionally, if partial imagery generation was only a process following holistic generation, partial imagery should have a later time of onset of theta bursts than holistic imagery. However, in our study, the time of theta bursts in the partial imagery was earlier and stronger than that in the holistic imagery. This means that during partial imagery generation, the partial properties should be retrieved no later than holistic generation, and not be a subsequent process after holistic imagery. Furthermore, this retrieval induced stronger theta power to complete the detail of mental imagery, for it may encounter a more complex processing to retrieve information from memory. The results support the hypothesis that mental imagery also preserves partial features, and partial imagery could be retrieved directly from memory (Peterson et al., 1992).
The alpha rhythm will be reduced during tasks requiring attention and mental effort. In a previous study on imagery creativity, spectral analysis with EEG in insight studies has found that the insight preparation was associated with less alpha power in the 9–10 Hz range, especially in the mid-frontal cortex and left anterior-temporal cortex, compared with the timeout preparation (Srinivasan, 2007). Additionally, other experiments on working memory have shown that the function of alpha activity is the most possible carrier of top-down information (Min and Hermann, 2007). In our present study, we found that the partial imagery also showed a significant decrease in the alpha bands, indicating that partial mental imagery might contain a creative or modifying process, not a simple memory retrieval process. Therefore, we can state that the partial imagery generation still requires complex interactions with the information of holistic imagery in memory, though it does not need to first generate the holistic imagery.
Wavelet bicoherence can reveal the higher order correlation and quantify non-linear relationships between neuronal oscillations. In this study, we found there was a significant synchronization within high frequency between the two imagery conditions. It has been proposed that high-frequency population signals were mainly associated with more local processes, whereas low-frequency signals were mediated by long-range interactions (von Stein and Sarnthein, 2000; Bruns and Eckhorn, 2004). Our results suggest that the information processes of partial and holistic imageries have similar functional units of cortex in the local areas, whereas the long-range interactions that reflect the cooperation and intercommunion between functional units were not similar.
In conclusion, the present results show that there were significantly different EEG patterns between the partial and holistic mental imageries. The partial imagery involved a memory retrieval process and required a complex modification from the information of holistic imagery, while the holistic imagery was only related to a memory retrieval process. Our study provides more experimental support and expands on theories of mental imagery. Finally, although we analyzed the EEG dynamics between two tasks, the brain spatiotemporal and spectral changes implied by the task were only tentative. Therefore, studies should be performed using source localization, and focus on the given spectra to investigate the different spatio-temporal cortical activation patterns between the two mental imageries.
Footnotes
Project supported by the National Natural Science Foundation of China (No. 60971096) and the National Basic Research Program (973) of China (No. 2006CB504100)
References
- 1.Arnfred SM, Hansen LK, Parnas J, Morup M. Regularity increases middle latency evoked and late induced beta brain response following proprioceptive stimulation. Brain Res Cogn Brain Res. 2008;1218:114–131. doi: 10.1016/j.brainres.2008.03.057. [DOI] [PubMed] [Google Scholar]
- 2.Borthwick CJ, Crossley R. Permanent vegetative state: usefulness and limits of a prognostic definition. NeuroRehabilitation. 2004;19(4):381–389. [PubMed] [Google Scholar]
- 3.Bruns A, Eckhorn R. Task-related coupling from high-to low-frequency signals among visual cortical areas in human subdural recordings. Int J Psychophysiol. 2004;51(2):97–116. doi: 10.1016/j.ijpsycho.2003.07.001. [DOI] [PubMed] [Google Scholar]
- 4.Caldwell JA, Prazinko B, Caldwell JL. Body posture affects electroencephalographic activity and psychomotor vigilance task performance in sleep-deprived subjects. Clin Neurophysiol. 2003;114(1):23–31. doi: 10.1016/S1388-2457(02)00283-3. [DOI] [PubMed] [Google Scholar]
- 5.Cornoldi C, Rossana DB. Memory and Imagery: A Visual Trace is not a Mental Image. In: Martin AC, Susan EG, Cesare C, editors. Theories of Memory. UK: Psychology Press; 1998. pp. 87–110. [Google Scholar]
- 6.de Beni R, Pazzaglia F. Memory for different kinds of mental images: role of contextual and autobiographic variables. Neuropsychologia. 1995;33(11):1359–1371. doi: 10.1016/0028-3932(95)00069-F. [DOI] [PubMed] [Google Scholar]
- 7.Delorme A, Makeig S. An open source toolbox for analysis of single-trial EEG dyanmics including independent components analysis. J Neurosci Methods. 2004;134(1):9–21. doi: 10.1016/j.jneumeth.2003.10.009. [DOI] [PubMed] [Google Scholar]
- 8.Farah MJ. Is visual imagery really visual? Overlooked evidence from neuropsychology. Psychol Rev. 1988;95(3):307–317. doi: 10.1037/0033-295X.95.3.307. [DOI] [PubMed] [Google Scholar]
- 9.Ganis G, Thompson WL, Kosslyn SM. Brain areas underlying visual mental imagery and visual perception: an fMRI study. Cogn Brain Res. 2004;20(2):226–241. doi: 10.1016/j.cogbrainres.2004.02.012. [DOI] [PubMed] [Google Scholar]
- 10.Jennett B, Adams JH, Murray LS, Graham DI. Neuropathology in vegetative and severely disabled patients after head injury. Am Acad Neurol. 2001;56(4):486–490. doi: 10.1212/wnl.56.4.486. [DOI] [PubMed] [Google Scholar]
- 11.Jensen O, Tesche CD. Frontal theta activity in humans increases with memory load in a working memory task. Eur J Neurosci. 2002;15(8):1395–1399. doi: 10.1046/j.1460-9568.2002.01975.x. [DOI] [PubMed] [Google Scholar]
- 12.Khateb A, Abutalebi J, Michel CM, Pegna AJ, Lee-Jahnke H, Annoni JM. Language selection in bilinguals: a spatio-temporal analysis of electric brain activity. Int J Psychophysiol. 2007;65(3):201–213. doi: 10.1016/j.ijpsycho.2007.04.008. [DOI] [PubMed] [Google Scholar]
- 13.Kosslyn SM. Image and Brain: The Resolution of the Imagery Debate. Cambridge, MA: MIT Press; 1994. p. 516. [Google Scholar]
- 14.Kotchoubey B, Lang S, Mezger G, Schmalohr D, Schneck M, Semmler A, Bostanov V, Birbaumer N. Information processing in severe disorders of consciousness: vegetative state and minimally conscious state. Clin Neurophysiol. 2005;116(10):2441–2453. doi: 10.1016/j.clinph.2005.03.028. [DOI] [PubMed] [Google Scholar]
- 15.Låg T, Hveem K, Puud KPE, Laeng B. The visual basis of category effects in object identification: evidence from the visual hemifield paradigm. Brain Cogn. 2006;60(1):1–10. doi: 10.1016/j.bandc.2005.08.002. [DOI] [PubMed] [Google Scholar]
- 16.Leon-Carrion J, Martin-Rodriguez JF, Damas-Lopez J, Martin JMBY, Dominguez-Morales MR. Brain function in the minimally conscious state: a quantitative neurophysiological study. Clin Neurophysiol. 2008;119(7):1506–1514. doi: 10.1016/j.clinph.2008.03.030. [DOI] [PubMed] [Google Scholar]
- 17.Li X, Yao X, Fox J, Jefferys JG. Interaction dynamics of neuronal oscillations analysed using wavelet transforms. J Neurosci Methods. 2007;160(1):178–185. doi: 10.1016/j.jneumeth.2006.08.006. [DOI] [PubMed] [Google Scholar]
- 18.Li X, Cui D, Jiruska P, Fox J, Yao X, Jefferys JG. Synchronization measurement of multiple neuronal populations. J Neurophysiol. 2007;98(6):3341–3348. doi: 10.1152/jn.00977.2007. [DOI] [PubMed] [Google Scholar]
- 19.Liu X, Qi H, Wang SP, Wan MX. Wavelet-based estimation of EEG coherence during Chinese Stroop task. Comput Biol Med. 2006;36(12):1303–1315. doi: 10.1016/j.compbiomed.2005.08.002. [DOI] [PubMed] [Google Scholar]
- 20.Macwhinney B, Cohen J, Provost J. The PsyScope experiment-building system. Spat Vis. 1997;11(1):99–101. doi: 10.1163/156856897X00113. [DOI] [PubMed] [Google Scholar]
- 21.Mallat S. A Wavelet Tour of Signal Processing. San Diego: London Academic Press; 1999. pp. 42–125. [Google Scholar]
- 22.Min BK, Hermann CS. Prestimulus EEG alpha activity reflects prestimulus top-down processing. Neurosci Lett. 2007;422(2):131–135. doi: 10.1016/j.neulet.2007.06.013. [DOI] [PubMed] [Google Scholar]
- 23.Min BK, Park JY, Kim EJ, Kim JI, Kim JJ, Park HJ. Prestimulus EEG alpha activity reflects temporal expectancy. Neurosci Lett. 2008;438(3):270–274. doi: 10.1016/j.neulet.2008.04.067. [DOI] [PubMed] [Google Scholar]
- 24.Peterson MA, Kihlstrom JF, Rose PM, Glisky ML. Mental images can be ambiguous: reconstruals and reference-frame reversals. Mem Cognit. 1992;20(2):107–123. doi: 10.3758/bf03197159. [DOI] [PubMed] [Google Scholar]
- 25.Qiu J, Li H, Liu Q, Zhang QL. Brain mechanisms underlying visual perception and visual mental imagery of Chinese pseudo-characters: an event-related potential study. Brain Res Cogn Brain Res. 2007;1184:202–209. doi: 10.1016/j.brainres.2007.09.068. [DOI] [PubMed] [Google Scholar]
- 26.Rouw R, Kosslyn SM, Hamel R. Detecting high-level and low-level properties in visual images and visual percepts. Cognition. 1997;63(2):209–226. doi: 10.1016/S0010-0277(97)00006-1. [DOI] [PubMed] [Google Scholar]
- 27.Shepard RN, Cooper LA. Mental Images and Their Transformations. Cambridge, MA: MIT Press; 1982. pp. 325–340. [Google Scholar]
- 28.Srinivasan N. Cognitive neuroscience of creativity: EEG based approaches. Methods. 2007;42(1):109–116. doi: 10.1016/j.ymeth.2006.12.008. [DOI] [PubMed] [Google Scholar]
- 29.Thomas R, Forde E. The role of local and global processing in the recognition of living and nonliving things. Neuropsychologia. 2006;44(6):982–986. doi: 10.1016/j.neuropsychologia.2005.09.005. [DOI] [PubMed] [Google Scholar]
- 30.Tippett LJ. The generation of visual images: a review of neuropsychological research and theory. Psychol Bull. 1992;112(3):415–432. doi: 10.1037/0033-2909.112.3.415. [DOI] [PubMed] [Google Scholar]
- 31.von Stein A, Sarnthein J. Different frequencies for different scales of cortical integration: from local gamma to long range alpha/theta synchronization. Int J Psychophysiol. 2000;38(3):301–313. doi: 10.1016/S0167-8760(00)00172-0. [DOI] [PubMed] [Google Scholar]


