

Abstract
Microtubule-based mRNA transport is widely used to restrict protein expression to specific regions in the cell, and has important roles in defining cell polarity, axis determination and for neuronal function. However, the structural basis of recognition of cis-acting mRNA localization signals by motor complexes is poorly understood. We have used NMR spectroscopy to describe the first tertiary structure of an RNA element responsible for mRNA transport. The Drosophila fs(1)K10 signal, which mediates transport by the dynein motor, forms a stem-loop with two double-stranded RNA helices adopting an unusual A′-form conformation with widened, major grooves reminiscent of those in B-form DNA. Structure determination of four mutant RNAs and extensive functional assays in Drosophila embryos indicate that the two spatially registered A′-form helices represent critical recognition sites for the transport machinery. Our study provides important insights into the basis for RNA cargo recognition and reveals a key biological function encoded by A′-form RNA conformation.
Keywords: mRNA localization, microtubules, dynein motor, RNA structure, NMR spectroscopy, Drosophila embryo
In eukaryotes, asymmetric localization of mRNAs plays widespread roles in protein targeting and is crucial for many processes, including patterning of embryonic axes, polarized cell functions and synaptic plasticity1,2. In most cases, mRNAs are localized asymmetrically by directed transport along the cytoskeleton by molecular motors1. Transport of specific mRNAs depends on cis-acting RNA elements commonly located in their 3′ untranslated region (3′UTR). These RNA signals are recognized by trans-acting protein factors, which link the mRNA to the motors. However, the molecular basis underlying the recognition of localizing mRNAs is poorly understood.
An emerging model for elucidating the molecular principles of mRNA localization is the delivery of developmentally important transcripts to the minus-ends of microtubules during early Drosophila development. This process is dynein-dependent and can be accessed by microinjection of in vitro synthesized fluorescent transcripts3,4. Several minus-end-directed transport signals have been mapped in Drosophila mRNAs4-10. These signals are all predicted to adopt stem-loop structures comprising ~ 40-65 nucleotides (nt), but do not share primary sequence or any obvious RNA motifs. Thus, it is unclear what features within any of these mRNAs are recognized by the transport machinery.
We have used NMR spectroscopy to describe the structure of the 44 nt RNA element responsible for dynein-mediated localization of Drosophila fs(1)K10 (K10) transcripts9. This maternal transcript is transported from the nurse cells into the oocyte, where it localizes at the anterior, and its product regulates dorsoventral polarity 9,11. The K10 signal adopts a stem-loop with unexpected structural features. Stacking interactions of purine bases within canonical, double-stranded (ds) RNA helices give rise to base pair inclinations and widened major grooves, consistent with stem regions adopting a so-called A′-form conformation. The results of structural determination of mutant RNAs and functional assays in Drosophila embryos suggest that two spatially registered, widened major grooves represent the binding sites for the transport machinery. The present study also demonstrates that dsRNA with regular base pairs has unappreciated structural complexity capable of mediating selective recognition, and thereby assigns a key biological function to the A′-form RNA conformation.
RESULTS
Structure of the K10 transport and localization signal
To reveal the specific RNA features that mediate recognition by the transport machinery, we used NMR spectroscopy to determine the structure of the Drosophila melanogaster K10 transport and localization signal (TLS), a 44 nt sequence in the K10 3′UTR that is essential for patterning the dorsoventral axis9,10. RNA molecules larger than 30 nucleotides often display substantial resonance overlap, which makes unambiguous resonance assignments impossible12. In the TLS RNA, over 80% of the base paired helices are formed by A-U or U-A Watson-Crick base pairs (Fig. 1a). Nonetheless, resonance overlap could be resolved using a combination of homonuclear and heteronuclear NMR spectroscopy including site-specific deuteration of pyrimidine H-5 protons (Supplementary Fig. 1). The final ensemble of K10 TLS structures is well defined (r.m.s. deviation of 1.15 Å) and both its local and global precision greatly depended on 115 angular restraints derived from experimental residual dipolar couplings (RDCs)13,14 (Fig. 1b, Table 1 and Supplementary Fig. 2a).
Figure 1.
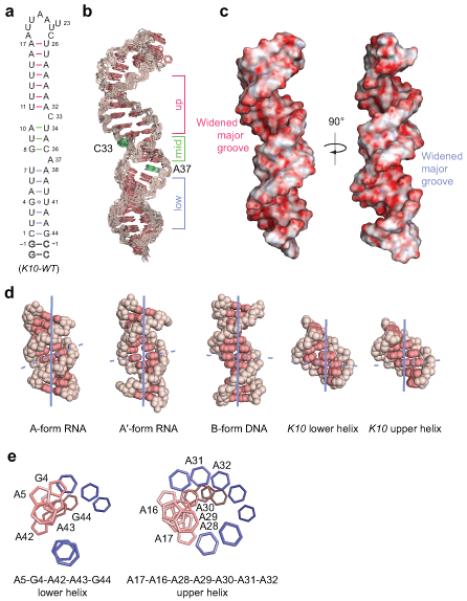
Solution structure of K10 TLS RNA.
(a) Secondary structure of wild-type K10 TLS RNAs. Numbering according to ref.9. Outlined nucleotides were added to improve transcription efficiency. The three helical segments are separated by single nucleotide bulges (C33 and A37). The lower helix (blue) comprises nt 1-7 and 38-44, the middle helix (green) nt 8-10 and 34-36, and the upper helix (red) nt 11-17 and 26-32, respectively.
(b) Heavy-atom superposition of the 12 lowest-energy K10-WT RNAs refined with RDCs. Bases are red and the ribose-phosphate backbone is pink. The three helical regions are indicated beside the structures using the same color scheme as in a. C33 and A37 are shown in green.
(c) Electrostatic surface potential of K10-WT RNA. Both the upper and lower helical regions display widened major grooves with a relative orientation of 90° along the helical axis. The widened major grooves are indicated beside the structures using the same color scheme as in a.
(d) Representative structures of A-form and A′-form dsRNA and B-dsDNA compared to upper and lower helical regions of K10-WT RNA. All helices are shown from the major groove side to visualize the differences in inclination angles and groove widths. The helical axis is shown in blue and the inclination angle of base pairs is indicated by a dashed line. Bases are red and the ribose-phosphate backbone is pink. The PDB IDs are 1SDR (A-form RNA), 413D (A′-form RNA) and 1BNA (B-form DNA).
(e) View down the lower and upper helix of K10-WT RNA displaying continuous stacking of purine bases. Five purine bases in the lower helix (A5-G44) and seven adenine bases in the upper helix (A17-A32) display continuous base-base stacking giving rise to A′-form inclination angles and widened major grooves (see Supplementary Tables 1 and 2). Pyrimidine bases are blue and purine bases are pink; ribose-phosphate backbone and chemical groups on the bases are omitted for clarity. Numbering according to a.
Table 1.
NMR and refinement statistics for K10-WT and mutant K10 RNAs
| WT | au-up | 2gc-up | 2gc-low | A-low | |
|---|---|---|---|---|---|
| NMR distance and dihedral constraints | |||||
| Distance restraintsa | |||||
| Total NOE | 766 | 789 | 745 | 638 | 723 |
| Intra-residue | 284 | 286 | 257 | 193 | 283 |
| Inter-residue | 482 | 503 | 488 | 435 | 440 |
| Sequential (|i − j| = 1) | 376 | 396 | 374 | 331 | 328 |
| Non-sequential (|i − j| > 1 ) | 106 | 107 | 114 | 104 | 112 |
| Hydrogen bonds | 17 | 17 | 17 | 18 | 21 |
| Total dihedral angle restraints | 337 | 338 | 349 | 339 | 339 |
| Base pair | 18 | 18 | 18 | 19 | 19 |
| Sugar pucker | 180 | 180 | 180 | 180 | 180 |
| Backbone | 139 | 140 | 141 | 140 | 140 |
| Total RDCsb | 115 | 100 | 117 | 95 | 103d |
| Structure statistics | |||||
| Violations (mean ± s.d.) | |||||
| Distance constraints (Å) | 0.017±0.0005 | 0.016±0.001 | 0.018±0.001 | 0.019±0.003 | 0.018±0.001 |
| Dihedral angle constraints (°) | 0.73±0.05 | 0.65±0.05 | 0.68±0.05 | 0.94±0.31 | 0.74±0.06 |
| RDCs (Hz) | 1.03±0.05 | 0.89±0.04 | 0.96±0.01 | 0.92±0.1 | 1.1±0.04d |
| Max. dihedral angle violation (°) | 5.8 | 8.1 | 6.9 | 9.6 | 6.7 |
| Max. distance constraint violation (Å) | 0.22 | 0.28 | 0.20 | 0.37 | 0.29 |
| Deviations from idealized geometry | |||||
| Bond lengths (Å) | 0.003±0.00004 | 0.003±0.00004 | 0.004±0.0001 | 0.004±0.00007 | 0.004±0.00003 |
| Bond angles (°) | 0.93±0.001 | 0.91±0.01 | 0.96±0.01 | 0.91±0.01 | 0.95±0.006 |
| Impropers (°) | 0.48±0.006 | 0.41±0.02 | 0.41±0.01 | 0.49±0.06 | 0.48±0.05 |
| Average pairwise r.m.s. deviationc (Å) | |||||
| All RNA heavy | 1.15 | 1.28 | 1.08 | 1.54 | 1.21 |
| Lower helix (nt 1-7 and 38-44) | 0.33 | 0.46 | 0.49 | 0.61 | 0.70 |
| Middle helix (nt 8-10 and 33-37) | 0.30 | 0.62 | 0.53 | 0.70 | 0.62 |
| Upper helix (nt 11-17 and 26-31) | 0.55 | 0.52 | 0.39 | 0.59 | 0.33 |
Only meaningful, nonfixed distance constraints were used.
The axial (Da) and rhombic (R) component of the alignment tensor used in the final structure calculations are Da = −26.43 and R = 0.111 (WT), Da = −28.10 and R = 0.097 (au-up), Da = −31.78 and R = 0.098 (2gc-up), Da = −30.29 and R = 0.132 (2gc-low) and Da = −27.11 and R = 0.034 (A-low), respectively.
Pairwise r.m.s. deviation was calculated among 12 (WT, 200 starting structures), 10 (au-up, 200 starting structures), 12 (2gc-up, 250 starting structures), 10 (2gc-low, 200 starting structures) and 11 (A-low, 400 starting structures) refined structures obtained.
Refinement of A-low also includes a separate set of 47 local RDCs for the lower helix (Da = −15.17 and R = 0.029).
The K10 TLS RNA adopts a stem-loop structure capped by an octanucleotide loop (5′-A(18)UUAAUUC(25)-3′), which displays a compact fold (Supplementary Fig. 3a). The helical part of the TLS can be divided into three regions: an upper helix composed of seven Watson-Crick A-U or U-A base pairs, a middle helix of three Watson-Crick base pairs, flanked at each end by single nucleotide bulges on the 3′ side, and a lower helix consisting of a G-U and six Watson-Crick base pairs (Fig. 1a,b). The two unpaired bases adopt different orientations relative to the helices. The base moiety of C33 resides in the major groove, maintaining the helical twist between the adjacent base pairs, while the base of A37 is stacked in between the middle and the lower helix and increases the helical twist between the adjacent base pairs (Fig. 1b and Supplementary Fig. 3b).
Both the upper and lower helical regions display major grooves that are unusually widened relative to typical A-form RNA, such that the groove widths are reminiscent of B-form DNA (Fig. 1c,d; see also Fig. 3 and Supplementary Tables 1 and 2). This is very surprising in the context of the K10 signal whose double helical regions are composed of Watson-Crick base pairs and a G-U base pair that should maintain A-form helical geometry normally seen in dsRNA15. A-form dsRNA is characterized by a positive inclination angle of the Watson-Crick base pairs relative to the helical axis resulting in a deep and narrow major groove inaccessible for ligand interaction (Fig. 1d). The upper and lower helical regions of the K10 RNA, in contrast, display lower inclination angles and accessible major grooves (Fig. 1b-d and Supplementary Tables 1 and 2), consistent with A′-form RNA conformation previously deduced from X-ray fibre diffraction data15,16 and observed in a crystal structure of a model RNA duplex that includes both non-canonical and Watson-Crick base pairs17. Within helix IV of 5S ribosomal RNA, non-canonical G-A base pairs induce cross-strand purine-purine stacking in adjacent G-U wobble base pairs and thereby A′-form conformation with major groove widths similar to B-form DNA18.
Figure 3.
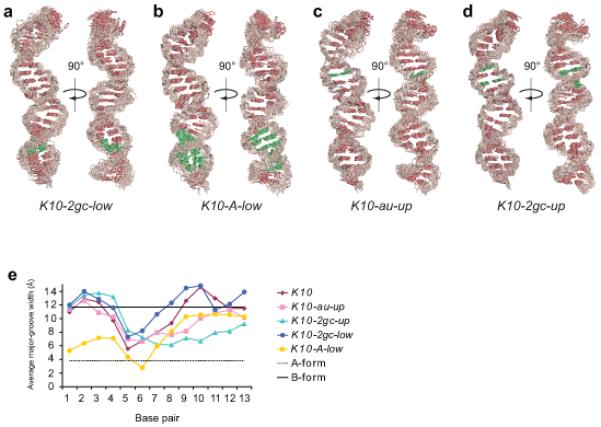
Solution structure of mutant K10 TLS RNAs.
(a-d) Heavy-atom superposition of the lowest-energy mutant K10 RNAs refined with RDCs. Bases are red and the ribose-phosphate backbone is pink. The mutated bases are green and the naming and sequence of each mutant corresponds to Fig. 2a. The widest opening of the major groove in the upper and lower helix is shown in the left and right view (rotation by 90° relative to the helical axis) of each ensemble.
(e) Plot of the major groove width (Å) at each base pair in wild-type and mutant K10 RNAs. Base pairs are indicated corresponding to their 5′ nucleotide numbered according to Fig. 1a. Mean values are displayed for each RNA. Standard errors of the mean for each value are below 1.0 Å and summarized in Supplementary Table 2. Idealized A-form (dotted line) and B-form (solid line) values from ref.17 are also displayed. The corresponding mean base pair inclination angles are listed in Supplementary Table 1.
The two unusually widened grooves in the K10 TLS, the widest parts of which are orientated at 90° to one another (Fig. 1c), derive from continuous stacking interactions of purine bases that lower inclination angles and unwind the helix (Fig. 1e). In the lower helix, low inclination angles are caused by a continuous stack of five purine bases (Fig. 1e) on one side of the helix, which allows formation of four Watson-Crick base pairs, but distorts the G-U base pairing, so that it cannot adopt the wobble conformation with two imino-carbonyl hydrogen bonds usually seen in conventional helical regions (Supplementary Fig. 3c). In the upper helix, there is continuous stacking of seven Watson-Crick base paired adenine bases including a cross-strand stacking between bases of A16 and A28 that positions each of the adenine H-2 protons above the other base moiety (Fig. 1e). This unusual placement results in strong upfield shifts of their H-2 proton resonance frequencies (6.18 and 6.22 p.p.m., respectively) due to the ring current of the neighbouring base (Supplementary Fig. 1b). This resonance frequency alteration provides additional NMR spectroscopic evidence for unusual local adenine-adenine stacking, since adenine H-2 protons in Watson-Crick base pairs usually display proton resonance frequencies between 7-8 p.p.m19. The presence of A′-form conformations of the upper and lower helix in the K10 TLS is further supported by B-form DNA-like circular dichroism (CD) spectra with a peak at 280 nm instead of 260 nm as usually observed for A-form RNA20 (Supplementary Fig. 4a-d).
Spatially registered A′-form helices mediate K10 RNA localization
To investigate the importance of the structural features of the TLS for signal activity, we exploited a robust in vivo assay, which monitors dynein-dependent localization upon injection of fluorescently-labelled, in vitro synthesized RNAs into the cytoplasm of Drosophila blastoderm embryos3. Injected RNAs assemble into particles and those containing an active localization signal are transported within ~ 6 min to the apical cytoplasm, the site of microtubule minus-end nucleation21. RNA species differentially regulate the persistence of minus-end-directed movement on microtubules by controlling the average number of the Egalitarian (Egl), Bicaudal-D (BicD) proteins and, possibly, dynein molecules assembled on the transported particles22.
We examined the activity of mutant K10 TLSs within the context of a ~ 2300 nt fragment of the K10 transcript that depends on the TLS for efficient, apical localization23 (Table 2 and Fig. 2a,b; wild-type (WT) versus scrambled). Replacing the octaloop with a stable UUCG tetraloop closed by a C-G base pair24 had no discernible affect on the efficiency of apical K10 localization (Table 2 and Supplementary Fig. 5). Thus, the loop is not a mediator of signal activity.
Table 2.
Localization efficiency of wild-type and mutant K10 TLS RNAs
| Transcripta | Localization efficiencyb | Transcripta | Localization efficiencyb |
|---|---|---|---|
| WT | ++ (47) | 2cg-up (A′/A′) | ++ (18) |
| scrambled c | − (60) | A-low-2cg-up (A/A′) | + (31) |
| tetraloop | ++ (64) | A-low-h44-up (A/A′) | + (57) |
| 2gc-low (A′/A′) d | ++ (19) | h44-up (A′/A′) | + (38) |
| A-low (A/A′) | + (83) | ΔC33 | + (55) |
| A-up (A′/A) | + (58) | ΔA37 | + (33) |
| A-low-A-up (A/A) | − (33) | ΔC33+ΔA37 | − (30) |
| au-up (A′/A′) | ++ (29) | C33A e | + (29) |
| A-low-au-up (A/A′) | + (30) | C33U | ++ (14) |
| 2gc-up (A′/int) | ++ (30) | C33G | ++ (23) |
| 2gc-low-2gc-up (A′/int) | ++ (29) | A37U | ++ (22) |
| A-low-2gc-up (A/int) | − (75) | A37C | ++ (23) |
| 2gc-low-au-up (A′/A′) | ++ (26) | A37G | ++ (15) |
| 2gc-low-A-up (A′/A) | + (75) | C33A+A37C | ++ (23) |
| 5cg-up (A′/A′) | ++ (16) | ΔA37+gcf | ++ (46) |
| A-low-5cg-up (A/A′) | + (18) | ΔC33+gcf | + (28) |
++, strong localization; + weak localization; −, no localization. See Online Methods for more details of scoring system. Number of injected embryos is shown in parentheses.
This is a randomized version of the constituent bases of the 44 nt K10 TLS which is predicted not to form extensive secondary structure (5′-UUUAUACUCAUAUAUUUAUUAAUGUAAUUAAAUCUAGAACAAUG-3′).
For mutants designed to interfere with stacking interactions, the determined, or predicted, helical geometries (lower helix/upper helix) are shown in parentheses as follows: A′, widened major groove (A′-form); A, narrow major groove (A-form); int, intermediate groove width between A′-form and A-form.
In blind experiments, the C33A mutant was consistently scored as slightly more active than ΔC33.
Residue C33 or A37 are deleted and an additional G-C base pair is inserted in the middle helix above the G8-C36 base pair.
Figure 2.
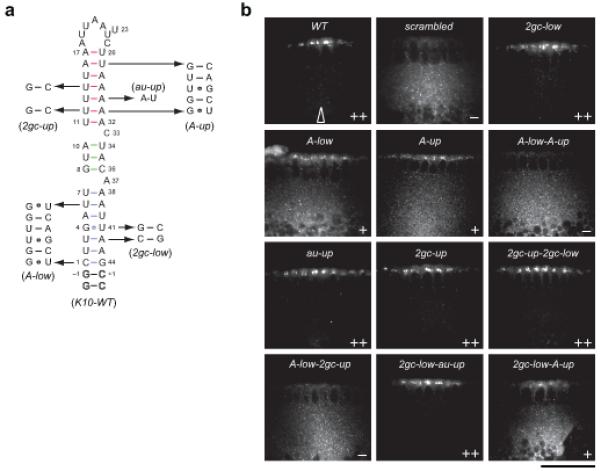
Localization activity of wild-type and lower and upper stem mutant K10 RNAs.
(a) Secondary structure of wild-type and mutant K10 TLS RNAs. Numbering according to ref.9. Outlined nucleotides were added to improve transcription efficiency. The sequences of K10 RNA mutations and the corresponding names used throughout the text are displayed. (b) Representative confocal images of blastoderm embryos injected with transcripts as indicated. TLS mutations were introduced within the context of a 2300 nt K10 sequence (see Online Methods). Transcripts were visualized by virtue of directly incorporated fluorochrome-coupled UTP. Arrow indicates the approximate site of injection in all experiments. Apical is to the top and basal is to the bottom in all images. Images of injections of additional transcripts are shown in Supplementary Fig. 5. Scale bar, 50μm.
We then tested whether specific structural or sequence motifs within the upper and lower helices are required for transport. First, we focussed on the distorted G-U base pair in the lower helix, which could contribute to signal activity through participation in purine base-base stacking or direct sequence-specific recognition by the transport machinery. To attempt to distinguish between these possibilities, we analyzed a mutant RNA that alters base identities but maintains purine stacking by replacing the G-U base pair by a Watson-Crick G-C base pair and the U-A base pair below with a C-G base pair (Fig. 2a; 2gc-low). Despite the alteration of base identity, NMR structure determination reveals that the A′-form inclination angles and the widened major groove are largely preserved (Fig. 3 and Supplementary Tables 1 and 2) and the signal drives transport that is indistinguishable from K10-WT (Table 2 and Fig. 2b; 2gc-low versus WT). Thus, the G-U base pair is also not a determinant of signal activity.
Next we replaced the entire lower A′-form section with a model A-form RNA sequence derived from the brain cytoplasmic 1 RNA25 (Fig. 2a and Supplementary Fig. 2; A-low). The NMR structure of this A-low mutant reveals a deep and narrow major groove and steep inclination angles in the lower stem (Supplementary Tables 1 and 2). A′-form features in the upper helix are preserved in this mutant (Fig. 3), indicating that the local conformations in the upper and lower stems are independent (Supplementary Fig. 6). The A-low mutant supports only inefficient apical transport (Table 2 and Fig. 2b), demonstrating that the presence of a widened major groove in the lower helix correlates with full signal activity.
To investigate if the upper widened major groove also contributes to signal activity, this region was replaced with the same model A-form RNA helix (A-up), while preserving the K10-WT base pairs adjacent to the hairpin loop and the C33 bulge (Fig. 2a; A-up). This mutation weakens signal activity to the same extent as A-low (Table 2 and Fig. 2b; A-low versus A-up). Replacing both helices with A-form regions (A-low-A-up) completely inactivates the TLS (Table 2 and Fig. 2b; A-low-A-up), indicating that each A′-form region contributes to full signal activity and is recognized by the localization machinery as a distinct feature.
To further test the importance of the upper A′-form helix, we determined the structure of two additional mutants that partially interrupt the contiguity of stacked purines in this region (Fig. 2a). Transversion of a single U-A base pair in the upper stem (au-up) does not disrupt the A′-form geometry of the TLS (Fig. 3c) and maintains full transport activity (Table 2 and Fig. 2b, au-up). In addition, combining the weakly localizing lower stem A-form mutant with this transversion (to produce A-low-au-up) does not further reduce signal activity (Table 2 and Supplementary Fig. 5; A-low-au-up), presumably because A′-form geometry is maintained in the upper stem.
Transversion of two U-A base pairs in the upper stem to G-C base pairs (2gc-up) leads to higher inclination angles and reduced major groove widths compared to the wild-type TLS (Fig. 3d,e), albeit distinguishable from regular A-form because of the residual stacking interactions of adenines below the octaloop (Supplementary Fig. 7). This partial reduction in A′-form geometry impairs but does not abolish the activity of the upper stem. It is sufficient to support localization of transcripts in which the lower stem forms an A′-form helix (as in 2gc-up and the double mutant 2gc-low-2gc-up; Table 2 and Fig. 2b). However, when combined with the lower A-form stem mutant, which localizes weakly in the context of the wild-type K10 upper helix, apical localization is completely abolished (Table 2 and Fig. 2b; A-low-2gc-up). These data, together with the analysis of two other double mutants (Table 2 and Fig. 2b; 2gc-low-au-up and 2gc-low-A-up) demonstrate that the efficiency of transport correlates strongly with the overall extent of A′-form structure within the TLS, and that the two A′-form helices co-operate in order to achieve full activity.
In agreement with our data, site-specific mutagenesis experiments previously indicated that the base-paired stems are critical determinants of K10 TLS activity during oogenesis10. This study also suggested that specific base pairs are important for TLS activity during these stages and that localization of the K10 transcript is strongly inhibited only when mutations substantially alter their stereochemistry in the minor groove. Mutations that have little effect on the number or arrangement of hydrogen-bond (H-bond) donor and acceptor groups in the minor groove (e.g. A-U to U-A or U-A to A-U)26, decreased K10 localization in the oocyte only modestly10. In contrast, several mutations which more dramatically alter minor groove stereochemistry, by displaying amino groups instead of adenine H-2 protons (e.g. A-U to G-C or U-A to C-G)26, greatly reduced localization10.
To test whether apical localization of K10 in blastoderm embryos also depends on minor groove features, we mutated U-A to C-G base pairs, thereby altering the number of H-bond donors and acceptors in the minor groove whilst maintaining the A′-form-inducing purine runs (Fig. 4a). Transversion of two U-A base pairs in the upper stem to C-G base pairs (2cg-up) maintains wild-type levels of apical transcript localization and combination with the lower A-form stem mutant (A-low-2cg-up) supports weak localization as observed for the A-low mutant with the wild-type K10 upper helix (Table 2 and Fig. 4; 2cg-up and A-low-2cg-up). An even more drastic change in the upper helix of 5 U-A to 5 C-G base pairs (5cg-up) also fully drives apical transport in the context of the wild-type lower helix (Table 2 and Fig. 4; 5cg-up). Importantly, 5cg-up also functions like a wild-type upper helix in supporting weak localization in combination with the A-low mutation (Table 2 and Fig. 4; A-low-5cg-up). As described above, an upper helix containing mutations of just two U-A base pairs to G-C base pairs is unable to complement the A-form lower helix, resulting in an inactive signal (A-low-2gc-up), despite G-C and C-G base-pairs having a very similar arrangement of H-bond acceptors and donors in the minor groove26. Collectively, these observations strongly argue against recognition of minor groove features in the upper helix of K10 in the embryo. Instead recognition of features associated with the widened major grooves induced by purine-purine stacking is likely to underpin apical K10 transport.
Figure 4.
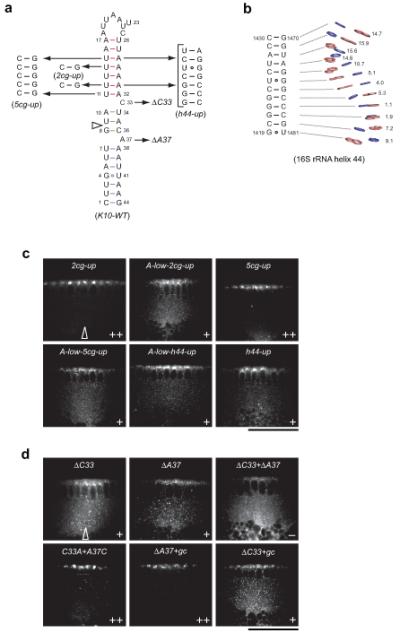
Localization activity of A′-form and bulge mutant K10 RNAs.
(a) Secondary structure of wild-type and mutant K10 TLS RNAs. Numbering according to ref.9. The sequences of K10 RNA mutations and the corresponding names used throughout the text are displayed; ΔC33 and ΔA37 denote deletion of the correspond nucleotides. Open arrowhead indicates position where an additional base pair is inserted in ΔC33+gc and ΔA37+gc. In the h44-up mutant 4 U-A base pairs are replaced by nucleotides 1420-1427 and 1473-1479 of the 16S rRNA helix 44 shown in b.
(b) Secondary and tertiary structure of an A′-form helix 44 segment from 16S rRNA (PDB ID 2J00)27. Numbering according to (PDB ID 2J00)27. Pyrimidine bases are blue and purine bases are pink; ribose-phosphate backbone and chemical groups on the bases are omitted for clarity. The inclination angles (in degrees) are given for each base pair.
(c and d) Representative confocal images of blastoderm embryos injected with transcripts as indicated. TLS mutations were introduced within the context of a 2300 nt K10 sequence (see Online Methods). Transcripts were visualized by virtue of directly incorporated fluorochrome-coupled UTP. Arrow indicates the approximate site of injection in all experiments. Apical is to the top and basal is to the bottom in all images. Images of injections of additional transcripts are shown in Supplementary Fig. 5. Scale bar, 50μm.
To test whether a heterologous A′-form helix is sufficient to support apical transport, we inspected helices with runs of purines in the crystal structure of the Thermus thermophilus 30S small ribosomal subunit (PDB ID 2J00)27. Although not previously commented on, several helices of 16S rRNA display A′-form inclination angles and widened major grooves. All of these helices are associated with runs of three or more base-paired purines on one side of the stem (Supplementary Fig. 8), and one, helix 44, contains a segment whose inclination angles are particularly reminiscent of the K10 upper helix, despite having a very different sequence composition (Fig. 4b and Supplementary Table 1).
To test whether this 16S rRNA A′-form helix also supports apical transport we used it to replace 4 U-A base pairs in the upper helix of the K10 TLS in the context of an A-form lower helix (Fig. 4a; A-low-h44-up). This heterologous upper helix behaves indistinguishably from the wild-type K10 upper helix in this situation, driving weak apical localization of K10 (Table 2 and Fig. 4c, A-low-h44-up). These data provide further evidence of the correlation between A′-form geometry and localization activity. Interestingly, unlike all other upper helix mutants tested in this study, the extent of localization supported by the helix 44 segment is not improved by replacing the A-form helix with the wild-type K10 A′-form lower helix (Table 2 and Fig. 4c; h44-up). The h44-up mutant has a longer upper helix relative to the wild-type and mutant K10 TLSs, implying that the register or spacing of widened major grooves in A′-form helices could be important for full activity of a localization element.
Our functional analysis of the bulged nucleotides C33 and A37 also supports this notion. Deletion of each bulge individually reduces the efficiency of apical K10 localization dramatically and deletion of both renders the signal inactive (Table 2 and Fig. 4d; ΔC33, ΔA37 and ΔC33+ΔA37). Any nucleotide at positions 33 and 37 gives more effective localization than the respective bulge deletion (Table 2, Fig. 4d and Supplementary Fig. 5), indicating that specific recognition of functional groups within the bulged nucleotides is not important. Instead the two bulges could fine-tune the relative spacing and/or orientation of the widened major grooves in the K10 lower and upper helix (Supplementary Fig. 3b).
Within the wild-type K10 TLS the bulge C33, which does not alter the helical twist between the adjacent base pairs, could serve as a hinge to modulate the relative angle of the upper and lower helix upon interaction with the transport machinery, while the helical twist contributed by A37 might assist to orient them at 90° to one another (Fig. 1c). Consistent with this hypothesis, insertion of an additional Watson-Crick base pair in the middle helix can rescue the deletion of A37 but not deletion of C33 (Table 2 and Fig. 4d, ΔA37+gc, ΔC33+gc). The finding that deletion of both bulges within the wild-type K10 TLS (ΔC33+ΔA37), which would strongly perturb the relative orientation of the two A′-form helices, has a greater inhibitory effect than having an aligned A-form and A′-form helix (e.g. A-up or A-low) argues that the upper and lower helix are not recognized independently. We conclude that the localization machinery recognizes the widened K10 major grooves only when correctly oriented in a longer RNA structure.
DISCUSSION
The results of systematic in vivo analysis and structure determination of mutant RNAs are consistent with a model in which the key factors for K10 signal activity in the embryo are two spatially oriented A′-form RNA helices with widened major grooves. When these helices are correctly aligned, the efficiency of transport correlates with the overall extent of A′-form structure.
It was very surprising to detect A′-form conformation in the double helical regions of the K10 TLS, since they are composed of regular Watson-Crick and a G-U base pair which usually maintain A-form helical geometry15. A′-form RNA conformation is characterized by lower inclination angles of the base pairs compared to A-form RNA and a concomitantly widened major groove17. To achieve this, no torsion angle along the backbone has to change substantially, and the angle between the ribose and base (χ angle) is only lowered by ~10 degrees. Thus, there can be no directly observable NOE or torsion angles diagnostic of A′-form versus A-form RNA.
Nonetheless, the presence of A′-form helicity in the TLS is further supported by B-form-like CD spectra of RNAs, very strong upfield shifts of adenine H-2 protons and the ability to detect reduced major groove widths in calculated NMR structures of mutant RNAs with disrupted purine-purine stacking. In addition, our functional experiments reveal a strong correlation between the extent of purine-purine stacking and the degree of localization signal activity. We also detected A′-form geometry in several Watson-Crick or G-U base paired 16S rRNA helices again associated with runs of three or more consecutive purines on either side of the stem. Collectively, these observations provide a compelling case that A′-form conformation can be adopted by dsRNAs with regular base pairs undergoing contiguous purine-purine stacking and that such structures are functionally important for recognition of the K10 TLS by the mRNA localization machinery.
A′-form conformation results in increased major groove widths in the TLS, which could accommodate positively-charged protein loops, α-helices or beta-hairpins from proteins that link the TLS to dynein complexes. U-A or C-G base pairs can be tolerated in at least some positions of the A′-form helices, arguing against base pair specific contacts by the apical localization machinery. Instead it is likely that interactions occur with the ribose-phosphate backbone, which is accessible from the major groove in A′-form helices, although recognition of consecutive N-7 positions from the stacked purines could also conceivably contribute to TLS activity.
The secondary structures of other signals that mediate mRNA transport towards the minus-ends of microtubules in Drosophila suggest that they could contain features similar to the K10 TLS. The orb localization signal preserves the lower and upper stem stacking of base paired purines as found in the K10 TLS (Supplementary Fig. 6e), but lacks the upper bulged nucleotide10. Instead, the upper U-A base paired helix is extended, which could maintain the relative orientation of the widened major grooves. Stem-loops within the other mapped minus-end-directed signals active in the embryo—from gurken4, fushi tarazu5, hairy6, bicoid7, wingless8 and the I-factor4—contain 2 or more stretches of at least three contiguous purines on the same side of the stem (Supplementary Fig. 9). Indeed, extensive mutagenesis has revealed that at least some of these purines are essential for signal activity5,6,8. Consistent with a shared structural basis of recognition of minus-end-directed RNA signals, several of these elements, including the K10 TLS, are known to be directly contacted by the Egl protein, despite its lack of a canonical RNA-binding motif28. Future experiments will be aimed at elucidating the molecular basis of RNA cargo recognition by Egl and how the RNA signals control stoichiometry of transport complexes.
Finally, our results underscore the importance of comparative structural studies of wild-type and mutant elements to reveal features encoding RNA function. Mutational analysis alone, which is usually based on computationally and biochemically derived secondary structures, could not have identified the presence of A′-form helices that appear critical for signal activity.
Supplementary Material
Acknowledgements
We thank Laura Easton for preparation of labelled NTPs and assistance with cloning of some constructs, Ji-Chun Yang for excellent help with NMR data collection and David Neuhaus, Jody Puglisi, and Laura Easton for the critical reading of the manuscript. This work was supported by MRC (P.J.L and S.L.B.) and Cancer Research UK (I.R. and D.I.-H.). S.L.B. is a Lister Institute Prize fellow.
Online Methods
NMR sample preparation
The sequence of the wild-type K10 TLS RNA corresponds to nt 2277-2320 (NCBI Reference Sequence NM 058143.3) with two additional G-C base pairs added to improve transcription efficiency (Fig. 1a). RNA oligonucleotides were prepared by in vitro transcription from linearized plasmid DNAs using T7 RNA polymerase, followed by weak anion-exchange chromatography29, and equilibration in centrifugal devices against final buffer (10mM sodium phosphate buffer pH 6.0) as previously described30. Unlabeled, 13C,15N-labeled, and site-specifically pyrimidine H-5 deuterated RNA oligonucleotides were transcribed. Site-specifically H-5 deuterated rUTP and rCTP (85-90% deuteration) were prepared from the corresponding monophosphates, rUMP and rCMP (Sigma) following published procedures31,32. NMR samples were prepared in Shigemi NMR tubes (280 μl containing 5% or 100% D2O (v/v) and 0.25 mM d12-EDTA) at RNA concentrations of 0.3-1.0 mM. Weakly aligned NMR samples for RDC measurement were prepared by addition of 5-10 mg ml−1 of filamentous phage Pf133.
NMR spectroscopy
NMR data were acquired at 5, 15, and 25°C on Bruker DMX 600 and Avance 800 spectrometers equipped with 5mm room temperature or cryo-probes, respectively. 1H, 13C, 15N, and 31P assignments were obtained using standard homonuclear and heteronuclear methods as described previously34. NMR data were processed with XWIN-NMR (Bruker GmbH, Karlsruhe, Germany) and spectra analyzed with SPARKY35. Base pairing schemes were established using the HNN-COSY experiment36, and from NOE patterns in 2D NOESY spectra recorded in 95% H2O/5% D2O (v/v)37. NOEs from exchangeable protons were characterized as either strong (1.8 - 3.5Å), medium (1.8 - 4.5Å), weak (1.8 - 6Å) or very weak (3.5 - 6.5 Å), based on their NOE peak intensities at mixing times of 50 and 120 ms, while NOEs from non-exchangeable protons were characterized as either strong (1.4 - 3.0Å), medium (1.8 - 4Å), weak (1.8 - 5Å) or very weak (1.8 - 6.5Å), based on their NOE peak intensities at mixing times of 50, 150 and 250 ms. Dihedral torsion angle restraints were obtained from DQF-COSY, 3D HMQC-TOCSY, HP-COSY and 3D HCP experiments, as described34. Heteronuclear one-bond 1JCH couplings were measured in the absence and presence of filamentous phage Pf1 using a 1H,13C constant-time TROSY as described14,33. The RDC values were calculated as 1DCH = 1JCH (aligned) - 1JCH (isotropic).
Structure calculation and analysis
Structures were calculated using a simulated annealing protocol within XPLOR-NIH38 initially excluding RDC restraints and then subjected to a refinement procedure including RDC restraints14,39. 200-400 initial structures calculated without RDC restraints (Supplementary Fig. 10a) were used to estimate Da and R of the alignment tensor by determining the best fit of observed RDCs to ensemble members using the singular value decomposition (SVD) method40 implemented in the program PALES41. Iterative refinement of the K10 RNAs with RDC restraints, each one followed by SVD-fitting of the lowest energy structures to predict new values of Da and R were performed following published protocols14,42. The iterative refinement was stopped when the R value, and therefore the overall shape of the RNA, was basically unchanged (ΔR < 0.005) in two consecutive rounds of calculations following previously published procedures14,42. The K10-WT structures converged after four rounds of calculations (4×200 structures) with Da = −26.43 and R = 0.111 (Supplementary Figure 10b). In addition, a grid search with 70 grid points (70×200 structures) was performed for K10-WT RNA with Da ranging from −17 to −31 and R ranging from 0.05 to 0.4543 (Supplementary Fig. 10c). The lowest-energy structures were obtained with Da = −27 and R=0.1, which agrees well with the iterative refinement results and yielded virtually identical structures (Supplementary Figure 10d). Therefore, all other mutant K10 RNAs were calculated using the less time-consuming, iterative refinement approach42. For the mutant K10-A-low RNA, two RDC data sets with separate alignment tensors were used in the structure calculation following previously described procedures14. All final structures chosen had the lowest total and restraint violation energies and no angular violations > 10° of the calculated ensemble (Table 1). Structures with higher total and restraint violation energies displayed local distortion of the terminal base pair or loop nucleotides, which led to local RDC (> 3 Hz) and angular violations (> 10°) without affecting the structure in the helical stems. Electrostatic surface potential of the K10-WT RNA was calculated using the program Qnifft 1.444. Structures were analyzed using the programs CURVES45 and MOLMOL46 (Supplementary Tables 1 and 2), structure figures were generated using the program PyMOL (http://pymol.sourceforge.net/) and figures prepared with Adobe Illustrator CS2 (Adobe Systems Incorporated).
CD spectroscopy
CD spectra were measured as far as 170 nm on a Jasco-810 circular dichrometer, at 20°C at an optical density of 1.0±0.1 in 10mM sodium phosphate buffer, pH 6.0 without or with 25, 50, or 75% (v/v) TFE. CD data in Supplementary Fig. 4 are baseline-corrected, smoothened and plotted as Δε (mdeg) from 320 – 190 nm. RNAs corresponding to upper and lower wild-type and mutant helices were ordered from Dharmacon and K10-WT DNA from Sigma.
RNA synthesis, injections and scoring procedures
Mutations were generated in the context of a K10 sequence corresponding to the entire 1432-bp 3′UTR and an 860-bp portion of the 3′ genomic sequences. Synthesis of fluorescent RNAs and injections were performed as described previously23. The vast majority of RNAs were injected, imaged and scored blind of the identity of the mutation, which was withheld by a second researcher until the end of the experiment. Other RNAs were injected, imaged and scored independently by two of the authors, with indistinguishable results. A 250 ng μl−1 solution of fluorescent RNA (~ 10 fluorophores per 2300 nt K10 transcript) was injected into 10 - 20 nuclear cycle 14 blastoderm embryos per experiment. Embryos were fixed 6 min after injection of the last embryo (~ 9 min after injection of the first), devitellinized, mounted in Citifluor solution (Citifluor Ltd, UK) and imaged with a Zeiss 510 confocal microscope using a 40/1.3 NA x Plan Neofluor oil objective. For each embryo, apical RNA localization was classified into one of three categories: ++, efficient localization (the vast majority of fluorescent signal in the apical cytoplasm, where it concentrates in puncta apical to the nuclei); +, weak localization (substantial RNA signal in the basal cytoplasm, but some concentration of RNA in apical puncta relative to the background signal); −, no apical localization (no discernible concentration of RNA in apical puncta). For each mRNA, the vast majority of embryos fell into the same class, which was assigned as the localization efficiency for that transcript. Scoring the same transcripts with different RNA preparations and on different days of injection revealed indistinguishable results.
Footnotes
Accession codes. The coordinates of K10 wild-type and mutant RNAs have been deposited in the Protein Data Bank under accession numbers 2KE6 (K10-WT), 2KUR (K10-au-up), 2KUU (K10-2gc-up), 2KUV (K10-2gc-low), and 2KUW (K10-A-low).
Note: Supplementary information is available on the Nature Structural & Molecular Biology website.
Methods Methods and any associated references are available in the online version of the paper at http://www.nature.com/nsmb/.
References
- 1.Martin KC, Ephrussi A. mRNA localization: gene expression in the spatial dimension. Cell. 2009;136:719–30. doi: 10.1016/j.cell.2009.01.044. [DOI] [PMC free article] [PubMed] [Google Scholar]
- 2.Holt CE, Bullock SL. Subcellular mRNA localization in animal cells and why it matters. Science. 2009;326:1212–6. doi: 10.1126/science.1176488. [DOI] [PMC free article] [PubMed] [Google Scholar]
- 3.Wilkie GS, Davis I. Drosophila wingless and pair-rule transcripts localize apically by dynein-mediated transport of RNA particles. Cell. 2001;105:209–19. doi: 10.1016/s0092-8674(01)00312-9. [DOI] [PubMed] [Google Scholar]
- 4.Van De Bor V, Hartswood E, Jones C, Finnegan D, Davis I. gurken and the I factor retrotransposon RNAs share common localization signals and machinery. Dev Cell. 2005;9:51–62. doi: 10.1016/j.devcel.2005.04.012. [DOI] [PubMed] [Google Scholar]
- 5.Snee MJ, Arn EA, Bullock SL, Macdonald PM. Recognition of the bcd mRNA localization signal in Drosophila embryos and ovaries. Mol. Cell. Biol. 2005;25:1501–10. doi: 10.1128/MCB.25.4.1501-1510.2005. [DOI] [PMC free article] [PubMed] [Google Scholar]
- 6.Bullock SL, Zicha D, Ish-Horowicz D. The Drosophila hairy RNA localization signal modulates the kinetics of cytoplasmic mRNA transport. EMBO J. 2003;22:2484–94. doi: 10.1093/emboj/cdg230. [DOI] [PMC free article] [PubMed] [Google Scholar]
- 7.Macdonald PM, Kerr K. Mutational analysis of an RNA recognition element that mediates localization of bicoid mRNA. Mol. Cell. Biol. 1998;18:3788–95. doi: 10.1128/mcb.18.7.3788. [DOI] [PMC free article] [PubMed] [Google Scholar]
- 8.dos Santos G, Simmonds AJ, Krause HM. A stem-loop structure in the wingless transcript defines a consensus motif for apical RNA transport. Development. 2008;135:133–43. doi: 10.1242/dev.014068. [DOI] [PubMed] [Google Scholar]
- 9.Serano TL, Cohen RS. A small predicted stem-loop structure mediates oocyte localization of Drosophila K10 mRNA. Development. 1995;121:3809–18. doi: 10.1242/dev.121.11.3809. [DOI] [PubMed] [Google Scholar]
- 10.Cohen RS, Zhang S, Dollar GL. The positional, structural, and sequence requirements of the Drosophila TLS RNA localization element. RNA. 2005;11:1017–29. doi: 10.1261/rna.7218905. [DOI] [PMC free article] [PubMed] [Google Scholar]
- 11.Cheung HK, Serano TL, Cohen RS. Evidence for a highly selective RNA transport system and its role in establishing the dorsoventral axis of the Drosophila egg. Development. 1992;114:653–61. doi: 10.1242/dev.114.3.653. [DOI] [PubMed] [Google Scholar]
- 12.Allain FH, Varani G. How accurately and precisely can RNA structure be determined by NMR? J. Mol. Biol. 1997;267:338–51. doi: 10.1006/jmbi.1996.0855. [DOI] [PubMed] [Google Scholar]
- 13.Tjandra N, Bax A. Direct measurement of distances and angles in biomolecules by NMR in a dilute liquid crystalline medium. Science. 1997;278:1111–4. doi: 10.1126/science.278.5340.1111. [DOI] [PubMed] [Google Scholar]
- 14.Lukavsky PJ, Puglisi JD. Structure determination of large biological RNAs. Methods Enzymol. 2005;394:399–416. doi: 10.1016/S0076-6879(05)94016-0. [DOI] [PubMed] [Google Scholar]
- 15.Saenger W. Principles of Nucleic Acid Structure. Springer Verlag; New York: 1984. [Google Scholar]
- 16.Arnott S, Hukins DW, Dover SD. Optimised parameters for RNA double-helices. Biochem. Biophys. Res. Commun. 1972;48:1392–9. doi: 10.1016/0006-291x(72)90867-4. [DOI] [PubMed] [Google Scholar]
- 17.Tanaka Y, et al. A′-form RNA double helix in the single crystal structure of r(UGAGCUUCGGCUC) Nucleic Acids Res. 1999;27:949–55. doi: 10.1093/nar/27.4.949. [DOI] [PMC free article] [PubMed] [Google Scholar]
- 18.Correll CC, Freeborn B, Moore PB, Steitz TA. Metals, motifs, and recognition in the crystal structure of a 5S rRNA domain. Cell. 1997;91:705–12. doi: 10.1016/s0092-8674(00)80457-2. [DOI] [PubMed] [Google Scholar]
- 19.Varani G, Aboulela F, Allain FHT. NMR Investigation of RNA Structure. Prog. Nucl. Mag. Res. Sp. 1996;29:51–127. [Google Scholar]
- 20.Kypr J, Kejnovska I, Renciuk D, Vorlickova M. Circular dichroism and conformational polymorphism of DNA. Nucleic Acids Res. 2009;37:1713–25. doi: 10.1093/nar/gkp026. [DOI] [PMC free article] [PubMed] [Google Scholar]
- 21.Foe VE, Odell GM, Edgar BA. Mitosis and morphogenesis in the Drosophila embryo: point and counterpoint. In: Bate M, Martinez-Arias A, editors. In the Development of Drosophila melanogaster. Cold Spring Harbor Laboratory Press; New York: 1993. pp. 149–300. [Google Scholar]
- 22.Bullock SL, Nicol A, Gross SP, Zicha D. Guidance of bidirectional motor complexes by mRNA cargoes through control of dynein number and activity. Curr. Biol. 2006;16:1447–52. doi: 10.1016/j.cub.2006.05.055. [DOI] [PubMed] [Google Scholar]
- 23.Bullock SL, Ish-Horowicz D. Conserved signals and machinery for RNA transport in Drosophila oogenesis and embryogenesis. Nature. 2001;414:611–6. doi: 10.1038/414611a. [DOI] [PubMed] [Google Scholar]
- 24.Cheong C, Varani G, Tinoco I., Jr. Solution structure of an unusually stable RNA hairpin, 5′GGAC(UUCG)GUCC. Nature. 1990;346:680–2. doi: 10.1038/346680a0. [DOI] [PubMed] [Google Scholar]
- 25.Tiedge H, Zhou A, Thorn NA, Brosius J. Transport of BC1 RNA in hypothalamo-neurohypophyseal axons. J. Neurosci. 1993;13:4214–9. doi: 10.1523/JNEUROSCI.13-10-04214.1993. [DOI] [PMC free article] [PubMed] [Google Scholar]
- 26.Seeman NC, Rosenberg JM, Rich A. Sequence-specific recognition of double helical nucleic acids by proteins. Proc. Natl. Acad. Sci. USA. 1976;73:804–8. doi: 10.1073/pnas.73.3.804. [DOI] [PMC free article] [PubMed] [Google Scholar]
- 27.Selmer M, et al. Structure of the 70S ribosome complexed with mRNA and tRNA. Science. 2006;313:1935–42. doi: 10.1126/science.1131127. [DOI] [PubMed] [Google Scholar]
- 28.Dienstbier M, Boehl F, Li X, Bullock SL. Egalitarian is a selective RNA-binding protein linking mRNA localization signals to the dynein motor. Genes Dev. 2009;23:1546–58. doi: 10.1101/gad.531009. [DOI] [PMC free article] [PubMed] [Google Scholar]
References for online methods only
- 29.Easton LE, Shibata Y, Lukavsky PJ. Rapid, nondenaturing RNA purification using weak anion-exchange fast performance liquid chromatography. RNA. 2010;16:647–653. doi: 10.1261/rna.1862210. [DOI] [PMC free article] [PubMed] [Google Scholar]
- 30.Lukavsky PJ, Puglisi JD. Large-scale preparation and purification of polyacrylamide-free RNA oligonucleotides. RNA. 2004;10:889–893. doi: 10.1261/rna.5264804. [DOI] [PMC free article] [PubMed] [Google Scholar]
- 31.Nikonowicz EP. Preparation and use of 2H-labeled RNA oligonucleotides in nuclear magnetic resonance studies. Methods Enzymol. 2001;338:320–41. doi: 10.1016/s0076-6879(02)38227-2. [DOI] [PubMed] [Google Scholar]
- 32.Scott LG, Tolbert TJ, Williamson JR. Preparation of specifically 2H- and 13C-labeled ribonucleotides. Methods Enzymol. 2000;317:18–38. doi: 10.1016/s0076-6879(00)17004-1. [DOI] [PubMed] [Google Scholar]
- 33.Hansen MR, Hanson P, Pardi A. Filamentous bacteriophage for aligning RNA, DNA, and proteins for measurement of nuclear magnetic resonance dipolar coupling interactions. Methods Enzymol. 2000;317:220–40. doi: 10.1016/s0076-6879(00)17017-x. [DOI] [PubMed] [Google Scholar]
- 34.Lukavsky PJ, Puglisi JD. RNAPack: an integrated NMR approach to RNA structure determination. Methods. 2001;25:316–32. doi: 10.1006/meth.2001.1244. [DOI] [PubMed] [Google Scholar]
- 35.Goddard TD, Kneller DG. Sparky 3. University of California; San Francisco: 2000. [Google Scholar]
- 36.Dingley AJ, Grzesiek S. Direct Observation of Hydrogen Bonds in Nucleic Acid Base Pairs by Internucleotide 2JNN Couplings. J. Am. Chem. Soc. 1998;120:8293–8297. [Google Scholar]
- 37.Heus HA, Pardi A. Novel H-1 Nuclear Magnetic Resonance Assignment Procedure for Rna Duplexes. J. Am. Chem. Soc. 1991;113:4360–4361. [Google Scholar]
- 38.Schwieters CD, Kuszewski JJ, Tjandra N, Clore GM. The Xplor-NIH NMR molecular structure determination package. J. Magn. Reson. 2003;160:65–73. doi: 10.1016/s1090-7807(02)00014-9. [DOI] [PubMed] [Google Scholar]
- 39.Lukavsky PJ, Kim I, Otto GA, Puglisi JD. Structure of HCV IRES domain II determined by NMR. Nat. Struct. Biol. 2003;10:1033–38. doi: 10.1038/nsb1004. [DOI] [PubMed] [Google Scholar]
- 40.Losonczi JA, Andrec M, Fischer MW, Prestegard JH. Order matrix analysis of residual dipolar couplings using singular value decomposition. J. Magn. Reson. 1999;138:334–42. doi: 10.1006/jmre.1999.1754. [DOI] [PubMed] [Google Scholar]
- 41.Zweckstetter M, Bax A. Prediction of Sterically Induced Alignment in a Dilute Liquid Crystalline Phase: Aid to protein Structure Determination by NMR. J. Am. Chem. Soc. 2000;122:3791–3792. [Google Scholar]
- 42.Warren JJ, Moore PB. Application of dipolar coupling data to the refinement of the solution structure of the sarcin-ricin loop RNA. J. Biomol. NMR. 2001;20:311–23. doi: 10.1023/a:1011214214552. [DOI] [PubMed] [Google Scholar]
- 43.Tjandra N, Tate S, Ono A, Kainosho M, Bax A. The NMR Structure of a DNA Dodecamer in an Aqueous Dilute Liquid Crystalline Phase. J. Am. Chem. Soc. 2000;122:6190–6200. [Google Scholar]
- 44.Chin K, Sharp KA, Honig B, Pyle AM. Calculating the electrostatic properties of RNA provides new insights into molecular interactions and function. Nat. Struct. Biol. 1999;6:1055–61. doi: 10.1038/14940. [DOI] [PubMed] [Google Scholar]
- 45.Lavery R, Sklenar H. Defining the structure of irregular nucleic acids: conventions and principles. J. Biomol. Struct. Dyn. 1989;6:655–67. doi: 10.1080/07391102.1989.10507728. [DOI] [PubMed] [Google Scholar]
- 46.Koradi R, Billeter M, Wuthrich K. MOLMOL: a program for display and analysis of macromolecular structures. J. Mol. Graph. 1996;14(51-5):29–32. doi: 10.1016/0263-7855(96)00009-4. [DOI] [PubMed] [Google Scholar]
Associated Data
This section collects any data citations, data availability statements, or supplementary materials included in this article.