Abstract
Phase-contrast imaging methods exploit variations in an object’s refractive index distribution to permit the visualization of subtle features that may have very similar optical absorption properties. Although phase-contrast is often viewed as being desirable in many biomedical applications, its relative influence on signal detectability when both absorption- and phase-contrast are present remains relatively unexplored. In this work, we investigate the ideal Bayesian observer signal to noise ratio (SNR) in phase-contrast imaging for a signal-known-exactly/background-known exactly detection task involving a weak signal. We demonstrate that this signal detectability measure can be decomposed into three contributions that have distinct interpretations associated with the imaging physics.
1. Introduction
Two-dimensional (2D) coherent imaging systems that employ phase-contrast can visualize the projected refractive index of transparent samples and have found widespread use in microscopy and other biomedical imaging applications. When phase-contrast is employed, the measured intensity on the output plane of the imaging system is determined by both the amplitude and phase of the underlying wavefield on the input plane. Well-known examples include in-line holography [1,2], analyzer-crystal-based phase-contrast imaging [3–5], Zernike phase-contrast imaging [6], and differential interference phase-contrast imaging [7]. In recent years, much effort has been devoted to the development of X-ray phase-contrast imaging systems for medical imaging [4,5,8–10] and other applications [2,11–14]. In these methods, the image contrast in the recorded radiographs can arise from a mixture of the absorption and refractive (i.e., phase) properties of the object, resulting in a radiograph with an edge-enhanced appearance that may be diagnostically useful [4,5,8,15].
Although phase-contrast is generally viewed as being desirable in many biomedical applications, its influence on objective measures of image quality when both phase- and absorption-contrast contribute to image formation remains relatively unexplored. Physical measures of image quality such as noise variance, signal contrast, and spatial resolution metrics, have been applied to optimize phase-contrast imaging systems [10,16–20]. While physical measures can provide valuable insights relevant to system optimization, they do not directly reveal how useful the produced images are for facilitating a specified diagnostic task. Task-based, or objective, measures of image quality are fundamentally distinct from physical measures in that they are inherently grounded in statistical decision theory and reveal the average performance of an observer on a specific diagnostic task [21–25]. Our group was among the first to utilize task-based measures of image quality in studies of X-ray phase-contrast imaging [26–30].
The ideal Bayesian observer is a computational algorithm or mathematical model that makes optimal use of all available information in performing a classification task such as signal detection. The performance of the ideal observer provides an upper bound for classification performance that no human or pattern recognition algorithm can surpass for the specified task. When optimizing the data acquisition hardware and protocols of an imaging system, it is advisable to maximize the performance of the ideal observer [31]. Optimizing the imaging system by use of this metric will maximize the amount of information in the raw measurement data that is relevant to performing the specified diagnostic task. Moreover, there may be certain diagnostic tasks for which the performance of the ideal observer is a good predictor of human observer performance [23]. Any numerical observer, including the ideal observer, makes a binary decision by computing a test statistic from knowledge of the observered image data, and comparing it to a decision threshold. The signal-to-noise ratio (SNR) of the test statistic, which is defined explicitly later, represents a convenient summary measure of detection performance. For the ideal observer, we will refer to this quantity as the ideal observer SNR.
In this work, a Fourier optics description of phase-contrast imaging employing linear shift-invariant optical systems is utilized to model phase- and absorption-contrast contributions to the ideal observer SNR for a signal-known-exactly/background-known-exactly (SKE/BKE) detection task. We consider that the observer acts upon a single raw image that contains phase- and absorption-contrast, and no image processing or phase-retrieval operations have been performed. We demonstrate that the squared ideal observer SNR can be decomposed into three contributions that have distinct interpretations associated with the imaging physics and contrast mechanisms. This analysis quantifies the interplay between the imaging physics and spatial resolution response of the imaging system that determines the relative importance of phase-contrast to signal detectability, and may provide insights into the use of the ideal observer SNR as a metric for optimizing phase-contrast imaging systems. It will also permit a quantitative comparison of the ideal observer SNR associated with different phase-contrast imaging systems and operating conditions. Propagation-based and analyzer-based phase-contrast imaging are considered as special cases of our analysis, and numerical studies are conducted to demonstrate the relative magnitudes of the SNR components corresponding to different beam energies and amounts of system blur.
The paper is organized as follows. In Sections 2 and 3 we review some basic principles of phase-contrast imaging and signal detection theory that will be employed in our analysis. The ideal observer SNR corresponding to a SKE/BKE detection task is analyzed in Section 4 for phase-contrast imaging systems employing linear shift-invariant optical systems. The specific cases of propagation-based and analyzer-based X-ray phase-contrast imaging are considered in Sections 5 and 6. We conclude with a summary and discussion of the work in Section 7.
2. Background: Image formation in phase-contrast imaging
Below we provide a brief review of the relevant imaging physics and a Fourier optics-based description of phase-contrast imaging systems. A comprehensive treatment of phase-contrast image formation can be found in the monograph by Paganin [32].
2.A. Interaction of wavefield with object
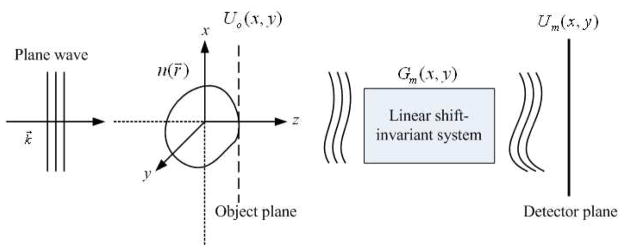
As depicted in Fig. 1, consider that a compactly supported object is irradiated by a monochromatic scalar plane wave Ui with wavelength λ that propagates in the direction of the positive z-axis. The object is characterized by its three-dimensional (3D) complex-valued refractive index distribution
Fig. 1.
A schematic of a generic X-ray phase-contrast imaging system.
| (1) |
where r⃗ = (x, y, z) and . The wavelength dependence of n(r⃗) will be suppressed to simplify our notation. In the X-ray wavelength regime, Δ(r⃗) > 0 and the linear X-ray attenuation coefficient μ(r⃗) is given by
| (2) |
where is the wavenumber. Note that classic radiographic methods are sensitive only to variations in β(r⃗), while phase-contrast methods are sensitive to variations in both Δ(r⃗) and β(r⃗).
Assuming a forward propagating wavefield and a sufficiently thin object, the transmitted wavefield Uo(x, y) on the plane immediately behind the object, referred to as the object plane, is determined as
| (3) |
where the transmission function T(x, y) can be expressed generally as
| (4) |
The amplitude modulus M(x, y) = exp[−A(x, y)] and the phase shift φ(x, y) describe how the amplitude and phase of the probing wavefield are perturbed by variations in the object’s complex refractive index distribution n(r⃗). Specifically, A(x, y) and φ(x, y) are related to n(r⃗) as
| (5a) |
and
| (5b) |
where the line-integrals are computed along the beam path that is assumed to be parallel with the z-axis in the projection approximation [32].
2.B. Phase-contrast imaging employing linear shift-invariant optical systems
Many phase-contrast imaging systems utilize a linear shift-invariant (LSI) optical system to render phase-contrast effects visible [33–37]. Consider the generic phase-contrast imaging system shown in Fig. 1. Let the object plane wavefield Uo(x, y) represent the input to a 2D LSI optical system and let Um(x, y) denote the output wavefield on a detector plane of constant z. The integer-valued subscript m indicates that the system was specified by the impulse response Gm(x, y), i.e.,
| (6) |
where * denotes a two-dimensional (2D) convolution operation. For example, in propagation-based imaging Gm(x, y) is specified by the Fresnel propagator kernel [38], with different values of m corresponding to distinct object-to-detector distances. In analyzer-based phase-contrast imaging, Gm(x, y) is specified by the coherent impulse response of the analyzer crystal or other diffractive element(s) employed. In this case, distinct values of m would correspond to different orientations of the analyzer crystal.
The intensity of the output wavefield,
| (7) |
represents the measured image that generally contains both mixed absorption- and phase-contrast. As described later, the primary objective of our study is to understand the relative contributions of phase- and absorption-contrast in this image to a summary measure of signal detectability for an object detection task.
In many imaging applications where phase-contrast is desirable, the attenuation of the object is weak (relative to a homogeneous background) and the phase perturbation varies slowly [39–41]. Specifically, we will consider that
| (8a) |
and
| (8b) |
for all locations (x, y) and (x̂, ŷ) in the object plane that are separated by a distance smaller than the essential support of Gm(x, y) [42]. Let the 2D Fourier transform (FT) of Im(x, y) be denoted as as
| (9) |
where  denotes the 2D Fourier transform operator. Also, let Ii = |Ui|2 denote the intensity of the incident wavefield. Under the validity of Eqn. (8), it can be shown that [42]
| (10) |
where δ(u, v) is the 2D Dirac delta function, is the amplitude transfer function (ATF):
| (11) |
and is the phase transfer function (PTF):
| (12) |
Here, G̃m(u, v), Ã(u, v), and φ̃(u, v) are the 2D FTs of Gm(x, y), A(x, y), and φ(x, y), respectively, and denotes the complex conjugate of G̃m(·, ·).
3. Signal detection and the ideal observer SNR
Below we review some features of signal detection theory as applied to objective assessment of image quality. These concepts are applied to analyze ideal observer signal detection performance in phase-contrast imaging in Section 4.
3.A. Objective assessment of image quality
There is growing consensus in the contemporary image science research community that image quality should be measured by the average performance of an observer on a specific diagnostic task [21–23]. The ability to quantify imaging system performance for specific tasks, such as the detection of low-contrast object features, can provide valuable guidance for the design and optimization of imaging systems. We refer the reader to the seminal paper by Wagner and Brown [24] or the book by Barrett and Myers [21] for comprehensive descriptions of the application of statistical decision theory to LSI imaging systems.
3.B. Ideal observer and Bayesian signal detection theory
The first step in assessing objective measures of image quality is to specify a diagnostic task. In this work, we consider a simple binary detection task where the goal is to detect the presence of a low-contrast signal in a noise-contaminated image. We consider the SKE/BKE task in which a completely specified signal is to be detected against a completely specified background.
Consider a generic 2D LSI imaging system described as
| (13) |
where f(x, y) represents the input object, h(x, y) is the point spread function characterizing the system, n(x, y) is stochastic measurement noise, and g(x, y) is the measured image. Here and elsewhere, boldface fonts denote stochastic quantities. Note that, in the SKE/BKE detection task, f(x, y) and h(x, y) are known and non-random, so statistical fluctuations in g(x, y) are due only to the measurement noise n(x, y). In the binary detection task, the decision maker (i.e., observer) must decide whether the object f(x, y) or f(x, y) + Δf(x, y) produced the observed image data g(x, y). Here, f(x, y) can be interpreted as the object background and Δf(x, y) represents the signal of interest. This is equivalent to hypothesis testing where the observer must choose between the two hypotheses:
| (14a) |
| (14b) |
where hypotheses H0 and H1 represent the signal absent and signal present cases, respectively.
The Bayesian ideal observer is a computational observer that makes optimal use of all available statistical information in a signal detection task such as the one described above. The ideal observer operates by computing a scalar likelihood ratio test statistic [43] as
| (15) |
where pr(g|Hn) is the probability density function that describes g(x, y) given that hypothesis Hn is true. The decision is made by comparing the test statistic to a decision threshold. The ideal observer provides a bound on signal detection performance that no observer can surpass and therefore leads to an absolute scale for imaging system performance evaluation. A figure-of-merit describing the performance of the ideal observer for the SKE/BKE detection task is given by the ideal observer SNR [24] that is defined as
| (16) |
where < t >n denotes the conditional mean of t given that Hn was true and is the corresponding conditional variance. This quantity represents a measure of the overlap of the conditional probability density functions for the likelihood ratio under the signal present and signal absent hypotheses.
For 2D LSI imaging systems and statistically stationary measurement noise, the ideal observer SNR can be expressed in the 2D Fourier domain [24]. Let denote the 2D FT of the signal Δf(x, y). The squared ideal observer SNR can be computed as (e.g. see Appendix C in Ref. [31])
| (17) |
where MTF(u, v) = | {h(x, y)}| is the modulation transfer function of the LSI system and N(u, v) is the noise power spectrum. Note that, on the right-hand side of Eqn. (17), the quantity
| (18) |
is known as the noise equivalent quanta (NEQ) [44].
Equation (17) provides useful insights into the performance of an LSI imaging system as measured by the squared ideal observer SNR. The quantity NEQ(u, v) summarizes the frequency-dependent contribution of the imaging system hardware. The frequency-dependent contribution of the task is described solely by the quantity , which weights the corresponding value of NEQ(u, v) in determining the ideal observer SNR. In Section 4 the interplay between these contributing factors to detection performance is examined for phase-contrast imaging systems.
Within the Fourier optics framework described above, Hanson [45] investigated several higher-order detection or discrimination tasks that are related to edge detection. Ideal observer performance in these cases can be described by a generalization of Eqn. (17) of the form
| (19) |
where W(u, v) is a real-valued weighting function that generally places greater emphasis on the mid- to high-frequency content of NEQ(u, v), and the subscript ‘h’ denotes that corresponds to a higher-order task.
4. Interpretation of ideal observer SNRs for phase-contrast imaging
Below the ideal observer SNR corresponding to a SKE/BKE detection task is investigated for phase-contrast imaging systems employing linear shift-invariant optical systems.
4.A. Object model
The object/signal model considered for the SKE/BKE detection task is shown in Fig. 2. A weak phase-amplitude signal is embedded in an absorbing semi-infinite background of thickness L that possesses no variations in its complex refractive index distribution perpendicular to the optical axis (z-axis). The X-ray refractive index distributions of the signal and background will be denoted as
Fig. 2.
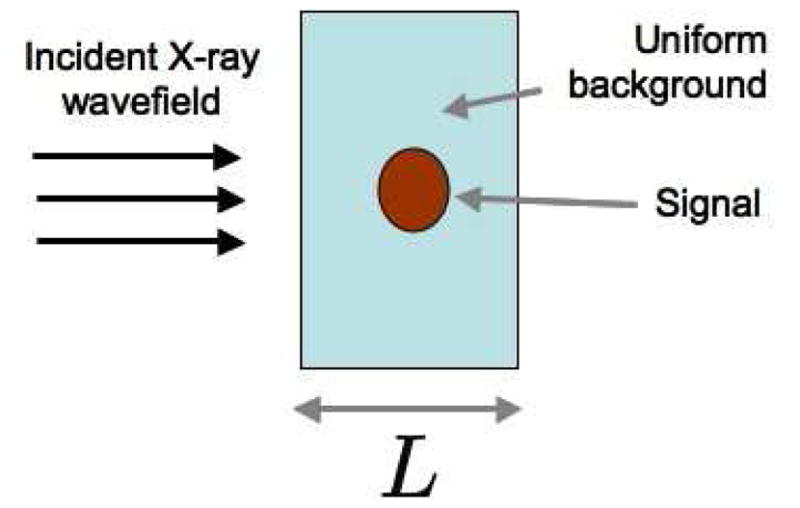
A schematic of the object model employed in our signal detection studies.
| (20a) |
and
| (20b) |
respectively. When the signal is present, the object’s transmission function is given by Eqn. (4) with A(x, y) and φ(x, y) specified as
| (21a) |
| (21b) |
where ts(x, y) is the projected thickness of the signal in the direction of the optical axis.
Consider the difference signals
| (22a) |
| (22b) |
which are assumed to be weak in the sense that Ad(r⃗) and φd(r⃗) satisfy Eqn. (8). Additionally, we will refer to the first term in Eqn. (21a) as
| (23) |
It can be verified that the 2D FT of the ideal phase-contrast wavefield intensity (prior to degradation by the measurement process) in the signal present case satisfies
| (24) |
where the subscript ‘1’ has been added to Im,1(x, y) to indicate the signal present case. Recall that the subscript ‘m’ denotes that the optical system that modifies the underlying wavefield was specified by the impulse response Gm(x, y) (see Eqns. (6) and (7)). If the absorbing background medium is removed (nb(z) = 1), Eqn. (24) reduces to Eqn. (10). Note that is a mixed contrast image with its intensity variations being caused by variations in Ad(x, y) (absorption-contrast) and φd(x, y) (phase-contrast). In biomedical imaging applications of X-ray phase-contrast imaging, phase-contrast typically result in an edge enhancement effect.
For the signal absent case, the 2D FT of the ideal wavefield intensity is given by
| (25) |
where the subscript ‘0’ has been added to Im,0(x, y) to indicate the signal absent case. Because the background slab does not introduce any transverse variations in the phase of the probing wavefield, phase-contrast is absent and the image represents a uniform absorption-based radiograph.
4.B. Formulation of the SKE/BKE detection task
We will consider that the measurement process can be described by an incoherent 2D LSI imaging system as
| (26) |
where Im(x, y) represents the ideal noiseless image intensity, h(x, y) is the point spread function (PSF) characterizing the detection system, n(x, y) is stochastic measurement noise, and gm(x, y) is the measured image. The measurement noise n(x, y) is assumed to be additive and statistically stationary, which are reasonable assumptions given the low-contrast nature of the signals we consider. Note that for low-contrast signals, Poisson image noise can be approximately described as additive and Gaussian. The PSF h(x, y) describes all sources of spatial resolution degradation that do not correlate the measurement noise [24]. In addition to the detector response, this could include blurring effects associated with the use of a partially coherent wavefield for imaging [46,47].
In the binary SKE/BKE detection task under consideration, the decision maker must decide whether Im(x, y) = Im,0(x, y) or Im(x, y) = Im,1(x, y) resulted in the observed image data gm(x, y). This is equivalent to hypothesis testing where the observer must choose between the two hypotheses:
| (27a) |
| (27b) |
4.C. General formulation of ideal observer SNR for phase-contrast imaging
Below, the ideal observer SNR for phase-contrast imaging is formulated for the detection task described in Section 4.B.
Let ΔIm(x, y) ≡ Im,0(x, y) − Im,1(x, y) denote the difference signal whose 2D FT satisfies
| (28) |
As described by Eqn. (17), the square of the ideal observer SNR for the SKE/BKE detection task under consideration is given by
| (29) |
On substitution from Eqn. (28) into Eqn. (29), SNR2 can be expressed as
| (30) |
where
| (31a) |
| (31b) |
and
| (31c) |
where Re{·} denotes the real-valued component of a complex-valued number. The interpretation of the SNR2 in terms of these three components represents a key contribution of this work, and will be investigated in the remainder of the article.
The three contributions to SNR2 have distinct interpretations associated with the imaging physics and contrast mechanisms that provide insight into how phase- and absorption-contrast contribute to signal detection performance. To understand this, consider the intensity image Im,1(x, y) whose 2D FT is specified in Eqn. (24):
| (32) |
where
| (33a) |
and
| (33b) |
The first term on the right-hand side of Eqn. (32) represents the intensity of the incident wavefield that has been attenuated by the background, while the second two terms represent contributions that arise from absorption-contrast and phase-contrast associated with the signal. In terms of these quantities, each of the components in Eqn. (30) can be assigned a simple interpretation. Namely, and describe the ideal observer performance for the SKE/BKE tasks of detecting the single-contrast signals and , respectively. Alternatively, the component describes detection performance for a detection task involving a cross-correlation of the absorption- and phase-contrast signal components. Specifically, this task involves the use of as a template that is cross-correlated with .
The quantities and can be alternatively interpreted in terms of the higher- order detection tasks. For example, corresponds to Eqn. (19) with and . This reveals that can be interpreted as the ideal observer performance metric for a higher-order binary detection task involving the absorption signal Ad(x, y), where the specific task determined by the modulus of the ATF. Similarly, corresponds to Eqn. (19) with and . This reveals that can be interpreted as the ideal observer performance metric for a higher-order binary detection task involving the phase signal φd(x, y), where the specific task determined by the modulus of the PTF.
In the following two Sections, the components of SNR2 are examined for the cases of propagation-based and analyzer-based phase-contrast imaging.
5. Example: Propagation-based phase-contrast imaging
Below, we apply the findings described in Section 4 to examine the squared ideal observer SNR for propagation-based phase-contrast imaging in the contrast transfer function formulation. For additional details regarding this method, we refer the reader to Refs. [42] and [48].
5.A. Explicit forms for the squared ideal observer SNR
Assuming the object is irradiated by a monochromatic plane-wave, the impulse response Gm(x, y) in Eqn. (6) for the case of propagation-based imaging is specified by the Fresnel propagator kernel [38] with different values of m corresponding to distinct object-to-detector distances zm. In the contrast transfer function formulation of propagation-based imaging [39,40,42,48] the ATF and PTF are given by
| (34a) |
and
| (34b) |
In this case, the components of SNR2 in Eqn. (31) are given by
| (35) |
| (36) |
and
| (37) |
In the above expressions we have employed the fact that, for the Fresnel propagator, |G̃m(0, 0)| = |ejkzm| = 1.
Simplified expressions that yield additional insights can be obtained when the near-field condition is satisifed. Here, uc and vc are cut-off frequencies determined by the finite spatial resolution of the imaging system. By use of the near-field condition, the ATF and PTF can be approximated as
| (38a) |
and
| (38b) |
and therefore the difference signal in Eqn. (28) reduces to
| (39) |
Accordingly, Eqns. (35)–(37) can be expressed as
| (40) |
| (41) |
and
| (42) |
The functions Wφ(u, v) ≡ (u2+v2)2 and Wcc(u, v) ≡ u2+v2 describe the frequency weightings employed in the computations of and .
In the spatial domain, the difference signal in Eqn. (39) is given by
| (43) |
where ∇2 denotes the 3D Laplacian operator. If we define
| (44) |
Eqns. (40)–(42) can be expressed as
| (45) |
| (46) |
and
| (47) |
5.B. Interpretations and effects of partial spatial coherence
Equation (40) shows that, for low-contrast signals and near-field imaging geometries, corresponds to the ideal observer SNR2 for a SKE/BKE detection task involving the absorption signal (x, y). However, the equations for and (Eqns. (41) and (42) or Eqns. (46) and (47)) describe higher-order detection tasks that involve a preferential weighting of the higher frequency components of the NEQ as prescribed by Wφ(u, v) and Wcc(u, v). In particular, as stated in Eqn. (46), corresponds to the ideal observer SNR2 for a SKE/BKE detection task involving the signal ∇2φd(x, y). Equation (47) reveals that describes the performance of a detection task involving a cross-correlation of Ad(x, y) and ∇2φd (x, y). It is interesting to note that, in the case of a one-dimensional (1D) signal, the expressions that determine and can also be interpreted in terms of binary object detection and signal position discrimination tasks that are described in Ref. [45].
For propagation-based imaging, the NEQ can be expressed as
| (48) |
where MTFdet(u, v) denotes the MTF of the detection system and MTFcoh(u, v) describes blurring effects associated with the use of illumination with imperfect spatial coherence [46]. The effective width of MTFcoh(u, v) is inversely proportional to the angular divergence of the incident illumination, with MTFcoh(u, v) → 1 as the angular divergence tends to zero. These observations confirm that the magnitudes of the components of the SNR that are influenced by phase-contrast effects, namely and , will decrease more rapidly than that of as the spatial coherence of the beam is decreased. In the limit of large blur, when the essential support of MTFcoh(u, v) becomes sufficiently narrow, phase-contrast effects are effectively “washed-out” and only SNRA will contribute significantly to the overall SNR.
5.C. Numerical examples
Equations (35)–(37) were implemented numerically to gain quantitative insights into the relative contributions of phase- and absorption-contrast to the squared ideal observer SNR. The signal corresponded to a uniform rod of radius R = 20 μm composed of breast tumor tissue embedded in a uniform layer of fat tissue of thickness 3 cm. The energy-dependent refractive index values n = 1 − (E) + jβ(E) of the tissues were computed from knowledge of the breast tissue composition and density as described in [49–51]. The rod was assumed to be of infinite extent with its long axis oriented perpendicular to the optical axis of the imaging system. The quantities Ãd(u, v) and φ̃d(u, v) were computed analytically as
| (49a) |
and
| (49b) |
where Jm(·) and δ(v) denote the Bessel function of order m and the one-dimensional Dirac delta function, respectively. The overall system PSF h(x, y) (see Eqn. (26)) was described by a 2D Gaussian function, and the object-to-detector distance was 1 m. White Gaussian noise was considered with N(u, v) = 1. The use of other noise levels with this noise model would result in a scaling of the SNR2 values. The relative contribution of each SNR2 component to the total SNR2 value would remain unchanged.
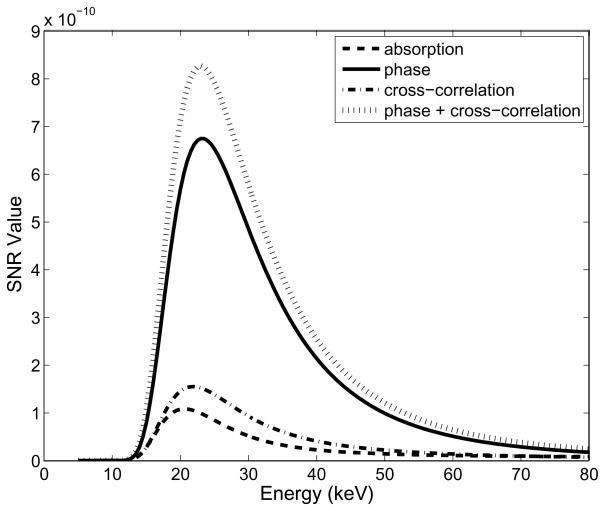
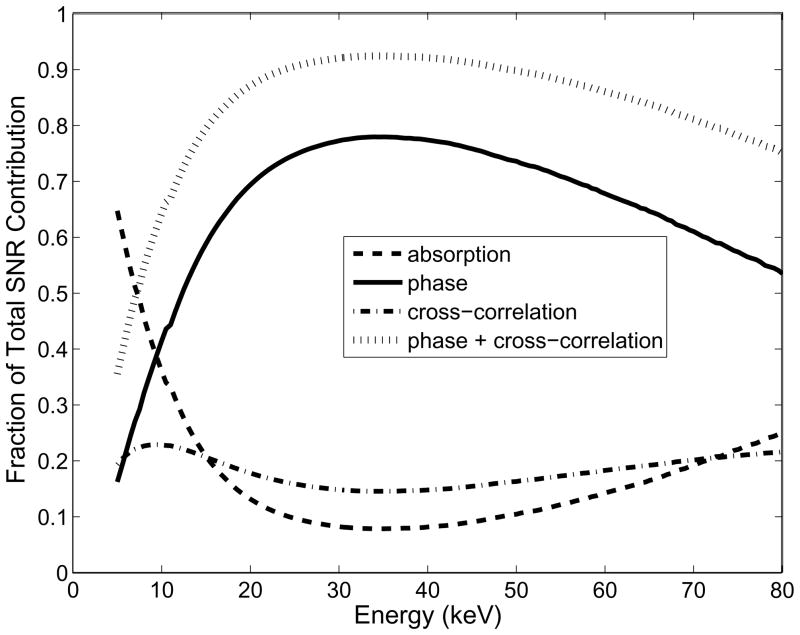
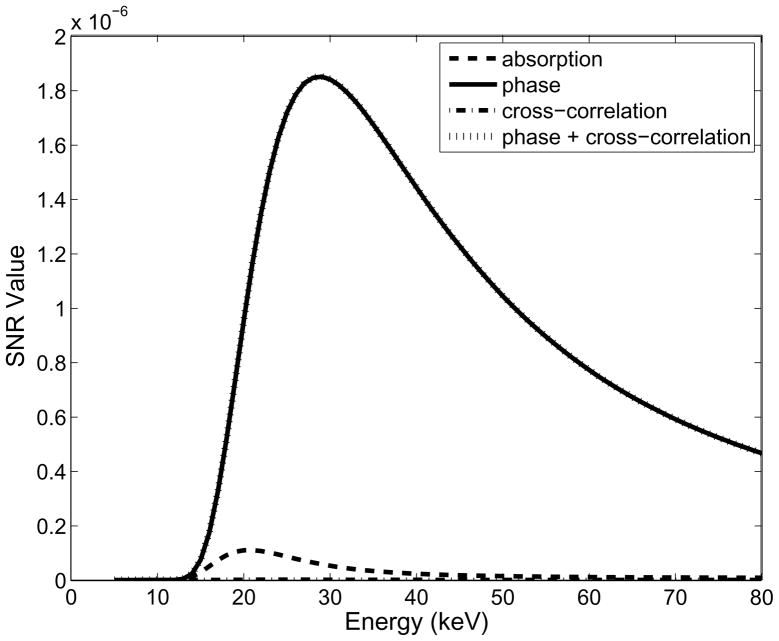
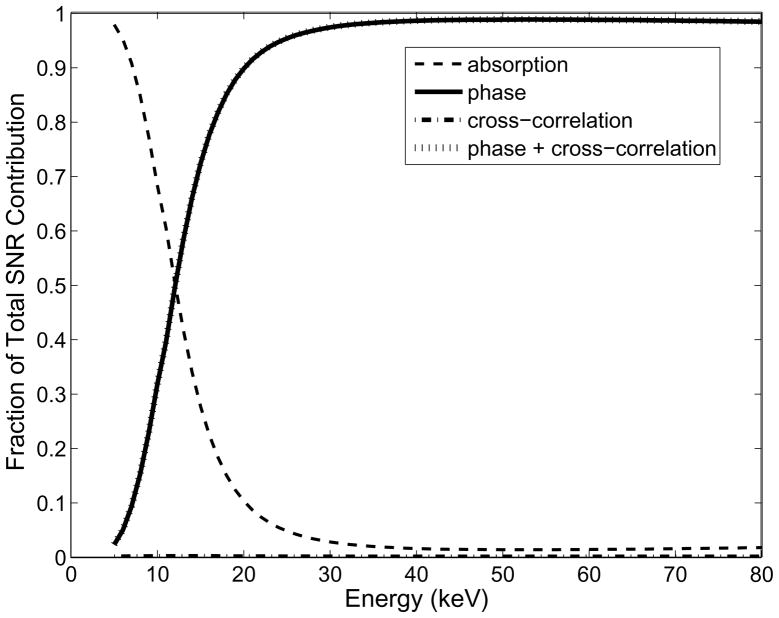
Figures 3 and 4 display the value of each SNR2 component and its fraction of the total SNR2 value, respectively, as a function of beam energy. In this case, the full width at half maximum (FWHM) of the system blur h(x, y) was fixed at 20 μm. For energies below approximately 10 keV, the absorption-contrast contribution to SNR2 is larger than the phase-contrast contribution. However, for higher beam energies the phase-contrast contribution dominates. This behavior is expected due to the fact that, in the diagnostic X-ray energy regime, phase-contrast diminishes less rapidly than absorption-contrast.
Fig. 3.
A plot of the values of the SNR2 components as a function of beam energy in propagation-based imaging.
Fig. 4.
A plot of the relative values of the SNR2 components as a function of beam energy in propagation-based imaging.
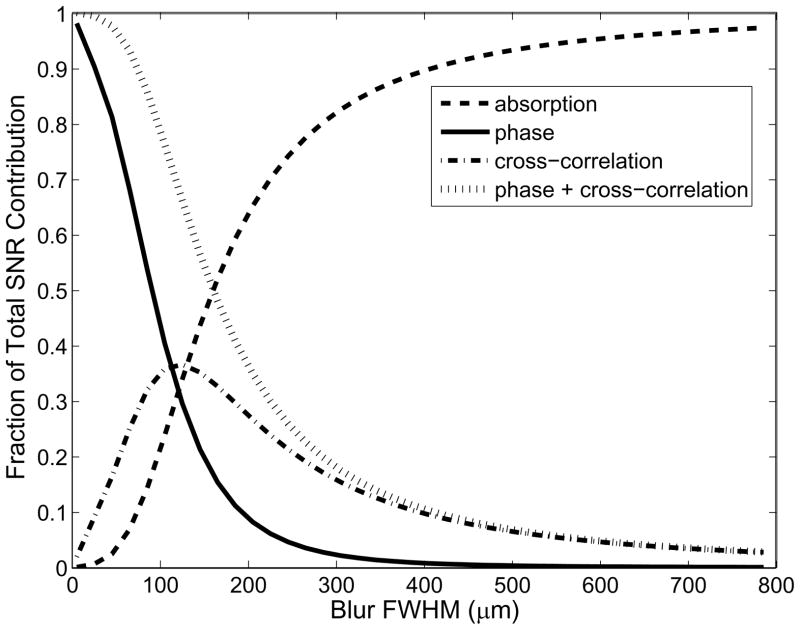
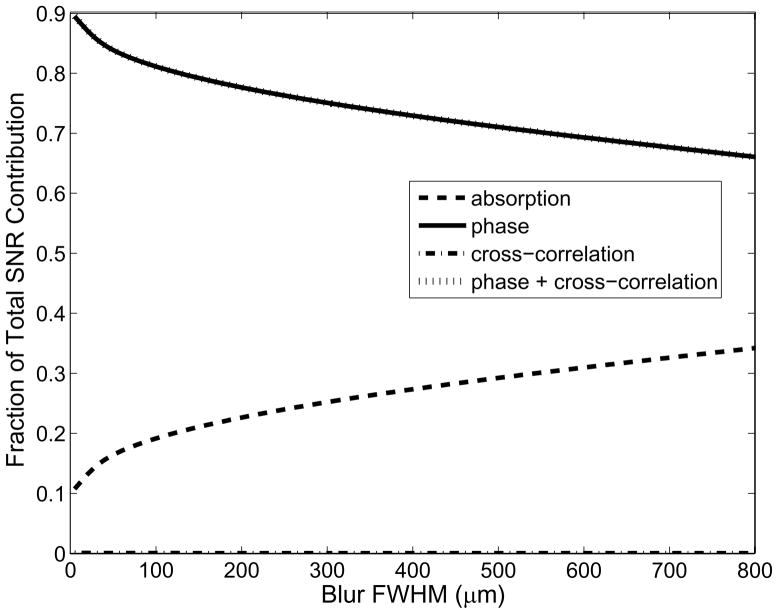
Figure 5 displays the fraction of each SNR2 component of the total SNR2 value as a function of the FWHM of the system blur h(x, y) for an illuminating beam of energy 20 keV. For the particular object under consideration, the phase-contrast contribution to SNR2 is larger than the absorption-contrast contribution when the FWHM of the system blur is less than approximately 120.757 μm. As expected, when the FWHM of the PSF increases the relative SNR2 contribution associated with phase-contrast decreases monotonically while the relative absorption-contrast contribution increases monotonically. Similarly, Eqns. (35)–(37) could be employed readily to quantify the SNR2 components for different objects and imaging geometries.
Fig. 5.
A plot of the relative values of the SNR2 components as a function of the system blur FWHM in propagation-based imaging.
6. Example: Analyzer-based phase-contrast imaging
As a second example, we apply the findings described in Section 4 to examine the squared ideal observer SNR for analyzer-based X-ray phase-contrast imaging [3, 52]. We refer the reader to Refs. [53] and [54] for Fourier optics descriptions of analyzer-based X-ray phase-contrast imaging.
6.A. Explicit forms for ideal observer SNR
We assume that the wavefield incident on the object is planar and monochromatic and that the analyzer crystal is defect-free. In this case, the impulse response Gm(x) depends only on a single coordinate [55] with different values of m corresponding to distinct angular orientations of the crystal. Let G0(x) describe the impulse response when the analyzer is set at its peak position, where the unperturbed incident wavefield satisfies the Bragg condition. When the analyzer is set in an angular position δθm from the peak position, the ATF and PTF are given by [53,54]
| (50a) |
and
| (50b) |
where . On substitution from Eqn. (50) into Eqn. (31) the components of SNR2 can be obtained.
Simplified expressions can be obtained if one assumes that Ãd(u, v) ≈ 0 and φ̃d(u, v) ≈ 0 for |u| < uc, where uc is some cutoff frequency. For sufficiently small uc, the quantities G̃0(u + ωm) and in Eqn. (50) can be approximated as
| (51a) |
| (51b) |
Accordingly, the ATF and PTF reduce to
| (52a) |
and
| (52b) |
Here, R(u) ≡ |G̃0(u)|2 defines the rocking curve of the analyzer and
| (53) |
where Im{·} denotes the imaginary-valued component of a complex-valued number. The difference signal in Eqn. (28) can accordingly be expressed as
| (54) |
or, in the spatial domain,
| (55) |
Note that these expressions are similar to what would be obtained by use of a geometrical optics approximation [26,27,54].
On substitution from Eqns. (52a) and (52b) into Eqn. (31), it can be verified readily that the SNR2 components take on particularly simple forms:
| (56) |
| (57) |
and
| (58) |
The SNR2 components in Eqns. (56)–(58) are expressed in the spatial domain as
| (59) |
| (60) |
and
| (61) |
6.B. Interpretations
Equations (56)–(58) describe SNR2s for higher-order detection tasks that prescribe a preferential weighting of the higher frequency components of the NEQ. The forms of these tasks, however, is distinct from those corresponding to the propagation-based method discussed in the previous section. Equations (56) and (59) reveal that is determined by Ad(x, y) and its first order derivative. Equations (57) and (60) reveal that is determined by the first order derivative of φd(x, y). Additionally, these equations reveal that the magnitude of is influenced strongly by the characteristics of the rocking curve due to the scaling factor .
6.C. Numerical examples
Numerical studies similar to those described in Section 5.C were conducted to demonstrate the relative contributions of phase- and absorption-contrast to the squared ideal observer SNR in analyzer-based phase-contrast imaging.
The transfer function G̃0(u) of the analyzer crystal was computed by use of Eqn. (13) in Ref. [56]. A silicon analyzer crystal using a [111] reflection was assumed. The ATF and PTF were determined by use of Eqn. (50) with . The angular position δθm of the analyzer was set at the angular location where the magnitude of the rocking curve was one half of its maximum value. The energy-dependent angular Darwin widths of the crystal were calculated assuming no crystal absorption [57]. The object model described in Section 5.C was utilized, but the radius of the uniform rod was set at 1 mm. As before, the quantities Ãd(u, v) and φ̃d(u, v) were computed analytically, and the overall system PSF h(x, y) (see Eqn. (26)) was described by a 2D Gaussian function.
Figures 6 and 7 display the value of each SNR2 component and its fraction of the total SNR2 value, respectively, as a function of beam energy. In this case, the FWHM of h(x, y) was fixed at 2 μm. For energies below approximately 21.31 keV, the absorption-contrast contribution to SNR2 is larger than the phase-contrast contribution. However, for higher beam energies the phase-contrast contribution dominates. Figure 8 displays the relative value of the SNR2 components as a function of the FWHM of h(x, y) for an illuminating beam energy of 20 keV. For the particular object under consideration, the phase-contrast contribution to SNR2 is larger than the absorption-contrast contribution for all FWHMs of the system blur in the considered range. This result is different than observed for the case of propagation-based imaging (Fig. 5), in which the phase-contrast contribution rapidly diminishes as the amount of system blur is increased. This is consistent with the fact that analyzer-based imaging does not rely on spatial coherence to realize phase-contrast.
Fig. 6.
A plot of the values of the SNR2 components as a function of beam energy in analyzer-based imaging.
Fig. 7.
A plot of the relative values of the SNR2 components as a function of beam energy in analyzer-based imaging.
Fig. 8.
A plot of the relative values of the SNR2 components as a function of the system blur FWHM in analyzer-based imaging.
7. Summary
The ideal observer SNR is a summary measure of optimal signal detection performance based on Bayesian decision theory and represents a meaningful metric for optimizing imaging hardware and data-acquisition protocols. In this work we have applied concepts from statistical detection theory to analyze the components of the ideal observer SNR2 in phase-contrast imaging for a SKE/BKE detection task involving a weak signal. This quantified the inherent interplay between the imaging physics and spatial resolution response of the imaging system that determines the relative contribution of phase- and absorption-contrast to ideal observer signal detectability. Propagation-based and analyzer-based X-ray phase-contrast imaging were considered as special cases of our analysis, and the relative magnitudes the squared SNR components under different physical conditions were numerically quantified. The theoretical framework we employed may also be useful for designing and optimizing new methods for phase-contrast imaging.
Our analysis assumed that the measured intensity data were continuous and therefore ignored the discrete nature of the data that would be recorded in a digital imaging system. Unless the detection system is film-based or the discrete detector elements are sufficiently small, sampling effects can influence signal detection measures. An interesting discussion of this within the context of conventional radiography can be found in Ref. [58]. Nevertheless, the continuous analysis in this paper based on Fourier optics provides fundamental insights into the interplay between the phase-contrast imaging physics and an imaging system’s pre-sampling PSF as it relates to signal detectability.
Because relatively few works [26, 27, 29, 30] have utilized task-based measures of image quality in studies of phase-contrast imaging, there remain many important avenues for future research. In this study, we considered a very simple detection task in which the background structure was assumed to be known. It will be interesting and important to investigate the effects of randomness in the background structure on signal detectability. Fully digital measures of signal detectability should also be systematically investigated. Additionally, the framework we presented can be applied to analyze and compare the relative contributions of absorption- and phase-contrast to signal detectability for a variety of existing and future phase-contrast imaging systems.
Acknowledgments
This work was supported in part by National Science Foundation (NSF) awards CBET-0546113 and CBET-0854430 and National Institutes of Health (NIH) award EB009715. AMZ was supported by NIH award CA136102. JGB was supported by NIH award HL091017.
References
- 1.Gabor D. A new microscopic principle. Nature. 1948;161(4098):777–778. doi: 10.1038/161777a0. [DOI] [PubMed] [Google Scholar]
- 2.Nugent KA, Gureyev TE, Cookson D, Paganin D, Barnea Z. Quantitative phase imaging using hard x-rays. Physical Review Letters. 1996;77:2961–2964. doi: 10.1103/PhysRevLett.77.2961. [DOI] [PubMed] [Google Scholar]
- 3.Ingal VN, Beliaevskaya EA. X-ray plane-wave topography observation of the phase contrast from a non-crystalline object. Journal of Physics D: Applied Physics. 1995;28:2314–2317. [Google Scholar]
- 4.Chapman D, Thomlinson W, Johnston R, Washburn D, Pisano E, Gmur N, Zhong Z, Menk R, Ardeli F, Sayers D. Diffraction enhanced x-ray imaging. Physics in Medicine and Biology. 1997;42:2015–2025. doi: 10.1088/0031-9155/42/11/001. [DOI] [PubMed] [Google Scholar]
- 5.Wernick MN, Wirjadi O, Chapman D, Zhong Z, Galatsanos NP, Yang Y, Brankov JG, Oltulu O, Anastasio MA, Muehleman C. Multiple-image radiography. Physics in Medicine and Biology. 2003;48(23):3875–3895. doi: 10.1088/0031-9155/48/23/006. [DOI] [PubMed] [Google Scholar]
- 6.Zernike F. Phase contrast, a new method for the microscopic observation of transparent objects. Physica. 1942;9:686–698. [Google Scholar]
- 7.Wilhein T, Kaulich B, Fabrizio ED, Romanato F, Cabrini S, Susini J. Differential interference contrast X-ray microscopy with submicron resolution. Applied Physics Letters. 2001;78:2082. [Google Scholar]
- 8.Tanaka T, Honda C, Matsuo S, Noma K, Ohara H, Nitta N, Ota S, Tsuchiya K, Sakashita Y, Yamada A, Yamasaki M, Furukawa A, Takahashi M, Murata K. The first trial of phase contrast imaging for digital full-field mammography using a practical molybdenum x-ray tube. Investigative Radiology. 2005;40:385–396. doi: 10.1097/01.rli.0000165575.43381.48. [DOI] [PubMed] [Google Scholar]
- 9.Wu X, Liu H. Clinical implementation of x-ray phase-contrast imaging: Theoretical foundations and design considerations. Medical Physics. 2003;30:2169–2179. doi: 10.1118/1.1593836. [DOI] [PubMed] [Google Scholar]
- 10.Donnelly EF, Price RR, Pickens DR. Characterization of the phase-contrast radiography edge-enhancement effect in a cabinet x-ray system. Medical Physics. 2003;30:2292–2296. doi: 10.1088/0031-9155/51/1/002. [DOI] [PubMed] [Google Scholar]
- 11.Wilkins SW, Gureyev TE, Gao D, Pogany A, Stevenson AW. Phase-contrast imaging using polychromatic hard X-rays. Nature (London) 1996;384:335–338. [Google Scholar]
- 12.Snigirev A, Snigireva I, Kohn V, Kuznetsov S, Schelokov I. On the possibilities of x-ray phase contrast microimaging by coherent high-energy synchrotron radiation. Review of Scientific Instruments. 1995;66:5486–5492. [Google Scholar]
- 13.Cloetens P, Barrett R, Baruchel J, Guigay JP, Schlenker M. Phase objects in synchrotron radiation hard x-ray imaging. Journal of Physics D. 1996;29:133–146. [Google Scholar]
- 14.Pfeiffer F, Weitkamp T, Bunk O, David C. Phase retrieval and differential phase-contrast imaging with low-brilliance x-ray sources. Nature physics. 2006;2:258–261. [Google Scholar]
- 15.Kotre CJ, Birch IP, Robson KJ. Anomalous image quality phantom scores in magnification mammography: evidence of phase contrast enhancement. The British Journal of Radiology. 2002;75:170–173. doi: 10.1259/bjr.75.890.750170. [DOI] [PubMed] [Google Scholar]
- 16.Paganin D, Barty A, Mcmahon PJ, Nugent KA. Quantitative phase-amplitude microscopy III. The effects of noise. Journal of Microscopy. 2003;214:51–61. doi: 10.1111/j.0022-2720.2004.01295.x. [DOI] [PubMed] [Google Scholar]
- 17.Arhatari BD, Mancuso AP, Peele AG, Nugent KA. Phase contrast radiography: Image modelling and optimization. Review of Scientific Instruments. 2004;75:5271–5276. [Google Scholar]
- 18.Wu X, Liu H, Yan A. Optimization of X-ray phase-contrast imaging based on in-line holography. Nuclear Instruments and Methods in Physics Research B. 2005;234:563–572. [Google Scholar]
- 19.Nesterets YI, Wilkins SW, Gureyev TE, Pogany A, Stevenson AW. On the optimization of experimental parameters for x-ray in-line phase-contrast imaging. Review of Scientific Instruments. 2005;76:093706. [Google Scholar]
- 20.Gureyev TE, Nesterets YI, Stevenson AW, Miller PR, Pogany A, Wilkins SW. Some simple rules for contrast, signal-to-noise and resolution in in-line x-ray phase-contrast imaging. Opt Express. 2008;16(5):3223–3241. doi: 10.1364/oe.16.003223. [DOI] [PubMed] [Google Scholar]
- 21.Barrett HH, Myers K. Wiley Series in Pure and Applied Optics. 2004. Foundations of Image Science. [Google Scholar]
- 22.Barrett HH. Objective assessment of image quality: effects of quantum noise and object variability. Journal of the Optical Society of America A. 1990;7:1266–1278. doi: 10.1364/josaa.7.001266. [DOI] [PubMed] [Google Scholar]
- 23.Barrett HH, Yao J, Rolland JP, Myers KJ. Model observers for assessment of image quality. Proc Natl Acad Sci. 1993;90:9758–9765. doi: 10.1073/pnas.90.21.9758. [DOI] [PMC free article] [PubMed] [Google Scholar]
- 24.Wagner RF, Brown DG. Unified SNR analysis of medical imaging systems. Physics in Medicine and Biology. 1985;30(6):489–518. doi: 10.1088/0031-9155/30/6/001. [DOI] [PMC free article] [PubMed] [Google Scholar]
- 25.Insana MF, Hall TJ. Visual detection efficiency in ultrasonic imaging: A framework for objective assessment of image quality. The Journal of the Acoustical Society of America. 1994;95:2081. [Google Scholar]
- 26.Brankov JG, Saiz-Herranz A, Wernick MN. Noise analysis for diffraction enhanced imaging. Proc IEEE/NIH Intl Symp Biomed Imaging. 2004;2:1428–1431. [Google Scholar]
- 27.Brankov JG, Saiz-Herranz AA, Wernick MN. Task-based evaluation of diffraction-enhanced imaging. 2005 IEEE Nuclear Science Symposium Conference Record; 2005. p. 3. [DOI] [PMC free article] [PubMed] [Google Scholar]
- 28.Majidi K, Brankov JG, Wernick MN. Sampling strategies in multiple-image radiography. Proceedings of the IEEE/NIH International Symposium on Biomedical Imaging. [Google Scholar]
- 29.Chou CY, Anastasio MA. Influence of imaging geometry on noise texture in quantitative in-line x-ray phase-contrast imaging. Optics Express. 2009;17(17):14 466–14 480. doi: 10.1364/oe.17.014466. [DOI] [PubMed] [Google Scholar]
- 30.Chou CY, Anastasio MA. Noise texture and signal detectability in propagation-based x-ray phase-contrast tomography. Medical Physics. 2010;37(1):270–281. doi: 10.1118/1.3267548. [Online] [DOI] [PubMed] [Google Scholar]
- 31.Medical imaging - the assessment of image quality, ICRU Report 54. International Commission on Radiation Units and Measurements; 7910 Woodmontt Ave., Bethesda, MD, 20814: 1996. [Google Scholar]
- 32.Paganin DM. Coherent X-Ray Optics. Oxford University Press; 2006. [Google Scholar]
- 33.Paganin DM, Gureyev TE. Phase-contrast, phase retrieval and aberration balancing in shift-invariant linear imaging systems. Optics Communications. 2008:965–981. [Google Scholar]
- 34.Paganin D, Gureyev TE, Pavlov KM, Lewis RA, Kitchen M. Phase retrieval using coherent imaging systems with linear transfer functions. Optics Communications. 2004;234(1–6):87–105. [Google Scholar]
- 35.Faulkner HML, Allen LJ, Oxley MP, Paganin D. Computational aberration determination and correction. Optics Communications. 2003;216(1–3):89–98. [Google Scholar]
- 36.Pavlov KM, Gureyev TE, Paganin D, Nesterets Y, Morgan MJ, Lewis RA. Linear systems with slowly varying transfer functions and their application to x-ray phase-contrast imaging. J Phys D Appl Phys. 2004;37:2746–2750. [Google Scholar]
- 37.Goodman JW. Introduction to Fourier Optics. 3. Roberts & Company Publishers; 2004. [Google Scholar]
- 38.Born M, Wolf E. Principles of Optics. Pergamon Press; New York: 1980. [Google Scholar]
- 39.Guigay JP. Fourier transform analysis of Fresnel diffraction patterns and in-line holograms. Opitk. 1977;49:121–125. [Google Scholar]
- 40.Shi D, Anastasio MA. Relationships between smooth-and small-phase conditions in X-ray phase-contrast imaging. IEEE Transactions on Medical Imaging. 2009;28(12):1969. doi: 10.1109/TMI.2009.2026899. [DOI] [PubMed] [Google Scholar]
- 41.Cloetens P, Ludwig W, Boller E, Helfen L, Salvo L, Mache R, Schlenker M. Quantitative phase-contrast tomography using coherent synchrotron radiation. Developments in X-ray Tomography III, Proceedings of the SPIE. 2002;4503:82–91. [Google Scholar]
- 42.Gureyev TE, Myers GR, Nesterets YI, Paganin D, Pavlov KM, Wilkins SW. Stability and locality of amplitude and phase contrast tomographies. Proc of SPIE. 2006;6318:63180V. [Google Scholar]
- 43.Green DM, Swets JA. Signal detection theory and psychophysics. Wiley; New York: 1966. [Google Scholar]
- 44.Cunningham IA, Shaw R. Signal-to-noise optimization of medical imaging systems. Journal of the Optical Society of America A. 1999;16(3):621–632. [Google Scholar]
- 45.Hanson KM. Variations in task and the ideal observer. SPIE conference on application of optical instrumentation to medicine; 1983. [Google Scholar]
- 46.Pogany A, Gao D, Wilkins SW. Contrast and resolution in imaging with a microfocus x-ray source. Review of Scientific Instruments. 1997;68:2774–2782. [Google Scholar]
- 47.Nesterets Y, Gureyev T, Wilkins S. Polychromaticity in the combined PB/AB phase-contrast imaging. Journal of Physics D: Applied Physics. 2005;38:4259–4271. [Google Scholar]
- 48.Cloetens P, Ludwig W, Baruchel J, Dyck D, Landuyt J, Guigay JP, Schlenker M. Holotomography: Quantitative phase tomography with micrometer resolution using hard synchrotron radiation x rays. Applied physics letters. 1999;75:29132. [Google Scholar]
- 49.Phelps M, Hoffman E, Ter-Pogossian MM. Attenuation coefficients of various body tissues, fluids, and lesions at photon energies of 18 to 136 KeV. Radiology. 1975;117:573–583. doi: 10.1148/117.3.573. [DOI] [PubMed] [Google Scholar]
- 50.Kalef-Ezra JA, Karantanas AH, Koligliatis T, Boziari A, Tsekeris P. Electron density of tissues and breast cancer radiotherapy: a quantitative ct study. International Journal of Radiation Oncology Biology Physics. 1998;41(5):1209–1214. doi: 10.1016/s0360-3016(98)00169-2. [DOI] [PubMed] [Google Scholar]
- 51.Ullman G, Sandborg M, Hunt R, Dance DR, Carlsson GA. Tech Rep. Department of Radiation Physics, Linkoping University; Dec, 2003. Implementation of pathologies in the monte carlo model chest and breast. [Google Scholar]
- 52.Lewis R. Medical phase contrast x-ray imaging: current status and future prospects. Physics in Medicine and Biology. 2004;49:3573–3583. doi: 10.1088/0031-9155/49/16/005. [DOI] [PubMed] [Google Scholar]
- 53.Nesterets Y, Gureyev T, Paganin D, Pavlov K, Wilkins S. Quantitative diffraction-enhanced x-ray imaging of weak objects. Journal of Physics D: Applied Physics. 2004;37(8):1262–1274. [Google Scholar]
- 54.Guigay J, Pagot E, Cloetens P. Fourier optics approach to x-ray analyser-based imaging. Optics Communications. 2007;270(2):180–188. [Google Scholar]
- 55.Gureyev TE, Wilkins SW. Regimes of X-ray phase-contrast imaging with perfect crystals. Nuovo Cimento D. 1997;19:545–552. [Google Scholar]
- 56.Guigay J, Pagot E, Cloetens P. Fourier optics approach to X-ray analyser-based imaging. Optics communications. 2007;270(2):180–188. [Google Scholar]
- 57.Als-Nielsen J, McMorrow D. Elements of Modern X-ray Physics. Wiley; Chichester: 2001. [Google Scholar]
- 58.Pineda AR, Barrett HH. What does DQE say about lesion detectability in digital radiography? Proc of SPIE. 2001;4320:561–569. [Google Scholar]


