Abstract
Using microbubbles as model systems, we examined molecular diffusion and binding to colloidal surfaces in a bimodal PEG brush layers. A microbubble is a gaseous colloidal particle with diameter less than 10 μm, of which the surface comprises amphiphilic phospholipids self-assembled to form a lipid monolayer shell. Due to the compressible gas core, microbubbles provide a sensitive acoustic response and are currently used as ultrasound contrast agents. Similar to the design of long circulating liposomes, poly(ethylene glycol) (PEG) chains are typically incorporated into the shell of microbubbles to form a steric barrier against coalescence and adsorption of macromolecules to the microbubble surface. We introduced a buried-ligand architecture (BLA) design where the microbubble surface was coated with a bimodal PEG brush. After microbubbles were generated, fluorescent ligands with different molecular weights were conjugated to the tethered functional groups on the shorter PEG chains, while the longer PEG chains served as a shield to protect these ligands from exposure to the surrounding environment. BLA microbubbles reduced the binding of macromolecules (>10 kDa) to the tethers due to the steric hindrance of the PEG overbrush, while allowing the uninhibited attachment of small molecules (<1 kDa). Roughly 40% less fluorescein-conjugated streptavidin (SA-FITC) bound to BLA microbubbles compared to exposed-ligand architecture (ELA) microbubbles. The binding of SA-FITC to BLA microbubbles suggested a possible phase separation between the lipid species on the surface leading to populations of revealed and concealed ligands. Ligand conjugation kinetics was independent of microbubble size, regardless of ligand size or microbubble architecture. We observed, for the first time, streptavidin-induced surface structure formation for ELA microbubbles, and proposed that this phenomenon may be correlated to flow cytometry scattering measurements. We therefore demonstrated the feasibility of post-labeling for small-molecule ligands to BLA microbubbles to generate stealth targeted ultrasound contrast agents.
Keywords: phospholipid monolayer, buried-ligand architecture, biotin, streptavidin, FITC, ultrasound contrast agent, molecular imaging
Introduction
The same principles of molecular diffusion in a polymer brush that characterize reactions in a polymer-grafted flat surface also apply to the surface of a curved gas-lipid interface, such as that posed by the surface of a microbubble. A microbubble is a gas-filled colloidal particle with diameter less than 10 μm, of which the surface comprises amphiphilic phospholipids self-assembled to form a lipid monolayer shell. Similar to the design of long-circulation liposomes, poly(ethylene glycol) (PEG) chains, or PEG chain derivatives, are typically incorporated into the shell of microbubbles in order to form a steric barrier against coalescence and adsorption of macromolecules to the microbubble surface.1, 2 This protective role of PEG is commonly assumed due to the steric hindrance effect of the polymer brush – each PEG chain forms an impermeable “cloud” over the microbubble surface, which inhibits other molecules from diffusing into the brush layer.3, 4 Needham et al.4 showed that small PEG mushrooms could retard the binding of fluorescently labeled avidin to biotinylated liposomes As the PEG concentration increased, the overall vesicle fluorescence intensity decreased, indicating that the binding of avidin was retarded or even completely prevented due to the presence of PEG. Kuhl et al.5 also showed using a surface force apparatus that the dominant force that stabilized liposomes with short polymer chains grafted on the surface was steric repulsion. Repulsive thermal fluctuation forces swamped short-ranged van der Waals attraction and longer-range electrostatic interactions, and provided a physical barrier around the bilayer to prevent close approach of other surfaces, improving in vivo circulation persistence through reduction in opsonization and vesicle aggregation. However, for small molecules, this assumption is not expected to hold because they can find a path to the surface through the excluded volume.
For molecular imaging applications, the primary goal is to engineer a targeted contrast agent that has both high specificity and low immunogenicity. There are many surface functionalization strategies for conjugating targeting ligands to colloidal particles (liposomes, microbubbles, nanoparticles etc.), most notably through attaching specific ligands to the distal end of tethered PEG chains. However, targeting ligands typically present chemical groups (e.g., nucleophiles) that could trigger immune activation and decrease the circulation persistence of these colloidal particles. Thus, a useful structure may be a bimodal mixture of grafted PEG chains: a fraction of shorter PEG bearing targeting ligands and a fraction of longer PEG without ligands to minimize undesired immune complement activation and nonspecific adhesion.6, 7
The structure and molecular interactions of bimodal polymer mixtures have been widely studied both theoretically8–13 and experimentally14–19. Using a numerical self-consistent field model, Dan et al.11 showed that vertical segregation between the segments of the shorter and longer polymer chains occurred irrespective of the molecular weight differences or composition in a bimodal polymer brush layer. When two bimodal polymer surfaces were compressed, this stratification persisted. Lai et al.9 used Monte Carlo simulation to further confirm the segregation of the free ends of longer and shorter chains. They also showed that the structural properties of the shorter chains depended very little on the lengths of the longer chains when both were highly stretched.
Experimentally, Kim et al.18 showed in a force microscopy experiment that adhesion to avidin coated glass beads failed when biotin ligands were tethered to short PEG chains buried in a longer PEG overbrush. We previously reported similar results, in which specific adhesion of microbubbles with a bimodal polymer brush was partially prevented in hydrodynamic conditions in comparison to exposed-ligand architecture (ELA).6, 7 These results indicated that ligand accessibility could be reduced when targeting ligands are attached to the shorter PEG in a bimodal mixture of PEG chains, therefore reducing undesired immune response. To the best of our knowledge, the current study presents the first investigation using microbubbles as a model system to examine molecular diffusion and binding to colloidal surfaces in a bimodal PEG brush layer.
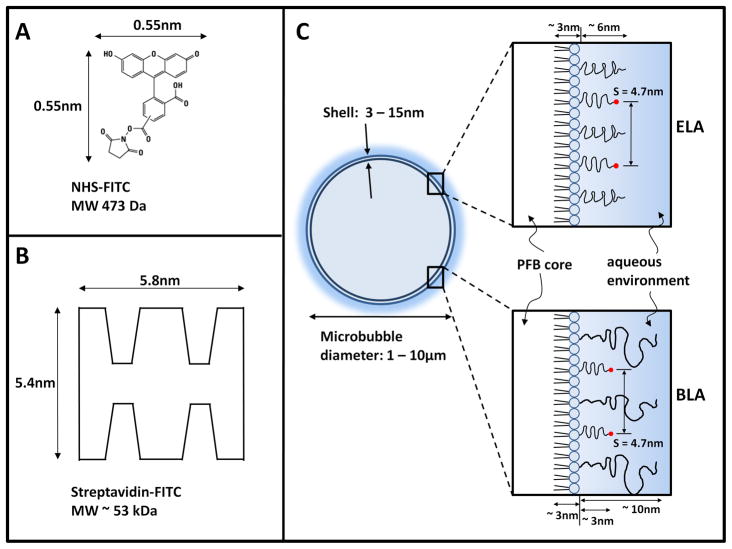
Due to the compressible gas core, microbubbles provide a sensitive acoustic response and are currently used as ultrasound contrast agents.20–26 When combined with targeting ligands,27 such as peptides, ultrasound allows the detection and evaluation of molecular biomarkers associated with intravascular pathology, including tumor angiogenesis, thrombosis and inflammation. In order to reduce the undesired immune response, we recently introduced a new microbubble construct for use with ultrasound radiation force (USRF) to allow triggered and specific adhesion.6, 7 This stealth microbubble design involved bimodal PEG polymer chains on the surface the targeting ligand was attached to the shorter PEG chains (~ 2000 Da) and was hidden, while the longer PEG (~ 5000 Da) overbrush served as a shield to inhibit ligand exposure and hence reduced the complement activated immune response in addition to prolonged in vivo circulation persistence (Figure 1C). Buried-ligand microbubbles experienced transient conversion from stealth to active under USRF – the shielded ligand was only revealed for binding during microbubble oscillation in the acoustic field, but buried again at the end of the USRF pulse. This buried-ligand architecture (BLA) design allowed spatial and temporal control of targeted adhesion. Promising results have shown that BLA microbubbles, in comparison with exposed-ligand architecture (ELA) microbubbles, reduced immunogenicity without reduction in targeted adhesion.
Figure 1.
(A) Molecular structure of NHS-FITC showing its estimated dimensions using the well-known Stokes-Einstein equation for the diffusion of a sphere in a liquid49. The diffusion constant of a free FITC molecule at 21.5°C in water was calculated to be 0.49×10⁻⁹ m2/s,50 and the dynamic viscosity of water was estimated to be 0.979×10⁻³ kg/m s. (B) Schematic diagram of streptavidin-FITC showing its estimated dimensions.51 (C) Cartoon showing the dimensions of a microbubble with either exposed- or buried-ligand architecture (ELA or BLA). The PEG chain length was estimated using self-consistent field (SCF) theory9 using values of 0.44 nm2 for the average projected area per lipid molecule32 and 0.35 nm for PEG monomer length. The lipid monolayer thickness was estimated to be ~3 nm based on the persistence length of the stearoyl chains.6
Microbubbles may be conjugated to a targeting ligand by either pre-labeling or post-labeling.28 Post-labeling requires the incorporation of functionalized lipids into the microbubble shell, and the targeting ligands are conjugated to the monolayer surface through either covalent bonds or noncovalent interactions after the microbubbles have been formed. This technique increases the efficiency of attaching targeting ligands since not all lipid molecules in the original liposomal mixture are incorporated into the microbubble shells. This is particularly true for size-selected microbubbles.29 Instead of having a ligand attached to all lipid molecules, one can calculate the amount of ligand needed for conjugation based on the microbubble concentration, size distribution and the area fraction of functionalized lipids of the microbubble suspension, thereby reducing the cost of synthesis. Post-labeling also increases versatility by allowing multiple ligands to be conjugated to the same microbubble batch. This platform strategy for targeted contrast agent production is expected to increase safety, economy, and ease-of-use, when compared to pre-labeling.
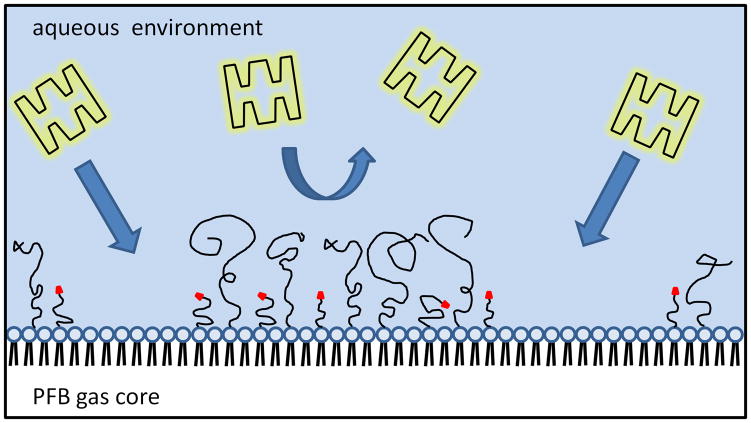
In order to utilize post-labeling for BLA microbubbles, one critical issue remains to be addressed: will the targeted ligand be able to diffuse through the PEG overbrush and bind to the tethered functional groups at the surface? On one hand, it is plausible that PEG will partially prevent the diffusion and attachment of macromolecules. However, polymer chains in solution are highly dynamic due to thermal fluctuations. Their thermally driven conformational sampling property, the breathing mode of the polymer chains, is expected to strongly affect the ligand accessibility. Jeppesen et al. 30 showed that tethered molecules extend well beyond their average equilibrium configuration over an experimental time scale of seconds, which broadens the overall spatial range of tethered ligand-receptor binding. It opens the argument that for large molecules that are excluded from the brush layer due to steric hindrance, binding to the surface is still possible due to these transient excursions of polymer chains. The kinetics of such reactions will depend on a complex interplay between polymer dynamics, molecular diffusion and intermolecular forces.
The purpose of the present study is to experimentally test the differences in ligand diffusion and binding rate between various PEG brush architectures, ligand sizes and binding modes. ELA and BLA microbubbles were generated to represent different polymer architectures. Solute size was varied by using 5/6-carboxyfluorescein succinimidyl ester (NHS-FITC) and fluorescein conjugated streptavidin (SA-FITC). NHS-FITC represents a class of smaller molecular ligands (<1 kDa), while SA-FITC represents a class of macromolelcular ligands (>10 kDa). By monitoring the fluorescence intensity change during binding, we showed evidence that BLA microbubbles indeed partially prevented the binding of large molecules to the surface while allowing the uninhibited attachment of smaller ones. These findings provide insight for binding of solutes to tethered groups in various brush architectures on a Langmuir monolayer-coated colloidal particle.
2. Materials and Method
2.1 Materials
All phospholipids were purchased from Avanti Polar Lipids, Inc. (Alabaster, AL), including 1,2-distearyol-sn-glycero-3-phosphocholine (DSPC), 1,2-distearyol-sn-glycero-3-phosphoethanolamine-N-[methoxy(polyethylene glycol)2000] (DSPE-PEG2000), 1,2-distearyol-sn-glycero-3-phosphoethanolamine-N-[amino(polyethylene glycol)2000] (DSPE-PEG2000-A), 1,2-distearyol-sn-glycero-3-phosphoethanolamine-N-[biotinyl(polyethylene glycol)2000] (DSPE-PEG2000-B) and 1,2-distearyol-sn-glycero-3-phosphoethanolamine-N-[methoxy(polyethylene glycol)5000] (DSPE-PEG5000). The emulsifier polyoxyethylene-40 stearate (PEG40S) was purchased from Sigma-Aldrich (St. Louis, MO). All microbubble shell components were dissolved in chloroform (Sigma-Aldrich) and stored in the freezer at −20 °C. The perfluorobutane gas (PFB, 99 wt% purity) used for microbubble generation was purchased from FluoroMed, L.P. (Round Rock, TX). The fluorophore probe 3,3′-dioctadecyloxacarbocyanine perchlorate (DiO) and 1,1′-dioctadecyl-3,3,3;3;-tetramethylindocarbocyanine perchlorate (DiI) solution (Invitrogen; Eugene, OR) was used to label microbubbles during the size-isolation and multimodal peak distribution experiment, respectively. NHS-FITC and SA-FITC were obtained from Pierce (Rockford, IL) and dissolved in N,N-dimethylformamide (DMF; Sigma-Aldrich) and 18 MΩ filtered deionized water (Direct-Q Millipore; Billerica, MA), respectively. Both solutions were stored at 4°C and discarded after 2 weeks.
2.2 Microbubble generation
Microbubbles used for size isolation and flow cytometry gate determination were made using DSPC and PEG40S at molar ratio 9:1. All other microbubble compositions used 90% DSPC and 10% DSPE-PEG (Table 1). The indicated amount of each lipid species was mixed in a separate vial, and chloroform was evaporated by flowing a steady stream of nitrogen over the vial during vortexing for about 10 minutes followed by several hours under house vacuum. 0.01 M phosphate buffer saline (PBS) solution (Sigma-Aldrich) was filtered using 0.2 μm pore size polycarbonate filters (VWR; West Chester, PA), and mixed with 10 vol% glycerol solution (Sigma-Aldrich) and 10 vol% 2-propanol solution (Sigma-Aldrich) to increase viscosity and lipid solubility. The dried lipid film was then hydrated with PBS mixture to a final lipid/surfactant concentration of 1 mg/mL.
Table 1.
Microbubble compositions.
| Experiment | Phospholipid Composition (mol %) | ||||
|---|---|---|---|---|---|
| DSPC | DSPE- PEG2000 | DSPE- PEG2000-A | DSPE- PEG2000-B | DSPE- PEG5000 | |
| ELA Control (no ligand) | 90 | 10 | - | - | - |
| ELA-biotin | 90 | 8 | - | 2 | - |
| ELA-amine | 90 | 8 | 2 | - | - |
| BLA control (no ligand) | 90 | - | - | - | 10 |
| BLA-biotin | 90 | - | - | 2 | 8 |
| BLA-amine | 90 | - | 2 | - | 8 |
Two methods of microbubble generation were used. For size isolation experiments, probe sonication was used as described elsewhere.29 Briefly, the hydrated lipid mixture was first sonicated with a 20 kHz probe (Model 250A, Branson Ultrasonics, Danbury, CT) at low power (power setting dialed to 3/10; 3 W) in order to heat the lipid suspension above the DSPC main phase transition temperature (~ 55 °C) and further disperse the lipid aggregates into small, unilamellar liposomes.31 1 mM DiO solution was added to the lipid suspension at an amount of 1 μL DiO solution per mL of lipid mixture. PFB was introduced by flowing it over the surface of the lipid suspension. Subsequently, high power sonication (power setting dialed to 10/10; 33 W) was applied to the suspension for about 10 s at the gas-liquid interface to generate microbubbles. No extra washing steps were done for the size-isolation experiment. For the size analysis and FITC-ligand binding experiment, the shaking method was used to generate microbubbles. The lipid suspension was first heated to 60 °C in a digital heatblock (VWR) for 10 min, and then sonicated at 60 °C in a bath sonicator (Model 1510, Branson Ultrasonics; Danbury, CT) for 30 s so that the lipid aggregates were completely dispersed. 1 mM DiI solution was added to the lipid suspension at an amount of 1 μL DiI solution per mL of lipid mixture to generate fluorescently labeled microbubbles for the size analysis. 2 mL of lipid suspension was then transferred to a 3 mL serum vial and sealed for gas exchange. Gas exchange of the vial headspace was done by first vacuuming out air and then flowing PFB into the vial. At least three cycles of gas exchange were done to ensure the lipid suspension was saturated with PFB, and subsequently a 27G needle was used to vent the vial in order to release the excess pressure. Microbubbles were formed by shaking with a VialMix (ImaRx Therapeutics; Tucson, AZ) for 45 s. The generated microbubbles were then diluted to 10 mL suspension with PBS, and washed 3 times by centrifugation flotation in a bucket-rotor centrifuge (Model 5804, Eppendorf; Westbury, NY) at 250G for 5 min. The microbubble cake was finally diluted with PBS for subsequent experiments. For NHS-FITC binding, pH adjusted PBS solution (pH 8.5) was used. PBS at physiological pH (7.4) was used for all other experiments, unless otherwise stated.
2.3 Microbubble size isolation and flow cytometry gate determination
Microbubble size isolation was done as described elsewhere.29 This technique allowed us to more effectively isolate microbubbles with a desired diameter due to their multimodal size distribution. Three microbubble size ranges were isolated: 1–2 μm, 4–5 μm and 6–8 μm. An Accusizer optical particle counter (NICOMP Particle Sizing System; Santa Barbara, CA) was used to measure the size distribution and particle concentration. Flow cytometry (1×10⁵ events) was performed immediately afterward using an Accuri C6 flow cytometer (Accuri Cytometers Inc.; Ann Arbor, MI). The forward-scatter height (FSC-H) threshold was adjusted to delineate the microbubble populations from instrument and sample noise. The system setting was held constant for all subsequent measurements.
2.4 Optimization of FITC ligand:functionalized lipid ratio
Based on the size distribution and concentration data obtained using the Accusizer, each microbubble sample was diluted to about 1×10⁹ #/mL. It is reported that the average projected area per lipid molecule for DSPC is 0.44 nm2.32 Keeping the same value for all other lipid species, the total number of lipid molecules on the shell surface was calculated. Assuming the uptake of lipid molecules to the shell was the same for all species, the relative molar ratio of lipid components in the microbubble shell will be the same as in the bulk suspension.33 The total number of functional groups present on the surface of microbubbles was then calculated, and the excess amount of FITC ligand (molar ratio varied from 0.04:1 to 100:1 and 0.05:1 to 1.5:1 for NHS-FITC:DSPE-PEG2000-A and SA-FITC:DSPE-PEG2000-B, respectively) needed for conjugation was obtained. Samples were incubated with the indicated amount of FITC ligand in the dark overnight on a benchtop rotator at room temperature. Unreacted NHS-FITC or SA-FITC was removed by centrifuging/washing the sample at 250G for 5 min. The concentrated microbubble cake was then re-suspended to 1×10⁹/mL in PBS and analyzed by flow cytometry.
2.5 FITC ligand binding kinetics
Microbubble suspensions were incubated with the indicated amount of FITC ligand in the dark on a benchtop rotator at room temperature. FITC ligand binding was continuously monitored for 6 hrs. 2 μL samples were taken out at different time points for flow cytometry measurement. A pseudo-first order association kinetics model, given by Equation 1, was used to fit all median fluorescence intensity versus time data,
| (1) |
where Ymax is maximum median fluorescence intensity (MFI) increase and kobs is the observed binding rate constant in units of hr. Curve fitting parameters for each data set were obtained using the nonlinear regression tool in Prism software (GraphPad Software, Inc; La Jolla, CA). All curves showed reasonable goodness of fit with R2 values approximately 0.92 and above, except for SA-FITC ELA 1–2 μm microbubble sample (discussed below).
2.6 Optical microscopy
Direct visual confirmation of microbubble fluorescence was performed within 24 hrs after FITC ligand binding. Microbubble samples were taken out of the reaction syringe and imaged at room temperature. Still images were taken using an Olympus 1X71 inverted microscope (Olympus; Center Valley, PA), and Z-scan images were taken using an Olympus BX60M upright microscope with 0.5-μm scan step size across 10-μm distance. Images were captured in epi-fluorescence mode using a high-resolution digital camera (Orca HR, Hamamatsu; Japan) with a 100x oil immersion objective and processed with Simple PCI software (C-Imaging; Cranberry Township, PA). Subsequent image analysis was done using ImageJ 1.4g software (NIH; Washington DC.).
3. Results and Discussion
3.1 Microbubble size isolation and flow cytometry gate determination
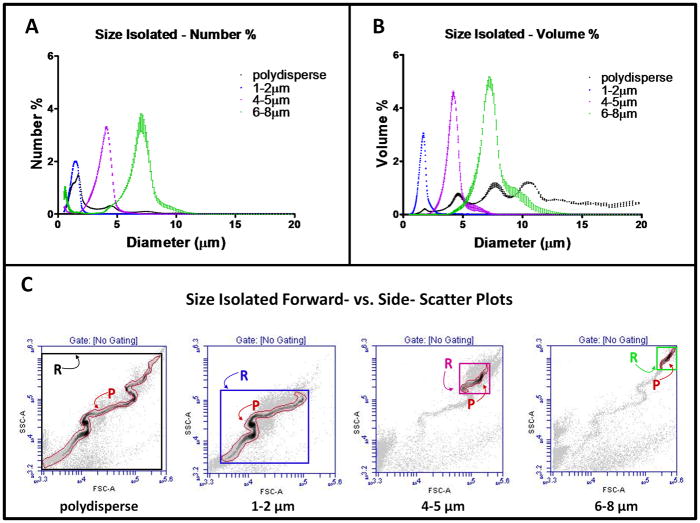
Our group recently introduced a microbubble size isolation technique using differential centrifugation.29 It provides a rapid and robust method for size selection and reduces polydispersity of microbubble samples. As we previously reported, it also isolated the microbubbles from precursor liposomes and non-echogenic nanobubbles, which may be recycled for additional microbubble production. Based on the size distribution, we estimated that only between 1 – 10% of the original lipid molecules were incorporated into the microbubble shells. Similar to our previous report,29 we observed a multimodal size distribution using both the Accusizer and the flow cytometer. The black symbols shown in Figure 2A and 2B are the number % and volume % of sizing data from a freshly made (polydisperse) sample. Distinct peaks in both plots were detected, especially in the volume % distribution, indicating dominant size ranges in the microbubble population. These distinct peaks were consistent across all microbubble samples. The corresponding forward- versus side-scatter (FSC vs. SSC) density plot for the polydisperse sample is shown in Figure 2C. A characteristic serpentine shape was detected as previously observed by our group.29 The serpentine scattergram appeared to correlate with the distinct peaks shown in the size distribution determined by Accusizer.
Figure 2.
Microbubble size isolation and flow cytometry gate determination. Number-weighted (A) and volume-weighted (B) microbubble size distributions before and after size isolation. Each curve is the average of three measurements with its SD plotted as error bars. (C) FSC vs. SSC plots of corresponding microbubble samples before and after size isolation. A tight fitted P gate and a rectangular R gate was drawn for each scatter plot and saved as templates for all subsequent measurement in order to identify each size subpopulation in a polydisperse suspension.
In order to further investigate microbubble size multimodality, we used a fluorescence-based detection method. DiI labeled microbubbles were centrifuged to remove the liposomes, nanobubbles and some of the 1–2 μm population so that the 1–2 μm and 4–5 μm peaks shown in the number % size distribution were of similar magnitude (Figure 3A). This step was necessary since 1–2 μm microbubbles present in a freshly made suspension dominated the events detected using flow cytometry. Microbubbles with different sizes could not be otherwise detected and represented on the fluorescence histogram. The FSC vs. SSC density plot and fluorescence histogram of the centrifuged sample is shown in Figure 3B and 3C. The fluorescence histogram clearly showed a multimodal distribution that corresponded to the Accusizer measurement, lending support to the validity of the multimodal size distribution rather than an optical scattering phenomenon.
Figure 3.
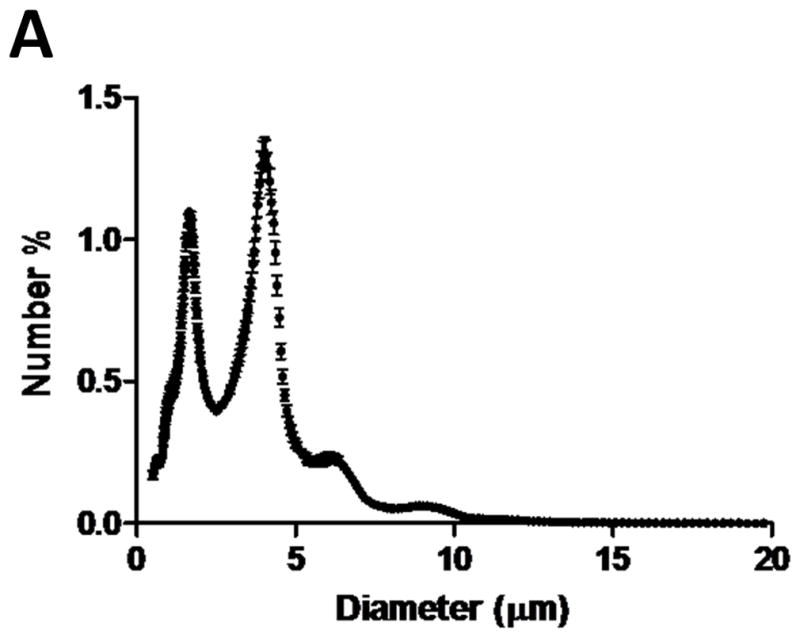
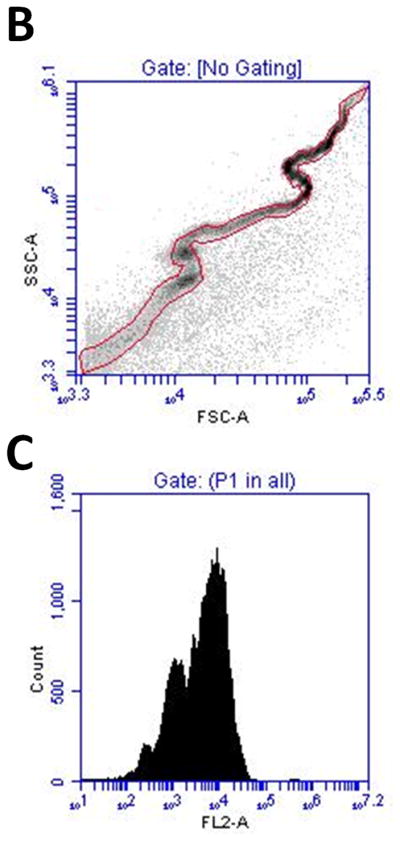
(A) Size distribution of the DiI labeled microbubble suspension after partially removing the 1–2 μm population. The 1–2 μm and 4–5 μm peaks shown in the number % size distribution were of similar magnitude to ensure proper event detection using flow cytometry. (B) FSC vs. SSC density plot of the same microbubble suspension. (C) MFI histogram of the same microbubble suspension, showing a multimodal distribution that corresponded to the Accusizer measurement.
Figure 2A and 2B also show the sizing data for the size-isolated microbubbles with diameter between 1–2 μm, 4–5 μm and 6–8 μm. The volume-weighted median diameters ± standard deviation (SD) were 1.71±0.01 μm, 4.07±0.12 μm and 7.13±0.12 μm, respectively. The corresponding FSC vs. SSC density plots for each population are shown in Figure 2C. A tight-fitted (P) gate and a rectangular (R) gate was drawn around the densest region of the scatter plots to identify each size subpopulation. The density plots for 4–5 μm and 6–8 μm size-isolated samples showed faint traces of the serpentine shape similar to the polydisperse sample, which might result from the presence of residual smaller microbubbles in the sample. By combining differential centrifugation and flow cytometric gating, we were able to accurately identify microbubble subpopulations in a polydisperse sample. The gate information determined using the size-isolated samples was saved as a template for all subsequent analyses of polydisperse microbubble suspensions. In order to ensure a proper representation of the entire microbubble population, 1E5 events were measured for all samples.
3.2 Optimization of FITC ligand:functionalized lipid ratio
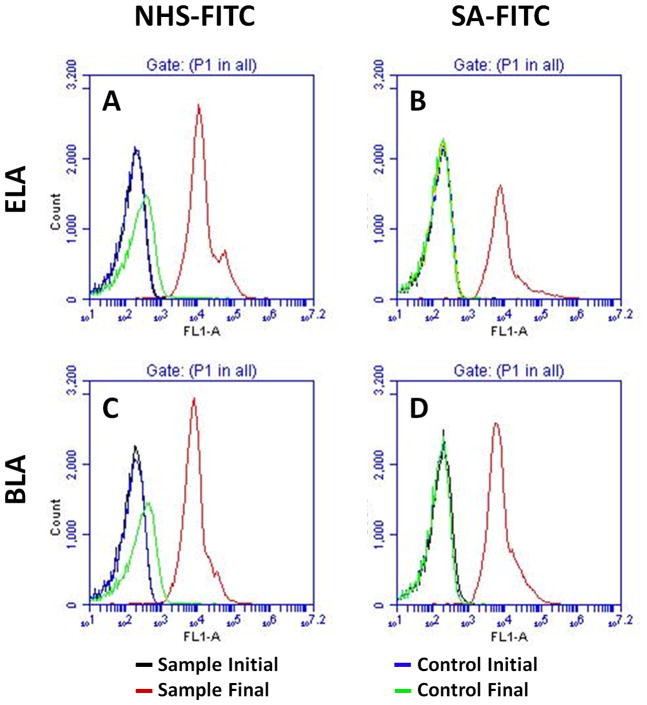
Flow cytometry was used to analyze the binding of the FITC ligands to the PEG-terminal functional groups. Figure 4 shows sample median fluorescence intensity (MFI) histograms before and after ligand conjugation. The washed polydisperse suspension, which had a dominant 1–2 μm peak and sometimes a relatively large 4–5 μm peak, gave a log-normal or sometimes bimodal distribution in fluorescence intensity (e.g., Figure 4A). Increased MFI, which was indicated by a shift of the distribution to the right, confirmed the binding of FITC ligand on the microbubble surface. Control microbubbles showed very little or no MFI increase for either NHS-FITC or SA-FITC, regardless of the microbubble surface architecture.
Figure 4.
Typical flow cytometry fluorescence intensity histogram of microbubbles with different architectures before and after ligand conjugation. (A) NHS-FITC ELA binding. (B) SA-FITC ELA binding. (C) NHS-FITC BLA binding. (D) SA-FITC BLA binding.
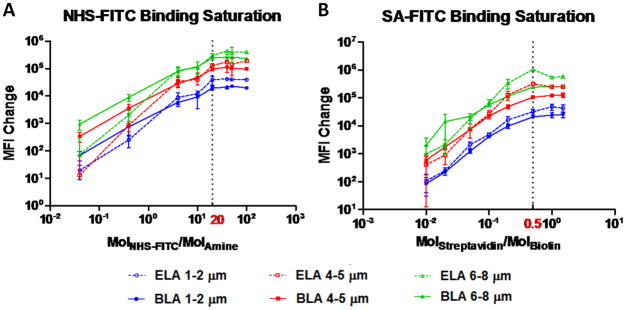
In order to perform a sensitive analysis of ligand conjugation kinetics, studies were done to find the saturation point for NHS-FITC and SA-FITC (Figure 5). For both ELA and BLA, MFI change increased by about three orders of magnitude when the NHS-FITC:DSPE-PEG2000-A molar ratio was increased from 0.04 to 20, and leveled off to 100 (Figure 5A). A similar trend was observed for SA-FITC:DSPE-PEG2000-B, although the saturation molar ratio occurred at 0.5 (Figure 5B). Both molar ratios were identified as the saturation point and used to calculate the appropriate amount of FITC ligand for all subsequent kinetics experiments.
Figure 5.
Optimization of ligand:functionalized lipid ratio. MFI was measured before and after microbubble samples reacted with various amounts of ligands after 12 hrs at room temperature. (A) NHS-FITC:DSPE-PEG2000-A with molar ratio varied between 0.04 and 100. 20 molar ratio (dash line) was used for all subsequent kinetics studies. (B) SA-FITC:DSPE-PEG2000-B with molar ratio varied between 0.01 and 1.5. 0.5 molar ratio (dash line) was used for all subsequent kinetics studies.
3.3 Small molecule (NHS-FITC) binding kinetics
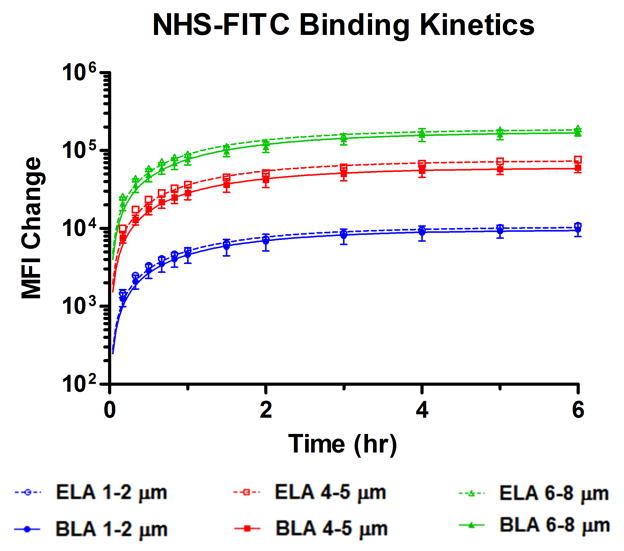
It is commonly accepted that the protective mechanism of PEG polymer chains for liposomes1 or microbubbles2 comes from their flexibility to form a “cloud” that sterically hinders the adsorption of opsonins to the surface, and hence reduces the rapid clearance of these colloidal particles by the reticuloendothelial system (RES).3 We sought to determine whether this mechanism interferes with the diffusion and attachment of targeting ligands to the buried PEG chains. We hypothesized that smaller molecules, such as NHS-FITC, would be able to diffuse freely through the excluded volume of PEG and bind to the tethered amino groups at the end of the shorter PEG chains for both microbubble surface architectures. Indeed, by monitoring MFI increase using flow cytometry, almost identical NHS-FITC binding kinetics for each size range were obtained between ELA and BLA over 6 hrs (Figure 6). Table 2 summarizes the best-fit values obtained for the pseudo-first order kinetics parameters. Ymax and kobs values for BLA microbubbles were more than 80% of those for ELA independent of microbubble size. This result confirmed our hypothesis that the diffusion and binding of NHS-FITC to the tethered amino groups was not significantly inhibited by the PEG overbrush.
Figure 6.
NHS-FITC binding kinetics to the tethered amino functional groups after microbubble formation. MFI was monitored continuously over 6 hrs, and MFI change before and after reaction for each size range was plotted at different time points. Data was fitted using a pseudo-first order reaction kinetics model. ELA and BLA showed good agreement for both the observed binding rate and the final MFI over the experimental time scale.
Table 2.
Summary of best-fit values obtained for NHS-FITC ligand binding kinetics curves using a pseudo-first order kinetics reaction (Equation 1).
| Sample Size Range | NHS-FITC Binding | |||
|---|---|---|---|---|
| ELA | BLA | |||
| Ymax (AFU*) | kobs (hr−1) | Ymax (AFU*) | kobs (hr−1) | |
| 1–2 μm | 1.1 ×10⁴ | 0.67 | 9.6 ×10³ | 0.65 |
| 4–5 μm | 7.5 ×10⁴ | 0.66 | 6.0 ×10⁴ | 0.64 |
| 7–8 μm | 1.9 ×10⁵ | 0.64 | 1.7 ×10⁵ | 0.58 |
Arbitrary fluorescence unit
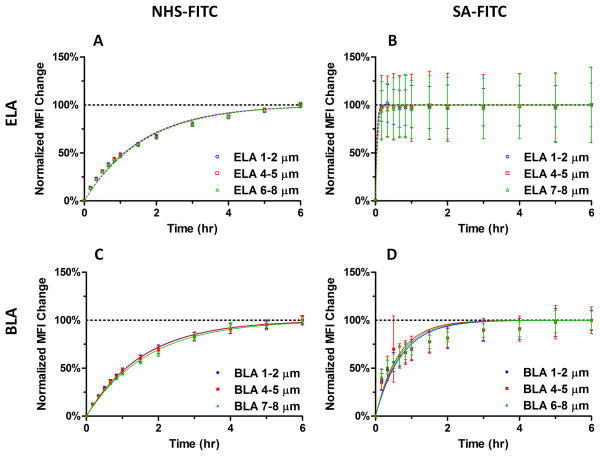
In order to further analyze the binding kinetics, MFI changes were normalized using the final MFI value taken at 6 hr (Figure 8A and 8C). Interestingly, binding curves for all three size ranges collapsed to a single curve over the 6-hr experiment. This indicated that NHS-FITC ligand binding occurred at the same rate, independent of microbubble size, in both ELA and BLA designs.
Figure 8.
Comparison of normalized MFI change between ELA and BLA for all size ranges. The last measured MFI was used for normalization as the saturation value. The curves were obtained using a pseudo-first order kinetics model. (A-D) Normalized MFI change of NHS-FITC (A, C) and SA-FITC (B, D) binding for ELA and BLA microbubbles. The fitted binding rate for all size ranges was the same for each condition, indicating that the ligand binding rate was independent of microbubble size.
NHS-FITC is similar in molecular weight to several small-molecule peptide ligands, such as cyclic-arginine-glycine-asparagine (RGD). RGD has been shown to bind to an overexpressed angiogenic biomarker, αvβ3 integrin, with high affinity and specificity.34, 35 Using RGD labeled microbubbles with ultrasound molecular imaging, one can monitor and guide therapy of vascular endothelial growth factor (VEGF)-blockage for cancer therapy.36, 37 By showing that NHS-FITC was able to diffuse through the PEG overbrush and bind to the tethered PEG, we demonstrated the feasibility of post-labeling for small-molecule ligands (<1 kDa) to BLA microbubbles to generate stealth targeted ultrasound contrast agents.
3.4 Macromolecule (SA-FITC) binding kinetics
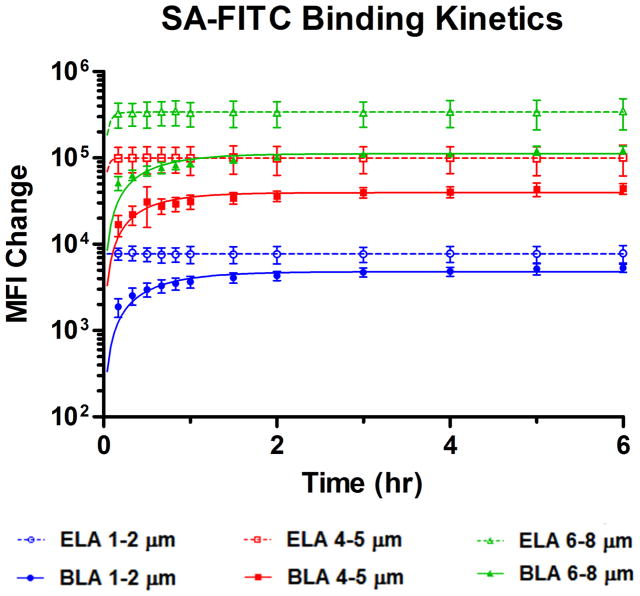
We hypothesized that macromolecules (>10 kDa), such as SA-FITC, would not be able to diffuse freely through the PEG overbrush and bind to tethered biotin end groups due to steric hindrance in the buried-ligand architecture. Indeed, Figure 7 shows significant differences in SA-FITC binding curves between ELA and BLA for each microbubble size range. ELA binding curves reached the saturation MFI values within the first 10 min of reaction and stayed constant throughout the rest of the experiment. BLA binding curves, on the other hand, showed a gradual increase during the first hour of reaction, reaching the saturation MFI values at approximately 2 hr. The final MFI values for each size range in ELA were significantly higher than those in BLA, with the average Ymax percentage being only 58% of that for ELA (Table 3, 1–2 μm), indicating that the binding of SA-FITC to buried biotin groups was significantly inhibited by the longer PEG chains.
Figure 7.
SA-FITC binding kinetics to the tethered biotin functional groups after microbubble formation. ELA reached saturation binding within the first 10 min of reaction. However, BLA showed gradual increase of MFI over the first 2 hrs of reaction with a half-time around 30 min for all size ranges. The difference in binding rate agrees with the hypothesis that the PEG overbrush interferes with the diffusion of large molecules to the surface of microbubbles and partially blocks their binding to the buried end groups.
Table 3.
Summary of best-fit values obtained for SA-FITC ligand binding kinetics curves using a pseudo-first order kinetics reaction (Equation 1).
| Sample Size Range | SA-FITC Binding | |||
|---|---|---|---|---|
| ELA | BLA | |||
| Ymax (AFU*) | kobs (hr−1) | Ymax (AFU*) | kobs (hr−1) | |
| 1–2 μm | 6.3 ×10³ | ~ | 4.8 ×10³ | 1.80 |
| 4–5 μm | 7.7 ×10⁴ | ~ | 4.0 ×10⁴ | 2.18 |
| 7–8 μm | 2.5 ×10⁵ | ~ | 1.1 ×10⁵ | 1.98 |
Arbitrary fluorescence unit
Again, we investigated the effect of microbubble size. Normalized MFI change showed all binding rates collapsed into a single curve, indicating that SA-FITC binding for microbubbles with different diameters was the same (Figure 8B and 8D). Similar to NHS-FITC, the diffusion and binding of SA-FITC was not affected by microbubble size for either BLA or ELA designs.
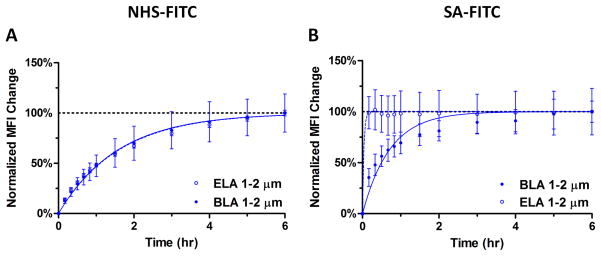
The kinetic curves for the 1–2 μm size range are shown in Figure 9 to further illustrate the significant difference in binding rate between ELA and BLA microbubbles for different ligand sizes. For NHS-FITC, the normalized binding curves showed very little difference between the two brush architectures over 6 hrs, with the fitted kobs values in close agreement between ELA and BLA (Table 4). On the other hand, for SA-FITC binding, the ELA kinetic curve closely resembles a step function with the MFI value reaching its saturation Ymax within 10 min; yet the BLA kinetic curve showed a more gradual increase over time with a much slower binding rate constant. Unfortunately, due to the fact that ELA samples reached their saturation MFI before the first flow cytometry measurement was taken, reliable kobs values were not obtained for a more quantitative comparison.
Figure 9.
Sample comparison between normalized MFI change for ELA and BLA 1–2 μm microbubbles. The binding rate for NHS-FITC between ELA and BLA was the same, confirming the hypothesis that the diffusion and attachment of small molecules to the tethered short PEG chains was not affected by the overbrush. On the other hand, the binding rate for SA-FITC between ELA and BLA was significantly different, particularly during the first 30 min of reaction, indicating that the binding of large SA-FITC molecules was slowed by the PEG overbrush in BLA.
Table 4.
Summary of best-fit values obtained for normalized FITC ligand binding kinetics curves. All MFI values were normalized by the corresponding best-fit Ymax values listed in Table 2 and 3.
| Sample Size Range | NHS-FITC Binding | SA-FITC Binding | ||
|---|---|---|---|---|
| ELA kobs(hr−1) | BLA kobs(hr−1) | ELA kobs(hr−1) | BLA kobs(hr−1) | |
| 1–2 μm | 0.63 | 0.64 | ~ | 1.40 |
| 4–5 μm | 0.62 | 0.63 | ~ | 1.58 |
| 7–8 μm | 0.61 | 0.59 | ~ | 1.48 |
3.5 Availability of tethered functional groups in a bimodal polymer brush
Interestingly, the PEG overbrush did not completely eliminate macromolecule conjugation. Previous findings have shown that phase separation between phospholipid species can exist on lipid monolayers coating the microbubble surface.33, 38–42 We suggest that two distributions of PEG-lipid conjugates may exist on the surface of microbubbles, which are formed during the initial self-assembly process: domains with DSPE-PEG2000-X and DSPE-PEG5000 well mixed, and peripheral regions comprising buried ligands that are not completely shielded by the PEG overbrush (Figure 11). Smaller ligands, such as NHS-FITC, may diffuse freely through the excluded volume of PEG and bind to the amino groups in the center of the PEG-rich domains. Needham et al.4, 18 modeled the diffusion of small molecules through a surface-grafted PEG layer as a function of polymer molecular weight. It was found that as the PEG molecular weight increased, the volume fraction of polymer in the excluded volume decreased, indicating that there was more free-water volume for small molecules to penetrate. Our results illustrated that the presence of the DSPE-PEG5000 overbrush does not interfere with the diffusion of NHS-FITC molecules to the tethered amino groups.
Figure 11.
Cartoon illustrating possible phase separation between lipid species on the surface of microbubbles.
On the other hand, the binding of SA-FITC to tethered biotin groups in BLA microbubbles was significantly lower (~ 58%) than that for ELA microbubbles. We propose that this is because the observed binding of SA-FITC mainly occurred to the tethered biotin groups on the peripheral DSPE-PEG2000-B chains, where the longer DSPE-PEG5000 chains did not form a complete dense cloud over the buried biotin groups. In the central PEG-rich domain regions, SA-FITC molecules could not overcome the steric hindrances of DSPE-PEG5000 chains, and therefore were physically prevented from binding to the biotin groups, which resulted in the differences in the final saturated MFI values between ELA and BLA microbubbles.
It is also possible that the transient excursion of PEG chains could result in some SA-FITC:DSPE-PEG2000-B binding in the central regions of the domains. If this were the case, SA-FITC would continue to bind, and we would observe a linear increase of MFI over time. However, the significantly lower MFI values of BLA microbubbles and the non-linear binding curves both indicated that such events occurred at a very low frequency over the experimental period, and it was the physical inhibition of SA-FITC molecules due to the steric repulsion that resulted the difference in final MFI values between BLA and ELA microbubbles.
Using a surface force apparatus, Moore et al.15 measured the specific and nonspecific forces between a streptavidin-coated surface and a bimodal PEG mushroom with buried biotin and a similar lipid composition as we present here. It was found that the presence of longer PEG did not significantly change the capture distance of specific adhesion even though the steric repulsion between these two surfaces was increased. The discrepancy between their results and ours can be explained by the differences in experimental design. Moore et al. had two surfaces slowly approach each other, allowing the tethered biotin end groups enough time to equilibrate and bind to apposed streptavidin molecules under compression.43 Our study is different in that microbubbles and ligand molecules diffused freely in solution. There were no external forces acting on the system. Therefore all measured binding events were the result of passive diffusion. The results presented here confirmed our previous findings in a similar system, where microbubbles were flowing through a parallel-plate flow chamber and allowed to bind to surface-adsorbed avidin molecules.7 It was shown that BLA microbubbles were able to successfully bury the targeting ligands and reduce specific adhesion in comparison with ELA microbubbles when no USRF was applied. In the current study, the presence of longer PEG showed a significant effect on the binding of SA-FITC, supporting our hypothesis that the diffusion of macromolecules through the PEG overbrush was inhibited.
3.4 Streptavidin-induced microbubble surface structure
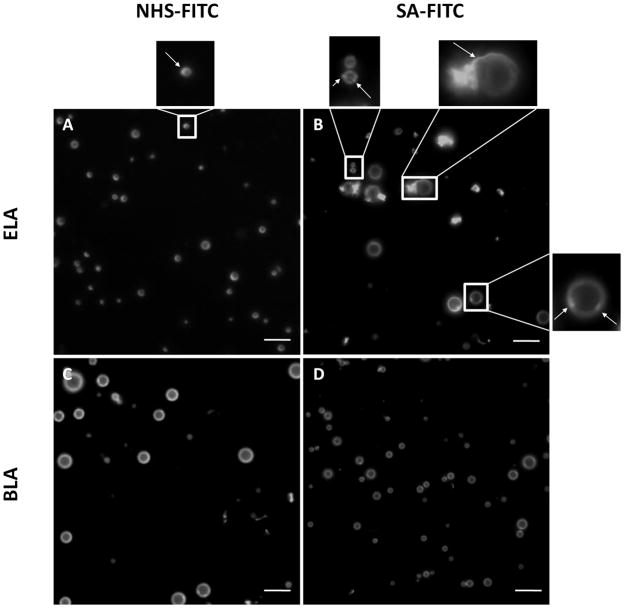
Epi-fluorescence microscopy images provided direct visual confirmation for the conjugation of FITC ligands to the surface of microbubbles (Figure 10). All microbubble samples appeared to be stable during observation. When compared with bright-field images, all polydisperse microbubbles were visible under epi-fluorescence mode (data not shown). There was no preferential attachment of ligands due to microbubble size. Microstructural features within the lipid shells were detected (see arrows in Figure 10A and 10B), indicating non-uniform distribution of FITC ligand on the microbubble surface.
Figure 10.
Epi-fluorescence images of microbubble samples after ligand binding. Arrows point to microstructural features of non-uniform FITC labeling. (A) NHS-FITC labeled ELA microbubbles. (B) NHS-FITC labeled BLA microbubbles. (C) SA-FITC labeled ELA microbubbles. (D) SA-FITC labeled BLA microbubbles. Scale bars correspond to 10 μm.
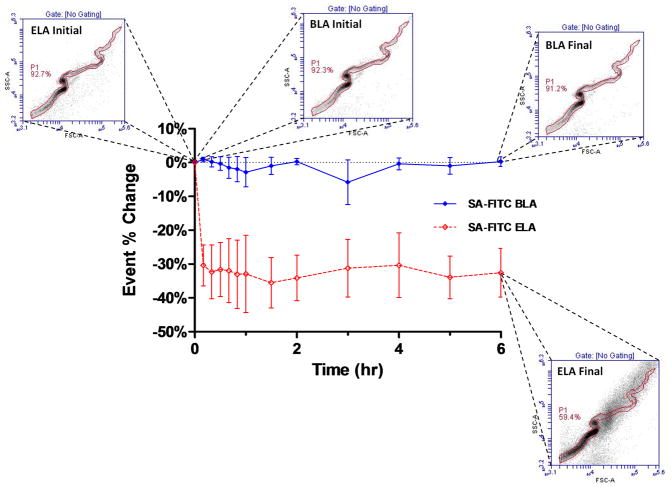
To our surprise, during the preliminary screening for ligand saturation, we noticed that the number of events (event%) that fell within the polydisperse P gate on the FSC vs. SSC plot stayed relatively constant for all microbubble samples except for SA-FITC:ELA binding (Figure 12). A significant decrease of event% inside the gate was repeatedly observed immediately after SA-FITC binding to ELA microbubbles, and the relative change stayed constant throughout the 6 hr experiment. This change of event percentage was not accompanied by a corresponding decrease in total particle concentration (data not shown). Since SSC is a measure of particle granularity and texture,44 it was then hypothesized that this change of scattering property resulted from a change of microbubble surface structure.
Figure 12.
Flow cytometric identification of surface structure induced by streptavidin binding. Shown is the change in the percentage of events that fell within the serpentine P gate and the accompanying FSC vs. SSC plots.
Epi-fluorescence images verified this hypothesis. Figure 10 (upper right) shows typical SA-FITC labeled ELA microbubbles exhibiting complex surface structure (e.g. folds, domains and protrusions) that were not normally found on either SA-FITC labeled BLA microbubbles or NHS-FITC labeled ELA microbubbles. Similar structures were found on almost all SA-FITC bound ELA microbubbles that were large enough (diameter > ~3 μm) to be examined by optical microscopy. No visible changes, such as collapse aggregates forming or vesicles shedding, were observed for these microbubbles over the observation time period (typically around 10–15 min).
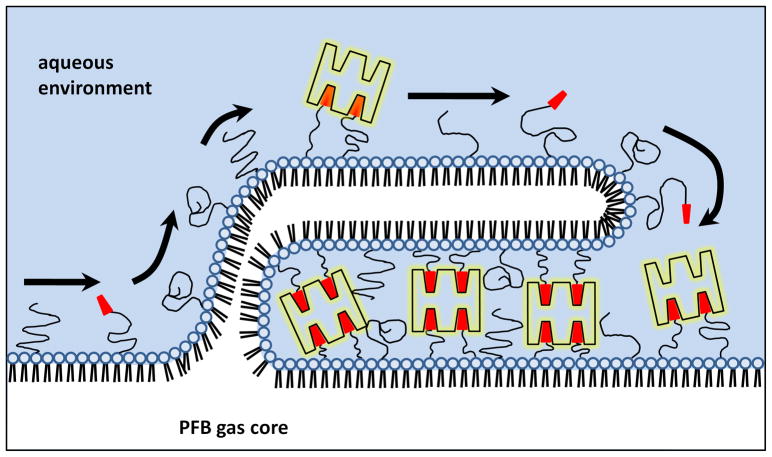
The streptavidin-induced surface structures (folds and protrusions) were not observed for either SA-FITC labeled BLA microbubbles or NHS-FITC labeled ELA microbubbles, and can be correlated to the flow cytometry measurement very closely (Figure 12). Figure 13 shows a cartoon concept of the streptavidin-induced surface structure. We speculate that incomplete surface coverage of biotin moieties by the SA-FITC lead to cross-linking between the monolayer shell and folds extending into the aqueous phase. (Small bilayer folds and protrusions are likely present as defects in the microbubble shell prior to SA-FITC binding.) We further speculate that cross-linking lead to an effective spreading pressure of the bilayer fold over the monolayer surface, which pulled more lipid from the monolayer plane and into the fold. As the spreading proceeded, a fold would grow until the SA-FITC molecules, which were the limiting reagent, were depleted, or SA-FITC molecules reached their maximum surface density. Fold nucleation and growth would likely be guided by shell heterogeneities and would induce gas dissolution from the core, consistent with results presented in Figures 10 and 12. This explanation was inspired by previous work by others showing adhesion between apposing lipid vesicles induced by avidin-biotin interactions.45–47 The biotin-avidin spreading pressure was able to bend and stretch the bilayer membranes to form large contact regions (e.g., plaques). Previous work done by Nam and Santore47 showed that the time scale for spreading in generally on the order of seconds. For our experiments, by the time the first data point was taken at 15 minutes, it is assumed that the growth and spreading of the folds and protrusions were completed, and the system reached a new equilibrium state.
Figure 13.
Cartoon illustrating possible streptavidin-induced monolayer protrusion.
In order to test the hypothesis that the formation of these surface structures was a streptavidin-biotin mediated phenomenon rather than a manifestation of gas core dissolution owing to dilution, we plotted the microbubble concentration change over the 6 hr experiment period for each size range using the flow cytometry data (Figure 14). For ELA microbubbles binding to SA-FITC, all size ranges showed a significant decrease in concentration within the first 10 min and stayed constant throughout the rest of the experiment. For BLA microbubbles, on the other hand, none of the size ranges showed a significant change of concentration. Since both samples were prepared and diluted in the same manner, this result allowed us to rule out the possibility that the observed surface structures resulted simply from microbubble dilution.
Figure 14.
Concentration change for ELA and BLA microbubbles upon SA-FITC binding during. Concentration data was obtained from flow cytometry data using the tight-fitted P gates.
The absence of the wrinkled structure observed for BLA microbubbles could be due to inhibited macromolecule diffusion into the bimodal PEG layer. The availability of the tethered biotin group in a bimodal PEG brush was much lower than for the ELA counterpart. If there were not enough biotin-avidin interactions within a close proximity, the system may not have been able to bend and stretch the monolayer enough to promote fold growth.
While Rychak et al.48 showed that they could use mechanical pressurization to create wrinkled microbubbles with increased surface area for loading targeting ligands and facilitating adhesion, we are here presenting another method for inducing complex surface structure formation that resulted in similar folds and protrusions. The excess area on SA-FITC labeled ELA microbubbles may also stabilize specific adhesion. However, these surface structures may increase immunogenicity. Regardless, we showed that these surface structures may be quantified using flow cytometry.
4. Conclusion
NHS-FITC and SA-FITC were used as model molecules to post-label exposed-ligand architecture (ELA) and buried-ligand architecture (BLA) microbubbles. We showed that for small molecules, such as NHS-FITC, the diffusion and binding to the tethered amino end groups were not affected by the PEG overbrush in BLA microbubbles, and the overall binding rate between ELA and BLA microbubbles were the same. On the other hand, for larger molecules, such as SA-FITC, the diffusion and binding to the tethered biotin end groups was partially prevented by the PEG overbrush due to steric hindrances for BLA microbubbles, and the binding rate was significantly reduced. The total binding capacity for BLA microbubbles was significantly lower for macromolecules in comparison to ELA microbubbles (~ 58%), suggesting a possible phase separation between lipid species on the surface. These results proved the hypothesis that small molecules could diffuse through the excluded volume of PEG chains and react with surface functional groups, while larger molecules were significantly inhibited. Post-labeling with BLA microbubbles is therefore highly feasible for small ligands (<1 kDa) for generating targeted ultrasound contrast agents. In addition, we investigated on the effect of microbubble size on ligand conjugation. We showed that ligand conjugation was not affected by microbubble diameter regardless of the ligand size or microbubble surface architecture. We also discovered a new way of introducing complex surface structures, or wrinkles, through streptavidin conjugation to ELA microbubbles. We propose that the tight serpentine shape P gate and the event% parameter can be used together with epi-fluorescence microscopy to detect these surface structures. Flow cytometry can give a quick quantitative indication of the percent of microbubbles in a given suspension that deviate from the normal spherical shape, while microscopy offers direct visual confirmation of the surface structure.
Acknowledgments
We thank Dr. Shashank Sirsi for insightful suggestions and Melissa Moy for help with microbubble generation. This research was supported by NIH ROI EB 009066.
References
- 1.Klibanov AL, Maruyama K, Torchilin VP, Huang L. Amphipathic Polyethyleneglycols Effectively Prolong the Circulation Time of Liposomes. Febs Letters. 1990;268(1):235–237. doi: 10.1016/0014-5793(90)81016-h. [DOI] [PubMed] [Google Scholar]
- 2.Klibanov AL. Targeted delivery of gas-filled microspheres, contrast agents for ultrasound imaging. Adv Drug Deliv Rev. 1999;37(1–3):139–157. doi: 10.1016/s0169-409x(98)00104-5. [DOI] [PubMed] [Google Scholar]
- 3.Torchilin VP, Papisov MI, Bogdanov AA, Trubetskoy VS, Omelyanenko VG. Molecular Mechanism of Liposome and Immunoliposome Steric Protection with Poly(ethylene glycol): Theroretical and Experimental Proofs of the Role of Polymer Chain Flexibility. In: Lasic D, Martin F, editors. Stealth Liposomes. CRC Press, Inc; Boca Raton: 1995. p. 51. [Google Scholar]
- 4.Needham D, Zhelev DV, McIntosh TJ. Surface Chemistry of the Sterically Stabilized PEG-Liposome. In: AJ, editor. Liposomes: Rational design. New York: 1999. p. 13. [Google Scholar]
- 5.Kuhl TL, Leckband DE, Lasic DD, Israelachvili JN. Modulation and modeling of interaction forces between lipid bilayers exposing terminally grafted polymer chains. In: Lasic D, Martin F, editors. Stealth Liposomes. CRC Press; Boca Raton: 1995. p. 73. [Google Scholar]
- 6.Borden MA, Zhang H, Gillies RJ, Dayton PA, Ferrara KW. A stimulus-responsive contrast agent for ultrasound molecular imaging. Biomaterials. 2008;29(5):597–606. doi: 10.1016/j.biomaterials.2007.10.011. [DOI] [PMC free article] [PubMed] [Google Scholar]
- 7.Borden MA, Sarantos MR, Stieger SM, Simon SI, Ferrara KW, Dayton PA. Ultrasound radiation force modulates ligand availability on targeted contrast agents. B C Decker Inc; 2006. pp. 139–147. 2006. [PMC free article] [PubMed] [Google Scholar]
- 8.Birshtein TM, Liatskaya YV, Zhulina EB. Theory of supermolecular structures of polydisperse block copolymers: 1. Planar layers of grafted chains. Polymer. 1990;31(11):2185–2196. [Google Scholar]
- 9.Lai PY, Zhulina EB. Structure of a bidisperse polymer brush: Monte Carlo simulation and self-consistent field results. Macromolecules. 1992;25(20):5201–5207. [Google Scholar]
- 10.Birshtein TM, Liatskaya YV, Zhulina EB. Theory of supermolecular structures of polydisperse block copolymers.1. Planar layers of grafted chains. Polymer. 1990;31(11):2185–2196. [Google Scholar]
- 11.Dan N, Tirrell M. Effect of bimodal molecular-weight distribution on the polymer brush. Macromolecules. 1993;26(24):6467–6473. [Google Scholar]
- 12.Longo GS, Thompson DH, Szleifer I. Ligand-receptor interactions between surfaces: The role of binary polymer spacers. Langmuir. 2008;24(18):10324–10333. doi: 10.1021/la8009699. [DOI] [PMC free article] [PubMed] [Google Scholar]
- 13.Chen CC, Dormidontova EE. Architectural and structural optimization of the protective polymer layer for enhanced targeting. Langmuir. 2005;21(12):5605–5615. doi: 10.1021/la047109v. [DOI] [PubMed] [Google Scholar]
- 14.Goedel WA, Luap C, Oeser R, Lang P, Braun C, Steitz R. Stratification in monolayers of a bidisperse melt polymer brush as revealed by neutron reflectivity. Macromolecules. 1999;32(22):7599–7609. [Google Scholar]
- 15.Moore NW, Kuhl TL. Bimodal polymer mushrooms: Compressive forces and specificity toward receptor surfaces. Langmuir. 2006;22(20):8485–8491. doi: 10.1021/la0608462. [DOI] [PubMed] [Google Scholar]
- 16.Levicky R, Koneripalli N, Tirrell M, Satija SK. Stratification in bidisperse polymer brushes from neutron reflectivity. Macromolecules. 1998;31(8):2616–2621. [Google Scholar]
- 17.Dhoot S, Watanabe H, Tirrell M. Measurement of forces in interactions between bimodal layers of diblock copolymers adsorbed on mica. Colloid Surf A-Physicochem Eng Asp. 1994;86:47–60. [Google Scholar]
- 18.Kim DH, Klibanov AL, Needham D. The influence of tiered layers of surface-grafted poly(ethylene glycol) on receptor-ligand-mediated adhesion between phospholipid monolayer-stabilized microbubbles and coated class beads. Langmuir. 2000;16(6):2808–2817. [Google Scholar]
- 19.Kuhlman W, Taniguchi I, Griffith LG, Mayes AM. Interplay between PEO tether length and ligand spacing governs cell spreading on RGD-modified PMMA-g-PEO comb copolymers. Biomacromolecules. 2007;8(10):3206–3213. doi: 10.1021/bm070237o. [DOI] [PubMed] [Google Scholar]
- 20.Schutt EG, Klein DH, Mattrey RM, Riess JG. Injectable microbubbles as contrast agents for diagnostic ultrasound imaging: the key role of perfluorochemicals. Angew Chem Int Ed Engl. 2003;42(28):3218–35. doi: 10.1002/anie.200200550. [DOI] [PubMed] [Google Scholar]
- 21.Quaia E. Microbubble ultrasound contrast agents: an update. Eur Radiol. 2007;17(8):1995–2008. doi: 10.1007/s00330-007-0623-0. [DOI] [PubMed] [Google Scholar]
- 22.Ferrara K, Pollard R, Borden M. Ultrasound microbubble contrast agents: Fundamentals and application to gene and drug delivery. Annual Review of Biomedical Engineering. 2007;9:415–447. doi: 10.1146/annurev.bioeng.8.061505.095852. [DOI] [PubMed] [Google Scholar]
- 23.Stride E, Saffari N. Microbubble ultrasound contrast agents: a review. Proc Inst Mech Eng H. 2003;217(6):429–47. doi: 10.1243/09544110360729072. [DOI] [PubMed] [Google Scholar]
- 24.Dijkmans PA, Juffermans LJ, Musters RJ, van Wamel A, ten Cate FJ, van Gilst W, Visser CA, de Jong N, Kamp O. Microbubbles and ultrasound: from diagnosis to therapy. Eur J Echocardiogr. 2004;5(4):245–56. doi: 10.1016/j.euje.2004.02.001. [DOI] [PubMed] [Google Scholar]
- 25.Lindner JR. Microbubbles in medical imaging: current applications and future directions. Nat Rev Drug Discov. 2004;3(6):527–32. doi: 10.1038/nrd1417. [DOI] [PubMed] [Google Scholar]
- 26.Sirsi S, Borden M. Microbubble compositions, properties and biomedical applications. Bubble Science, Engineering & Technology. 2009;1(1–2):3–17. doi: 10.1179/175889709X446507. [DOI] [PMC free article] [PubMed] [Google Scholar]
- 27.Lanza GM, Wickline SA. Targeted ultrasonic contrast agents for molecular imaging and therapy. Prog Cardiovasc Dis. 2001;44(1):13–31. doi: 10.1053/pcad.2001.26440. [DOI] [PubMed] [Google Scholar]
- 28.Klibanov AL. Ligand-carrying gas-filled microbubbles: Ultrasound contrast agents for targeted molecular imaging. Bioconjugate Chem. 2005;16(1):9–17. doi: 10.1021/bc049898y. [DOI] [PubMed] [Google Scholar]
- 29.Feshitan JA, Chen CC, Kwan JJ, Borden MA. Microbubble size isolation by differential centrifugation. J Colloid Interface Sci. 2009;329(2):316–24. doi: 10.1016/j.jcis.2008.09.066. [DOI] [PubMed] [Google Scholar]
- 30.Jeppesen C, Wong JY, Kuhl TL, Israelachvili JN, Mullah N, Zalipsky S, Marques CM. Impact of polymer tether length on multiple ligand-receptor bond formation. Science. 2001;293(5529):465–468. doi: 10.1126/science.293.5529.465. [DOI] [PubMed] [Google Scholar]
- 31.Kim SH, Franses EI. New protocols for preparing dipalmitoylphosphatidylcholine dispersions and controlling surface tension and competitive adsorption with albumin at the air/aqueous interface. Colloid Surf B-Biointerfaces. 2005;43(3–4):256–266. doi: 10.1016/j.colsurfb.2005.05.006. [DOI] [PubMed] [Google Scholar]
- 32.Hollinshead CM, Harvey RD, Barlow DJ, Webster JR, Hughes AV, Weston A, Lawrence MJ. Effects of Surface Pressure on the Structure of Distearoylphosphatidylcholine Monolayers Formed at the Air/Water Interface (dagger) Langmuir. 2009 doi: 10.1021/la8028319. [DOI] [PubMed] [Google Scholar]
- 33.Borden MA, Martinez GV, Ricker J, Tsvetkova N, Longo M, Gillies RJ, Dayton PA, Ferrara KW. Lateral phase separation in lipid-coated microbubbles. Langmuir. 2006;22(9):4291–4297. doi: 10.1021/la052841v. [DOI] [PubMed] [Google Scholar]
- 34.D’Andrea LD, Del Gatto A, Pedone C, Benedetti E. Peptide-based molecules in angiogenesis. Chem Biol Drug Des. 2006;67(2):115–126. doi: 10.1111/j.1747-0285.2006.00356.x. [DOI] [PubMed] [Google Scholar]
- 35.Miller JC, Pien HH, Sahani D, Sorensen AG, Thrall JH. Imaging angiogenesis: applications and potential for drug development. J Natl Cancer Inst. 2005;97(3):172–87. doi: 10.1093/jnci/dji023. [DOI] [PubMed] [Google Scholar]
- 36.Hargreaves RJ. The role of molecular imaging in drug discovery and development. Clin Pharmacol Ther. 2008;83(2):349–53. doi: 10.1038/sj.clpt.6100467. [DOI] [PubMed] [Google Scholar]
- 37.Iagaru A, Chen X, Gambhir SS. Molecular imaging can accelerate anti-angiogenic drug development and testing. Nat Clin Pract Oncol. 2007;4(10):556–7. doi: 10.1038/ncponc0929. [DOI] [PubMed] [Google Scholar]
- 38.Borden MA, Pu G, Runner GJ, Longo ML. Surface phase behavior and microstructure of lipid/PEG-emulsifier monolayer-coated microbubbles. Colloid Surf B-Biointerfaces. 2004;35(3–4):209–223. doi: 10.1016/j.colsurfb.2004.03.007. [DOI] [PubMed] [Google Scholar]
- 39.Lozano MM, Longo ML. Microbubbles Coated with Disaturated Lipids and DSPE-PEG2000: Phase Behavior, Collapse Transitions, and Permeability. Langmuir. 2009 doi: 10.1021/la803774q. [DOI] [PubMed] [Google Scholar]
- 40.Lozano MM, Longo ML. Complex formation and other phase transformations mapped in saturated phosphatidylcholine/DSPE-PEG2000 monolayers. Soft Matter. 2009;5(9):1822–1834. [Google Scholar]
- 41.Tanwir K, Tsoukanova V. Lateral distribution of a poly(ethylene glycol)-grafted phospholipid in phosphocholine monolayers studied by epifluorescence microscopy. Langmuir. 2008;24(24):14078–87. doi: 10.1021/la802205y. [DOI] [PubMed] [Google Scholar]
- 42.Kim DH, Costello MJ, Duncan PB, Needham D. Mechanical properties and microstructure of polycrystalline phospholipid monolayer shells: Novel solid microparticles. Langmuir. 2003;19(20):8455–8466. [Google Scholar]
- 43.Moore NW, Mulder DJ, Kuhl TL. Adhesion from tethered ligand-receptor bonds with microsecond lifetimes. Langmuir. 2008;24(4):1212–1218. doi: 10.1021/la702202x. [DOI] [PubMed] [Google Scholar]
- 44.Traganos F. FLOW-CYTOMETRY -PRINCIPLES AND APPLICATIONS .1. Cancer Investigation. 1984;2(2):149–163. doi: 10.3109/07357908409020296. [DOI] [PubMed] [Google Scholar]
- 45.Noppl DA, Needham D. Avidin-biotin interactions at vesicle surfaces: Adsorption and binding, cross bridge formation, and lateral interactions. Biophys J. 1996;70(2):SU359–SU359. doi: 10.1016/S0006-3495(96)79697-2. [DOI] [PMC free article] [PubMed] [Google Scholar]
- 46.Nam J, Santore MM. Adhesion plaque formation dynamics between polymer vesicles in the limit of highly concentrated binding sites. Langmuir. 2007;23(13):7216–7224. doi: 10.1021/la700542t. [DOI] [PubMed] [Google Scholar]
- 47.Nam J, Santore MM. The adhesion kinetics of sticky vesicles in tension: The distinction between spreading and receptor binding. Langmuir. 2007;23(21):10650–10660. doi: 10.1021/la7017709. [DOI] [PubMed] [Google Scholar]
- 48.Rychak JJ, Lindner JR, Ley K, Klibanov AL. Deformable gas-filled microbubbles targeted to P-selectin. J Control Release. 2006;114(3):288–299. doi: 10.1016/j.jconrel.2006.06.008. [DOI] [PubMed] [Google Scholar]
- 49.Bird RB, Stewart WE, Lightfoot EN. Transport Phenomena. 2. John Wiley & Sons, Inc; New York: 2002. p. 895. [Google Scholar]
- 50.Rani SA, Pitts B, Stewart PS. Rapid diffusion of fluorescent tracers into Staphylococcus epidermidis biofilms visualized by time lapse microscopy. Antimicrob Agents Chemother. 2005;49(2):728–732. doi: 10.1128/AAC.49.2.728-732.2005. [DOI] [PMC free article] [PubMed] [Google Scholar]
- 51.Cooper JM, Shen J, Young FM, Connolly P, Barker JR, Moores G. The imaging of streptavidin and avidin using scanning-tunneling-microscopy. J Mater Sci-Mater Electron. 1994;5(2):106–110. [Google Scholar]


