

Abstract
Chlorella viruses (or chloroviruses) are very large, plaque-forming viruses. The viruses are multilayered structures containing a large double-stranded DNA genome, a lipid bilayered membrane, and an outer icosahedral capsid shell. The viruses replicate in certain isolates of the coccal green alga, Chlorella. Sequence analysis of the 330-kbp genome of Paramecium bursaria Chlorella virus 1 (PBCV-1), the prototype of the virus family Phycodnaviridae, reveals <365 protein-encoding genes and 11 tRNA genes. Products of about 40% of these genes resemble proteins of known function, including many that are unexpected for a virus. Among these is a virus-encoded protein, called Kcv, which forms a functional K+ channel. This chapter focuses on the initial steps in virus infection and provides a plausible role for the function of the viral K+ channel in lowering the turgor pressure of the host. This step appears to be a prerequisite for delivery of the viral genome into the host.
1 Introduction
Chlorella viruses belong to the family Phycodnaviridae, genus Chlorovirus. They are large (190 nm in diameter), icosahedral, plaque-forming viruses with linear dsDNA genomes (Van Etten 2003; Yamada et al. 2006; Wilson et al. 2009). The type member of the genus is Paramecium bursaria Chlorella virus (PBCV-1); it has a genome of 331 kb that contains at least 365 protein-encoding genes and a polycistronic gene that encodes 11 tRNAs. Approximately 40% of its predicted gene products resemble proteins of known function, many of which are unexpected for a virus. The PBCV-1 virion has a glycoprotein shell that surrounds a lipid bilayered membrane.
Chlorella viruses infect certain freshwater, unicellular, eukaryotic Chlorella-like green algae, which normally exist as endosymbionts in protists. However, they are grown in the laboratory as axenic cultures. The addition of PBCV-1 to its host, Chlorella NC64A, leads to the following program of events: (1) virus attachment to the cell wall is host-specific and probably occurs at a unique virus vertex (Onimatsu et al. 2006; Cherrier et al. manuscript submitted for publication), followed by wall degradation at the point of attachment (Meints et al. 1984); (2) rapid host membrane depolarization (Frohns et al. 2006), potassium ion release (Neupärtl et al. 2007) and altered secondary active transport of solutes (Agarkova et al. 2008); (3) host nuclear DNA degradation beginning at 3–5 min postinfection (p.i.) (Agarkova et al. 2006); (4) early viral transcripts beginning to appear within 5–10 min p.i. (Schuster et al. 1986; Kawasaki et al. 2004); (5) virus DNA replication beginning at 60–90 min p.i. (Van Etten et al. 1984); (6) late virus transcription beginning at 60–90 min p.i. (Schuster et al. 1986), and (7) viral-induced lysis and particle release occurring at 6–8 h p.i. (Van Etten et al. 1983; Meints et al. 1984).
Many aspects of the Chlorella virus/host system have been extensively covered in several recent reviews (Van Etten 2003; Yamada et al. 2006; Dunigan et al. 2006;Wilson et al. 2009). This chapter focuses on the initial events of infection. It is motivated by the finding that Chlorella viruses code for K+ channel proteins and we present a hypothesis on how the activity of these channels is relevant to the entry of the virus DNA into the host cell.
2 Infection
Virus PBCV-1 infection of Chlorella NC64A cells is an excellent example of how a virus is able to rapidly take over the control of its host cell. The first step in PBCV-1 infection is attachment to the host cell wall (Meints et al. 1984). Presumably, a virion protein(s) interacts specifically and strongly with some component(s) in the host cell wall. This specificity determines the narrow host range of the Chlorella viruses and the strength assures that attachment withstands subsequent dissociation by environmental stresses.
The attachment process is rapid. Analysis of electron-microscopic images of Chlorella NC64A cells fixed at various times after mixing the host cells with the virus indicate that attachment is complete with a half time (t1/2) of ca. 1 min (Figure 1). This value describes the attachment of a population of particles, although individual virions may only require a few seconds.
Figure 1.
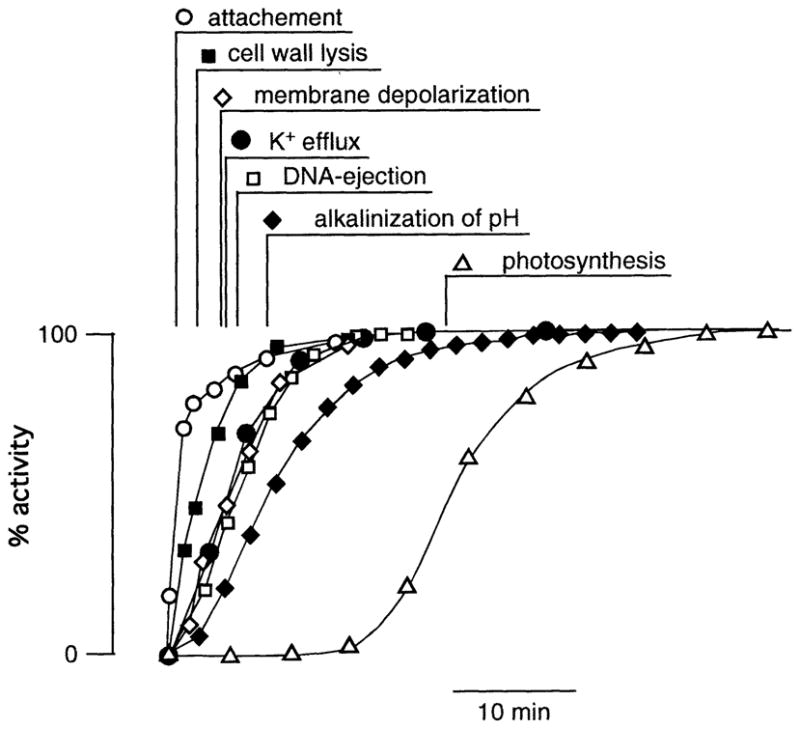
Mean time course of distinct early events during infection of Chlorella NC64A cells by virus PBCV-1. The half times (t1/2) of attachment, cell wall lysis membrane depolarization, K+ efflux, DNA ejection, cytosolic alkalinization and inhibition of photosynthesis are indicated. Data from: depolarization, Frohns et al. 2006; attachment/cell wall lysis/K+ efflux/DNA ejection: Neupärtl et al. 2007, alkalinization, Agarkova et al. 2008; photosynthesis, Seaton et al. 1995
Virus attachment to the host cell wall is not random; attachment always occurs at a virus vertex (Meints et al. 1984). Recent experimental results indicate that not all 12 virus vertices are identical and that attachment probably occurs at a unique tail-containing vertex (Onimatsu et al. 2006; Cherrier et al. manuscript submitted for publication). The PBCV-1 protein A140/145R is preferentially localized at this unique vertex and is essential for binding to the host cell wall. The positioning of the virus to this unique vertex could be brought about by external fibers on the virion (Van Etten et al. 1991; Cherrier et al. manuscript submitted for publication).
The idea of a polarized and function-specific vertex is consistent with prevailing models on the organization of other tail-containing, icosahedral bacterial viruses (phage) that enter the cell and leave the capsid at the surface. These phages, which have the same geometric capsid architecture as PBCV-1, have a portal protein complex attached to a tail at one vertex; typically, this vertex provides the pathway for both genome encapsidation and genome delivery (Cerritelli et al. 2003; Lebedev et al. 2007). However, the huge amoeba-infecting Mimi virus, which has a similar icosahedral morphology, including an internal membrane, and shares a common evolutionary ancestor with the Chlorella viruses, has two portals, one for DNA packaging and another for DNA ejection (Zauberman et al. 2008).
Thus, PBCV-1 infects Chlorella NC64A cells in a bacteriophage like manner, meaning that it ejects its genome and certain proteins into the host cell leaving an empty capsid attached to the host (Meints et al. 1984). From a mechanistic point of view, this is a challenging process, because the viral genome has to pass several barriers namely: (1) the viral membrane, (2) the capsid, (3) the cell wall of the host and (4) the plasma membrane of the host.
This entire process occurs in a way that the integrity of the host plasma membrane, i.e., the barrier for unspecific ion fluxes, is not compromised.
After attachment, the next step in the process is localized digestion of the host cell wall (Meints et al. 1984; Neupärtl et al. 2007). The virion particles include one or more enzymes that are secreted after attachment to degrade the host cell wall (Yamada et al. 2006). These hydrolytic enzymes rapidly digest a hole into the cell wall, with a t1/2 of ca. 2.5 min (Figure 1). The first holes in the host cell wall are observed after 1 min p.i.
3 Transfer of DNA from the Virus Particle into the Host Cell
After attachment and digestion of the host cell wall, the virus ejects its DNA, and also probably several proteins, into the host (Figure 1). Neither the energetics for the injection of viral DNA into the host nor the pathway for the transfer of virus DNA/proteins into the host cells is completely understood. The virus particle has a glycoprotein capsid surrounding an internal membrane; the DNA genome and probably several proteins are contained inside this membrane. Proteomic analyses of PBCV-1 particles indicate that the virion contains more than 100 different, viral encoded proteins (Dunigan et al. manuscript in preparation), only a few of which probably serve a structural role. An important question is: how does the virus transfer its DNA and some proteins across its own membrane and across the membrane of the host? Experimental evidence indicates that this transfer occurs without compromising the integrity of the host plasma membrane; measurements of the cytoplasmic pH (Agarkova et al. 2008) and photosynthetic activity (Van Etten et al. 1983; Seaton et al. 1995) of the host cells indicate that virus infection results in alkalinization of the host cytoplasm (t1/2 == 8 min) and a decrease in photosynthesis (t1/2 = 24 min) after a short lag time (Figure 1). The external medium of the Chlorella cells is slightly acidic, pH ~5.5. If DNA transfer, which occurs with a t1/2 of less than 6 min. p.i. (Figure 1), were corrupting the integrity of the host cell plasma membrane, acidification of the cytoplasm should occur in the same time frame.
The experimental results indicate that DNA ejection is an interplay between virus and host. The images shown by Meints et al. (1984) indicate that PBCV-1 attaches to and digests isolated cell walls of the host; however, DNA is not released (Meints et al. 1984). Hence, the virus requires a signal from the host to eject DNA. What is the nature of this signal? The answer to this question is unknown. However, we can make some educated guesses based on simple knowledge of plant physiology. The host cell Chlorella NC64A is a freshwater alga. Freshwater algal cells have a high turgor pressure that is roughly in the order of 1 MPa (Kim et al. 2006). Chlorella NC64A cells have an intracellular K+ concentration of about 100 mM (Neupärtl et al. 2007), which resembles other freshwater algae; thus, Chlorella NC64A has the same high turgor pressure as other freshwater algae.
The formation of a hole in the host cell wall, such as those produced by PBCV-1, is equivalent to a hole in the outer tube of a bicycle tire. If the hole is sufficiently large and the inner pressure is high enough, the inner tube will bulge. Whether the host plasma membrane bulges out of a hole in the cell wall is determined by the turgor pressure pushing it, the geometry of the hole (i.e., the area over which the pressure is exerted), and the tensile forces in the membrane. As an approximation, this relationship is given by (1)
| (1) |
This equation describes the movement of a liquid in a capillary; α is the contact angle (given in degree) of the membrane bulge with the cell wall, r the radius of the hole, σ the membrane tension, and P the turgor pressure of the cell. To calculate the contact angle1 and, thus, the geometry of the bulge, we measured the mean diameter of the cell wall hole produced by the virus in 65 electron micrographs, e.g., (Figures 2 and 3). A mean radius of 53 ± 4 nm was obtained. The tension of cellular plasma membranes is generally low. Careful estimates of this parameter in neuron cells produced values of 0.03–0.04 mN m−1 (Dai et al. 1998). Since the biophysical properties of membranes from animals and plants are similar (Morris and Homann 2001), we used this value in the following calculations. Figure 2a shows a plot of the estimated contact angle as a function of the radius of the virus generated hole in the cell wall. The data were calculated by assuming a membrane tension of 0.03 mN m−1 and a turgor pressure of 1 MPa. The latter value is a good estimate of the turgor pressure in freshwater algae. The plot in Figure 2a, which is only a crude estimate of reality, nonetheless indicates that the size of the hole generated by the virus is sufficient to generate near maximal bulging of the membrane. If we superimpose the geometry of such a bulge on an electron micrograph (Figure 2b), the membrane is pushed towards the viral particle.
Figure 2.


The production of a hole in the host cell wall results in host membrane bulging, (a) Calculated contact angle of budding membrane as a function of radius of the hole in the cell wall. (b) Cartoon of host cell membrane (dashed line) budding through the cell wall hole towards the virus particle with a contact angle α of 0°
Figure 3.

The host cell membrane is intimately connected with the virus particle. An image of PBCV- 1 infecting Chlorella NC64A. The virus (c) has digested a hole into the host cell wall (cw). At the site of infection the plasma membrane (pm) has retracted from the cell wall, probably due to an artifact of the fixation. However, where virus/cell contact occurs the plasma membrane of the host is intimately connected with the virus particle (arrow)
The bulging of the host cell membrane alone is insufficient to explain fusion of host and viral membranes. Notably, the viral membrane is inside the capsid. However, analysis of the PBCV-1 capsid structure by atomic force microscopy indicates that a central protein in the virion vertex is pushed open by applying external mechanical force (Kuznetsov et al. 2005). In the context of our model, it is reasonable to assume that the host cell membrane pushes this “valve like structure” open. However, the virion would have to undergo an additional structural change to increase the size of the virus hole before the host cell membrane could enter the interior of the virion. It remains to be seen how this interpretation fits together with new structural information on PBCV-1 that indicates the virion has a thin 250 Å long and 50 Å wide tail at one vertex (Cherrier et al. submitted for publication).
Membranes have to be brought into close physical contact to fuse. This is generally achieved in cells by SNARE proteins (Jahn and Scheller 2006) or specific fusion proteins in viruses (Harrison 2008). The Influenza A virus for example contains a specific protein, hemagglutinin, which forces the viral membrane close to the host membrane of the endosomes leading to membrane fusion (Chernomordik et al. 1999). In the PBCV-1/Chlorella system, viral and host membrane fusion might not require a specific protein(s). The high turgor pressure in plants might force the host membrane towards the viral membrane, leading to fusion. This hypothesis is plausible because it is well known that physical pressure and membrane tension can catalyze membrane fusion (Shillcock and Lipowsky 2008; Thiel et al. 2000).
Currently, this description of virus/host membrane fusion is hypothetical, but nonetheless, consistent with some experimental observations: (1) the hypothesis predicts that reduction in host turgor pressure should inhibit PBCV-1 infection. When Chlorella NC64A cells are pre-incubated with 400 mM sorbitol to reduce their turgor pressure, they are not infected by PBCV-1 (Hampe and Thiel unpublished results). (2) Electron micrographs of infected Chlorella NC64A indicate that host cells are often slightly plasmolyzed, i.e., there is a retraction of the plasma membrane from the walls (Figure 3). However, the membrane is always attached to the wall at the point of virus entry. These images indicate that the host plasma membrane is in intimate contact with the virus.
Additional evidence for membrane fusion is also circumstantial. PBCV-1 codes for a K+ channel protein, named Kcv (Plugge et al. 2000). Similar, but not identical, K+ channel proteins are also coded by related Chlorella viruses (Balss et al. 2008; Gazzarrini et al. 2009; Kang et al. 2004b; Gazzarrini et al. 2006), which suggest that the gene product is important for viral replication. In the case of PBCV-1, the channel protein is synthesized as a late gene in the host (Kang et al. 2004a); late virus proteins are often packaged in nascent viruses. We have suggested that the viral channel is present in the virus internal membrane (Frohns et al. 2006). This suggestion leads to the prediction that fusion of the viral K+ channel containing membrane with the host membrane should result in depolarization of the host plasma membrane potential.
To understand the consequences of fusion of the viral membrane, containing one or more Kcv channels, with the host plasma membrane, a few basic transport properties of the host cell as well as the unitary conductance of the viral K+ channel need to be considered. Single channel conductance of the Kcv channel is known; the Kcv protein has been produced as a recombinant protein and reconstituted into planar lipid bilayers (Pagliuca et al. 2007); furthermore, it was expressed in the plasma membrane of Xenopus oocytes (Abenavoli et al. manuscript submitted for publication). The resulting Kcv single channel activity indicates that it has a very high unitary conductance. Conductance is about 130 pS in a solution of 100 mM K+ (Pagliuca et al. 2007). In contrast, a typical plasma membrane with K+ channels, such as the Arabidopis K+ channel KAT1, has a unitary conductance of 10 pS (Thiel and Wolf 1997).
While the viral K+ channel has very high conductance, the resting conductance of the plasma membrane of freshwater algae, such as Chlorella, is generally low. In the well-studied green alga Chara corallina, the plasma membrane has a resting resistance of about 1 Qm2 (Beilby 1985). This high resistance occurs because most K+ channels in the membrane are closed at rest. The resting resistance of the Chlorella NC64A plasma membrane is unknown, but is probably similar to Chara corallina. Measurements of Chlorella NC64A membrane voltage with fluorescent dyes indicate that increasing external K+ concentration has no detect- able effect on membrane voltage (Frohns et al. 2006). This result is consistent with a low membrane conductance at rest and a high resistance for K+ transport.
To evaluate the result of viral and host cell membrane fusion, it is necessary to look closely at the electrical properties of the host. A plant cell membrane, such as Chlorella, can be represented by a simple equivalent circuit (Figure 4; Thiel and Gradmann 1994). The membrane contains a H+ ATPase and, in parallel, other passive conductances, such as channels and transporters. Each of the transporters has an inherent resistance and a battery voltage. The ATPase with the inherent resistance Rp can power the membrane to a voltage Ep, which can be as negative as −400 mV. The reversal voltages of all the remaining transporters (summarized as RT,) are more positive. For simplicity, we assume that ET is 0 mV. The prevailing membrane voltage (VM) of a plant cell is given by these battery voltages and the relative resistances of the transporters Rp and RT. Because the resistance of pump Rp in plants is much lower than RT, the membrane voltage is highly negative. Note that some freshwater algae have voltages as negative as −350 mV.
Figure 4.

Equivalent circuit of host cell membrane before and after virus infection. The membrane potential (Vm) of the host cell plasma membrane (m) at rest is generated by the parallel arrangement of active and passive transporters (black lines). The active transporter, the proton ATPase, has an inherent resistance Rp and creates a battery voltage Ep (ca. −400 mV). The parallel transporters (channels, carriers etc.) are summarized here with their resistance RT and their equilibrium voltage ET (< 0 mV). Because Rp ≪ RT, Vm is very negative at rest. During infection the electrical properties of the viral particle, which contains the K+ channel with the resistance RK, are connected (gray lines) via a low resistance fusion pore (RF) with the membrane of the host. Because RK ≪ Rp and RT, Vm becomes dominated by EK, i.e., depolarizes
For the aforementioned reasons, fusion of the virus membrane with the host membrane will electrically connect the virus membrane containing the Kcv channel RK with that of the host via a low resistance, the fusion pore RF. If we assume a typical membrane resistance in a fresh water alga of 1 Qm2, we can calculate the overall resistance of a Chlorella cell. These spherical algae have an average diameter of 4 μm, i.e., a surface area of 5 × 10⁻¹¹ m2. Hence, their electrical conductance is 200 pS. This value is well in the range of the unitary conductance of the viral channel. Assuming that the virion carries ≥1 channel proteins Rp and RT become smaller than RK. Consequently, the circuit voltage is dominated by the battery voltage (the Nernst potential, EK) of the viral K+ channel. As a consequence, the host cell membrane potential VM must shift towards EK Because EK is more positive than the plant resting membrane voltage, Kcv incorporation into the Chlorella membrane causes depolarization.
The aforementioned description of the electrical properties of the virus and the host predict that fusion of the two membranes results in depolarization of the host cell membrane. This prediction was tested by measuring the membrane voltage of Chlorella cells during virus infection (Frohns et al. 2006; Neupärtl et al. 2007). Chlorella cells are not suitable for conventional voltage recordings with microelectrodes, because they are small and have rigid cell walls. Therefore, fluorescent dyes were used to monitor changes in the membrane voltage. The data in Figure 1 show that the experimental results agree with the prediction. Less than a minute after infecting Chlorella NC64A with PBCV-1, the dye fluorescence increases and reached half maximum (t1/2) after 5 min p.i. (Figure 1). This increase in fluorescence, which remains for several hours after infection (Frohns et al. 2006), is due to depolarization of the Chlorella membrane. The depolarization immediately follows the formation of the hole in the Chlorella cell wall during infection (Figure 1). These results support the causal relationship between the bulging out of the host cell membrane and fusion with the viral membrane.
Several experimental results support the hypothesis that depolarization is induced by the viral K+ channel. The strongest support comes from the observation that different Chlorella viruses encode K+ channels with different pharmacological properties (Frohns et al. 2006). The PBCV-1 Kcv channel is Cs+ insensitive, while the Kcv channel from virus NY-2A is Cs+ sensitive. Consistent with the hypothesis that depolarization is due to the viral channels, depolarization is inhibited by Cs+ when cells are infected with virus NY-2A. In contrast, Cs+ only has a small effect on the depolarization evoked by virus PBCV-1 (Frohns et al. 2006).
Collectively, these data strongly support the hypothesis that the viral membrane and the host plasma membrane fuse very early during infection.
4 Energetics of DNA Ejection
Let us assume the viral membrane fuses with the host membrane and creates a sizable fusion pore between particle and host, which serves as the conduit for transferring the viral genome into the host. However, this scenario does not provide any energy, which is required for this process because the plant has an internal pressure of about 1 MPa. Hence, the virus has to eject DNA against this huge pressure. To explain this process, it is helpful to understand how bacteriophages solve the problem. Like PBCV-1, many phages have large dsDNA genomes and they have to eject DNA into highly turgerized bacteria cells (Molineux 2006;Grayson and Molineux 2007).
A property that PBCV-1 shares with certain bacteriophages is that they pack a large dsDNA genome into a small geometrically confined capsid. For example, phage λ has a 48.5 kbp dsDNA genome, which in its extended linear form is ~16.5u,m long (Grayson et al. 2007). The entire DNA is packed into a capsid with an internal radius of 27.5 nm (Cordov et al. 2003); these dimensions translate into an ~540-fold linear compression of the DNA molecule. This compression value is similar to all known dsDNA phages, which compress their genome at a density of about 500 mg ml−1 (Molineux 2006). The genomes of Chlorella viruses, which range from 295 to 360 kb (Landstein et al. 1995; Fitzgerald et al. 2007a,b), are packed into capsids with an inner diameter of about 800 Å. Assuming that the capsid is a sphere, we calculate a ratio of genome per volume. This ratio is 0.5 pb nm−3 in the case of phage λ and 0.15 pb nm−3 for PBCV-1. The fact that both numbers are the same order of magnitude and that the PBCV-1 capsid also packages other proteins implies that both viruses have a similar challenge for packing their DNA into a small volume.
Native DNA has a double helical structure with two sugar-phosphate chains on the outside that are joined by complementary base-pairs projecting into the helix-interior. In particular, the large size and the high negative charge of the DNA molecule relative to the surrounding solvent molecules and salt ions makes DNA packaging a challenging process. For this reason, many studies have been performed on DNA packing in phages; however, this process is still not fully understood.
Recent experiments and theoretical investigations indicate that the DNA in the small capsid generates enormous internal pressure in the particles ranging up to5 MPa (Li et al. 2008; Molineux 2006; Grayson and Molineux 2007). This internal pressure inherent in the stored DNA is, at least in some phages, used as a driving force for the rapid ejection of DNA from the virus particle. Recent experiments monitored the ejection of DNA from phage λ in real time. The results indicate that the entire 48.5-kbp genome is expelled in ca.1.5 s without interruption, reaching a speed of 60 kbp s−1 (Grayson et al. 2007). The similarity between DNA packing in phages and the Chlorella viruses suggests that at least some of the energy for ejection of PBCV-1 DNA also derives from the energy inherent in DNA packing.
Even though this pressure driven mechanism of DNA ejection appears plausible, new observations indicate that it only explains part of the story. Though the λ and T5 genomes are indeed fully ejected from their capsids into buffer, the situation is different when looking at ejection into host cells (Molineux 2006). In the in vivo situation, the pressure inside the host cell seems to prevent full ejection of the genome. Hence a push-pull mechanism occurs in some bacteriophages in which the initial part of the genome is pushed into the host by the pressure inherent in the compressed DNA and the remaining portion of the genome is pulled in by proteins inside the host (Molineux 2006). This type of genome transfer has been well studied in phage phi29, where the leading 60% of the DNA is pushed into the host in a pressure dependent manner while the remaining part requires energy to be pulled in (Gonzalez-Huici et al. 2004).
Other experimental studies on phages indicate that the pressure derived from the packing of the DNA is insufficient for transferring the entire genome into the host. Therefore, the internal pressure in the host cell must be reduced to allow complete ejection of the viral genome. Bacteriophages accomplish this by causing host cell membrane depolarization and a concomitant release of K+ salts from the host (Boulanger and Letellier 1992; Labedan and Letellier 1981). The situation is similar to the Chlorella viruses. Chlorella membrane depolarization results in an ~50% loss of K+ from the host in less than 5 min after infection (Figure 1, Neupärtl et al. 2007). The release of K+ probably results from activity of the viral Kcv channel. First, K+ release occurs with the same kinetics as membrane depolarization. Second, viral K+ channel blockers partially reduce K+ release from the host cells (Neupärtl et al. 2007). The activity of the Kcv channel, however, is not sufficient to explain the entire scenario. To generate a driving force for K+ efflux from the host cells, the membrane potential must be depolarized well positive of the K+ equilibrium potential (Neupärtl et al. 2007; Thiel and Gradmann 1994). This situation is only possible, if the initial depolarization activates other channels in the host membrane. This hypothesis is reasonable because many plant cells contain anion channels, which can be activated indirectly via Ca2+ mediated membrane depolarization (Sanders et al. 2002).
5 Virus Infection Rapidly Alters the Physiology of the Host
The infecting virus is on a volume basis ca. 104 times smaller than the host cell. However, still it is able to rapidly commandeer major activities in the host cell. Within 5 min after infection, host DNA begins to be degraded by virus packaged DNA restriction endonucleases; a couple of minutes later, the first viral transcripts are detected in the host cell (Agarkova et al. 2006). About 10 min p.i., the host cells begin to shut down photosynthesis with a t1/2 of about 24 min (Van Etten et al. 1983; Seaton et al. 1995). In the case of a related system with Chlorella Pbi cells and virus CVM-1, inhibition of photosynthesis is preceded by an active alteration of photosytem II (PSII). Due to the rapid expression of a viral gene, probably a de-epoxidase, PSII rapidly losses its efficiency to absorb light energy (Seaton et al. 1996). Because of the rapidity of all these processes, the virus must possess mechanisms that favor the activity of its replication over those of the host. Details on how this take over of the host is achieved are unknown. However, virologists have suggested that the most effective way for a virus to achieve control is to modify one of the “master switches” in the host. Such a master switch could be any cellular process that affects many different metabolic and signaling pathways in the cell. This certainly happens when Chlorella cells are infected by PBCV-1. First, as mentioned above, the membrane voltage of the host collapses early during infection (Frohns et al. 2006). This collapse has consequences for the ionic milieu of the cytoplasm, since it results in a major loss of cations (Neupärtl et al. 2007). Because membrane voltage is the dominant driving force for uptake of many substances, such as sugars and amino acids, depolarization decreases these uptake processes (Agarkova et al. 2008). These changes certainly alter the physiological state of the infected cell. Second, cytoplasmic pH is altered early during infection (Agarkova et al. 2008). Cells generally control their cytoplasmic pH in a narrow range of ~7.5 (Felle 2005). Homeostasis of pH is essential because most enzymes in the cytoplasm are highly pH sensitive and operate over a narrow pH window. Any deviation in pH, therefore, has major consequences for the activity of cellular enzymes. PBCV-1 infection of Chlorella NC64A leads to alkalinization of the cytosolic pH (Figure 1; Agarkova et al. 2008), a reaction, which downregulates the activity of most host enzymes. These are the only physiological effects we are currently aware of. However, one can predict that other cellular control factors might be altered during the early phase of infection, such as the concentration of cytosolic Ca2+. This parameter is also controlled by membrane voltage and generally kept under strict homeostatic control; any deviation from a narrow set point results in a modification of numerous activities in cells (Sanders et al. 2002).
Collectively, these data and considerations lead to a plausible model on the physiological events associated with PBCV-1 infection. The virus induced depolarization and the subsequent modifications of the ionic strength, pH, and potentially Ca2+ are an efficient method for rapidly inhibiting the activity of cellular enzymes because they no longer operate at their optimum conditions. To understand the benefit for the virus, we only have to imagine that the viral proteins operate at a different pH optimum, ionic strength, etc., which resembles that created early during infection. This is a testable hypothesis for future experiments.
Acknowledgments
The authors are grateful for financial support for this research by the Deutsche Forschungsgemeinschaft to GT and the European Drug Initiative on Channels and Transporters (EDICT) project EU FP7 (201924) to A.M. Research in the Van Etten laboratory was supported in part by Public Health Service grant GM32441 from the National Institute of General Medical Sciences and NIH grant P20-RR1565 from the COBRE program of the National Center for Research Resources.
Footnotes
The contact angle α describes the orientation of the membrane plane with respect to the inner lining of the small hole in the cell wall. An angle of 0° means that the plane of the membrane is quasi parallel to the wall; e.g. the membrane reveals an omega shape bulge. If at the other extreme the angle is 90° the membrane is perpendicular to the wall; the membrane remains flat in the plane without any budging out.
References
- Abenavoli A, DiFrancesco M, Schroeder I, Epimashko S, Gazzarrini S, Hansen UP, Thiel G, Moroni A. Fast and slow gating are inherent properties of the K+ channel pore module. J Gen Physiol. doi: 10.1085/jgp.200910266. (Submitted for publication) [DOI] [PMC free article] [PubMed] [Google Scholar]
- Agarkova IV, Dunigan DD, Van Etten JL. Virion-associated restriction endonucleases of chloroviruses. J Virol. 2006;80:8114–8123. doi: 10.1128/JVI.00486-06. [DOI] [PMC free article] [PubMed] [Google Scholar]
- Agarkova I, Dunigan D, Gurnon J, Greiner T, Barres J, Thiel G, Van Etten J. Chlorovirus-mediated membrane depolarization of Chlorella alters secondary active transport of solutes. J Virol. 2008;82:12181–12190. doi: 10.1128/JVI.01687-08. [DOI] [PMC free article] [PubMed] [Google Scholar]
- Balss J, Mehmel M, Baumeister D, Hertel B, Delaroque N, Chatelain FC, Minor DJ, VanEtten JL, Moroni A, Thiel G. Transmembrane domain length of viral K+ channels is a signal for mitochondria targeting. Proc Natl Acad Sci USA. 2008;105:12313–12318. doi: 10.1073/pnas.0805709105. [DOI] [PMC free article] [PubMed] [Google Scholar]
- Beilby MJ. Potassium channels and different states of Chara plasmalemma. J Membr Biol. 1985;89:241–249. [Google Scholar]
- Boulanger P, Letellier L. Ion channels are likely to be involved in the two steps of phage T5 DNA penetration into Escherichia coli cells. J Biol Chem. 1992;267:3168–3172. [PubMed] [Google Scholar]
- Cerritelli ME, Trus BL, Smith CS, Cheng NQ, Conway JF, et al. A second symmetry mismatch at the portal vertex of bacteriophage T7: 8-fold symmetry in the procapsid core. J Mol Biol. 2003;327:1–6. doi: 10.1016/s0022-2836(03)00117-7. [DOI] [PubMed] [Google Scholar]
- Chernomordik LV, Leikina E, Kozlov MM, Frolov VA, Zimmerberg J. Structural intermediates in influenza haemagglutinin-mediated fusion. Mol Membr Biol. 1999;16:33–42. doi: 10.1080/096876899294733. [DOI] [PubMed] [Google Scholar]
- Cherrier MV, Kostyuchenko VA, Xiao C, Bowman VD, Battisti AJ, Yan X, Chipman PR, Baker TS, Van Etten JL, Rossmann MG. An icosahedral algal virus has a complex unique vertex decorated by a spike. Proc Natl Acad Sci USA. 2009 doi: 10.1073/pnas.0904716106. (Epub ahead of print) [DOI] [PMC free article] [PubMed] [Google Scholar]
- Cordov A, Desemo M, Gelbart WM, Ben-Shaul A. Osmotic shock and the strength of viral capside. Biophys J. 2003;85:70–74. doi: 10.1016/S0006-3495(03)74455-5. [DOI] [PMC free article] [PubMed] [Google Scholar]
- Dai J, Sheetz MP, Wan X, Morris CE. Membrane tension in swelling and shrinking molluscan neurons. J Neurosci. 1998;18:6681–6692. doi: 10.1523/JNEUROSCI.18-17-06681.1998. [DOI] [PMC free article] [PubMed] [Google Scholar]
- Dunigan DD, Fitzgerald LA, Van Etten JL. Phycodnaviruses: a peek at genetic diversity. Virus Res. 2006;117:119–132. doi: 10.1016/j.virusres.2006.01.024. [DOI] [PubMed] [Google Scholar]
- Felle HH. pH regulation in anoxia plants. Ann Bot. 2005;96:519–532. doi: 10.1093/aob/mci207. [DOI] [PMC free article] [PubMed] [Google Scholar]
- Fitzgerald LA, Graves MV, Li X, Pfitzner AJ, Hoffart E, VanEtten JL. Sequence and annotation of the 288-kb ATCV-1 virus that infects an endosymbiotic Chlorella strain of the heliozoon Acanthocystis turfacea. Virology. 2007a;362:350–361. doi: 10.1016/j.virol.2006.12.028. [DOI] [PMC free article] [PubMed] [Google Scholar]
- Fitzgerald LA, Graves MV, Li X, Feldblyum T, Nierman WC, Van Etten JL. Sequence and annotation of the 369-kb NY-2A and the 345-kb AR158 viruses that infect Chlorella NC64A. Virology. 2007b;358:472–84. doi: 10.1016/j.virol.2006.08.033. [DOI] [PMC free article] [PubMed] [Google Scholar]
- Frohns F, Käsmann A, Kramer D, Schafer B, Mehmel M, Kang M, Van Etten JL, Gazzarrini S, Moroni A, Thiel G. Potassium ion channels of Chlorella viruses cause rapid depolarization of host cell during infection. J Virol. 2006;80:2437–2444. doi: 10.1128/JVI.80.5.2437-2444.2006. [DOI] [PMC free article] [PubMed] [Google Scholar]
- Gazzarrini S, Kang M, Empimashko S, Van Etten JL, Dainty J, Koroni A. Chlorella viru MT325 encodes wate and potassium channels that interact synergistically. Proc Natl Acad Sci USA. 2006;103:5355–5360. doi: 10.1073/pnas.0600848103. [DOI] [PMC free article] [PubMed] [Google Scholar]
- Gazzarrini S, Kang M, Abenavoli A, Romani G, Olivari C, Gaslini D, Ferrara G, Van Etten JL, Kreim M, Kast SM, Thiel G, Moroni A. Eighty-two amino acids are sufficient for making a potassium selective channel. Biochemical Journal. 2009 doi: 10.1042/BJ20090095. (Epub ahead of print) [DOI] [PMC free article] [PubMed] [Google Scholar]
- Gonzalez-Huici V, Salas M, Hermoso JM. The push-pull mechanisms of bacteriophyge phi.29 DNA injection. Mol Microbiol. 2004;52:529–540. doi: 10.1111/j.1365-2958.2004.03993.x. [DOI] [PubMed] [Google Scholar]
- Grayson P, Molineux IJ. Is phage DNA injected into cells- biologists and physicists can agree. Curr Opin Microbiol. 2007;10:401–409. doi: 10.1016/j.mib.2007.04.004. [DOI] [PMC free article] [PubMed] [Google Scholar]
- Grayson P, Han L, Winther T, Philips R. Real-time observations of single bacteriophage λ DNA ejections in vitro. Proc Natl Acad Sci USA. 2007;104:14652–14657. doi: 10.1073/pnas.0703274104. [DOI] [PMC free article] [PubMed] [Google Scholar]
- Harrison SC. Viral membrane fusion. Nat Struct Mol Biol. 2008;15:690–698. doi: 10.1038/nsmb.1456. [DOI] [PMC free article] [PubMed] [Google Scholar]
- Jahn R, Scheller RH. SNARE-engines for membrane fusion. Nat Rev Mol Cell Biol. 2006;7:631–643. doi: 10.1038/nrm2002. [DOI] [PubMed] [Google Scholar]
- Kang M, Graves M, Mehmel M, Moroni A, Gazzarrini S, Thiel G, Gurnon J, Van Etten JL. Genetic diversity in Chlorella viruses flanking kcv, a gene that encodes a potassium ion channel protein. Virology. 2004a;326:150–159. doi: 10.1016/j.virol.2004.05.023. [DOI] [PubMed] [Google Scholar]
- Kang M, Moroni A, Gazzarrini S, DiFrancesco D, Thiel G, Severino M, Van Etten JL. Small potassium ion channel protein encoded by Chlorella viruses. Proc Natl Acad Sci USA. 2004b;101:5318–5324. doi: 10.1073/pnas.0307824100. [DOI] [PMC free article] [PubMed] [Google Scholar]
- Kawasaki T, Tanaka M, Fujie M, Usami S, Yamada T. Immediate early genes expressed in Chlorovirus infection. Virology. 2004;318:214–223. doi: 10.1016/j.virol.2003.09.015. [DOI] [PubMed] [Google Scholar]
- Kim Y, Ye Q, Reinhardt H, Steudle E. Further quantification of the role of internal unstirred layers during the measurements of transport coefficients in giant internodes of Chara by a new stop-flow technique. J Exp Bot. 2006;57:4133–4144. doi: 10.1093/jxb/erl190. [DOI] [PubMed] [Google Scholar]
- Kuznetsov YG, Gurnon JR, Van Etten JL, McPherson A. Atomic force microscopy investigation of a Chlorella virus, PBCV-L. J Struct Biol. 2005;149:256–263. doi: 10.1016/j.jsb.2004.10.007. [DOI] [PubMed] [Google Scholar]
- Labedan B, Letellier L. Membrane potential changes during the first step of coliphage infection. Proc Natl Acad Sci USA. 1981;78:215–219. doi: 10.1073/pnas.78.1.215. [DOI] [PMC free article] [PubMed] [Google Scholar]
- Landstein D, Burbank DE, Nietfeldt JW, Van Etten JL. Large deletions in antigenic variants of the Chlorella virus PBCV-1. Virology. 1995;214:413–420. doi: 10.1006/viro.1995.0051. [DOI] [PubMed] [Google Scholar]
- Lebedev AA, Krause MH, Isidro AL, Vagin AA, Orlova EV, et al. Structural framework for DNA translocation via the viral portal protein. EMBO J. 2007;26:1984–1994. doi: 10.1038/sj.emboj.7601643. [DOI] [PMC free article] [PubMed] [Google Scholar]
- Li Z, Wu J, Wang ZG. Osmotic pressure and packing structure of caged DNA. Biophys J. 2008;94:737–746. doi: 10.1529/biophysj.107.112508. [DOI] [PMC free article] [PubMed] [Google Scholar]
- Meints RH, Lee K, Burbank DE, Van Etten JL. Infection of a Chlorella-like alga with the virus PBCV-1: Ultrastructural studies. Virology. 1984;138:341–346. doi: 10.1016/0042-6822(84)90358-1. [DOI] [PubMed] [Google Scholar]
- Molineux IJ. Fifty-three years since Hershey and Chase; much ado about pressure but which pressure is it? Virology. 2006;344:221–229. doi: 10.1016/j.virol.2005.09.014. [DOI] [PubMed] [Google Scholar]
- Morris CE, Homann U. Cell surface regulation and membrane tension. J Membr Biol. 2001;179:79–102. doi: 10.1007/s002320010040. [DOI] [PubMed] [Google Scholar]
- Neupärtl M, Meyer C, Woll I, Frohns F, Kang M, Van Etten JL, Kramer D, Hertel B, Moroni A, Thiel G. Chlorella viruses evoke a rapid release of K+ from host cells during early phase of infection. Virology. 2007;372:340–348. doi: 10.1016/j.virol.2007.10.024. [DOI] [PubMed] [Google Scholar]
- Onimatsu H, Suganuma K, Uenoyama S, Yamada T. C-terminal repetitive motifs in Vpl30 present at the unique vertex of the Chlorovirus capsid are essential for binding to the host Chlorella cell wall. Virology. 2006;353:432–442. doi: 10.1016/j.virol.2006.06.010. [DOI] [PubMed] [Google Scholar]
- Pagliuca C, Goetze TA, Wagner R, Thiel G, Moroni A, Parcej D. Molecular properties of Kcv, a viral-encoded K+ channel. Biochemistry. 2007;46:1079–1090. doi: 10.1021/bi061530w. [DOI] [PubMed] [Google Scholar]
- Plugge B, Gazzarrini S, Cerana R, Van Etten JL, Nelson M, DiFrancesco D, Moroni A, Thiel G. A potassium ion channel protein encoded by Chlorella virus PBCV-1. Science. 2000;287:1641–1644. doi: 10.1126/science.287.5458.1641. [DOI] [PubMed] [Google Scholar]
- Sanders D, Pelloux J, Brownlee C, Harper JF. Calcium at the crossroads of signaling. Plant Cell. 2002;14:401–417. doi: 10.1105/tpc.002899. [DOI] [PMC free article] [PubMed] [Google Scholar]
- Schuster AM, Girton L, Burbank DE, Van Etten JL. Infection of a Chlorella-like alga with the virus PBCV-1: transcriptional studies. Virology. 1986;148:181–189. doi: 10.1016/0042-6822(86)90413-7. [DOI] [PubMed] [Google Scholar]
- Seaton GR, Lee K, Rohozinski J. Photosynthetic shutdown in Chlorells NC64A associated with the infection cycle of Paramecium bursaria Chlorella virus-1. Plant Physiol. 1995;108:1431–1438. doi: 10.1104/pp.108.4.1431. [DOI] [PMC free article] [PubMed] [Google Scholar]
- Seaton GR, Hurry VM, Rohozinski J. Novel amplification of non-photochemical chlorophyll fluorescence quenching following viral infection in Chlorells. FEBS Lett. 1996;389:319–323. doi: 10.1016/0014-5793(96)00615-1. [DOI] [PubMed] [Google Scholar]
- Shillcock JC, Lipowsky R. Tension-induced fusion of bilayer membranes and vesicles. Nat Mater. 2008;4:225–228. doi: 10.1038/nmat1333. [DOI] [PubMed] [Google Scholar]
- Thiel G, Gradmann D. Electrophysiology of stomata. Prog Bot. 1994;55:59–78. [Google Scholar]
- Thiel G, Wolf A. Operation of K+-channels in stomatal movement. Trends Plant Sci. 1997;2:339–345. [Google Scholar]
- Thiel G, Sutter J-U, Homann U. Ca+-sensitive and Ca+ insensitive exocytosis in maize coleoptile protoplasts. Pflugers Archive Eur J Physiol. 2000;439:R152–R153. doi: 10.1007/s004240000127. [DOI] [PubMed] [Google Scholar]
- Van Etten JL. Unusual life style of giant Chlorella viruses. Annu Rev Genet. 2003;37:153–195. doi: 10.1146/annurev.genet.37.110801.143915. [DOI] [PubMed] [Google Scholar]
- Van Etten JL, Burbank DE, Xia Y, Meints RH. Growth cycle of a virus, PBCV-1, that infects Chlorella-like, algae. Virology. 1983;126:117–125. doi: 10.1016/0042-6822(83)90466-x. [DOI] [PubMed] [Google Scholar]
- Van Etten JL, Burbank DE, Joshi J, Meints RH. DNA synthesis in a Chlorella-like alga following infection with the virus PBCV-1. Virology. 1984;134:443–49. doi: 10.1016/0042-6822(84)90311-8. [DOI] [PubMed] [Google Scholar]
- Van Etten JL, Lane LC, Meints RH. Viruses and viruslike particles of eukaryotic algae. Microbiol Rev. 1991;55:586–620. doi: 10.1128/mr.55.4.586-620.1991. [DOI] [PMC free article] [PubMed] [Google Scholar]
- Wilson WH, Van Etten JL, Alien MJ. The Phycodnaviridae: the story of how tiny giants rule the world. In: Van Etten J, editor. Lesser known large dsDNA viruses. Springer; Berlin: 2009. pp. 1–42. [DOI] [PMC free article] [PubMed] [Google Scholar]
- Yamada T, Onimatsu H, Van Etten JL. Chlorella viruses. Adv Virus Res. 2006;66:293–336. doi: 10.1016/S0065-3527(06)66006-5. [DOI] [PMC free article] [PubMed] [Google Scholar]
- Zauberman N, Mutsafi Y, Halevy DH, Shimoni E, Klein E, Xiao C, Sun S, Minsky A. Distinct DNA exit and packaging portals in the virus Acanthamoeba polyphaga mimivirus. PLoS Biol. 2008;13:ell4. doi: 10.1371/journal.pbio.0060114. [DOI] [PMC free article] [PubMed] [Google Scholar]