Abstract
We are introducing a system for Electrical Impedance Spectroscopy (EIS) measurements for future use in Neurological Intensive Care Unit (NICU) settings. The system consists mostly of commercially available components and the software was developed in Labview (National Instruments). The system is based on the principle that acute hemorrhagic stroke may produce detectable changes in the impedance spectrum measured on the subject’s scalp due to parenchimal local increases of blood volume. EIS measurements were performed on four healthy control subjects to establish a baseline for a real time stroke detector. Measurements were performed using white noise currents in the 0–50 kHz frequency band using ten shielded electrodes placed on a subject’s scalp, with electrical potentials measured with a large-dynamic range for increased EIS accuracy. EIS measurements yielded highly symmetrical impedance spectra, which was only obtainable using the proposed continuos spectral electrical impedance estimation.
Keywords: Electrical Impedance Spectroscopy, Finite Differences Time Domain, Stroke detection
1. Introduction
Stroke is caused by the occlusion or hemorrhage of blood vessels supplying the brain. It is the third leading cause of death in industrialized countries, and the leading cause of serious long-term disability in the United States of America [1]. Currently, computed tomography (CT) and magnetic resonance imaging (MRI) are the technologies used in the diagnosis of acute stroke. Approximately 10% of patients admitted to the Neurological Intensive Care Unit (NICU) following a stroke have complications such as hemorrhage, with negative consequences for their recovery [2]. Because CT and MRI are bulky diagnostic instruments and cannot be used in continuous brain monitoring, a non-invasive and portable device would have clear clinical applications at the bedside in a NICU. Such a monitor would only need to alert caregivers of an event in progress, so that more accurate imaging (i.e., CT and/or MRI) can be performed to confirm and precisely localize the hemorrhage. Therefore a device for continuous brain-monitoring in the NICU does not need to be capable of detailed anatomical imaging.
Pathophysiological changes, including stroke, are known to alter both the spatial and the spectral distribution of electrical impedance. Specifically, the impedance of a tissue to low-frequency current (e.g., below 20 kHz) is increased after ischemic stroke [3] due to reduced extracellular fluid or cell swelling [4, 5]. In contrast, the impedance of a tissue after hemorrhagic stroke is reduced because the conductivity of blood is about three times greater than that of the surrounding brain tissues [6].
Electrical impedance spectroscopy (EIS) is being studied as a diagnostic tool for the evaluation and characterization of ischemic tissues [3]. EIS has been used in clinical studies of various parts of the human body including lung [7], heart [8], and liver [9], and has been used to detect breast cancer [10], to study neurogenic and myopathic atrophy [11], and to evaluate skeletal muscle ischemia [3]. EIS utilizes alternating current over a range of frequencies to estimate the spectral characteristics of electrical impedance, and has been used to non-invasively characterize the electrical properties of various objects, including biological tissues in vivo [12]. EIS estimates the macroscopic dielectric constants from surface voltage measurements between electrode pairs positioned on the surface of an object in response to the applied probe current, typically using the four-terminal system [13]. There are three different basic types of electrical stimuli used in EIS: (a) step function, (b) sinusoids or digital synchronous demodulation [14] and, (c) white noise. The step function (a) is very simple to generate (i.e., ON/OFF switch) and the ratio v(t)/i(t) is called indicial impedance or time-varying resistance, but the stimulus does not excite all the frequencies with the same power, introducing potential issues of non-uniform sampling in frequency. Sinusoidal stimuli (b) are commonly used to probe material, however these can only probe a single spectrum and sweeping in frequency requires a longer time interval. Sweeping the different frequencies also provides a means of measuring impedance spectra [15]. White random noise (c) is the stimulus used in the proposed EIS system since it allows for very uniform stimulation in frequency. The frequencies considered are mostly in the low frequency range, where spectral changes are related to aqueous electrolyte (i.e., blood or CSF) interaction with solids (i.e., the surrounding tissues). The proposed system is based on current generation, since it has been shown [16] that noise due to spatial variation in applied currents or voltages is lower when currents are applied and voltages are measured than when voltages are applied and currents are measured.
One purpose of this study was to demonstrate the feasibility of EIS measurements on human subjects and provide a baseline, so that future measurements can be made in patients with known brain lesions. Therefore, in this study, initial studies on an agarose phantom of the human head, we performed measurements on four healthy volunteers. In our human study setup, a pair of frontal-occipital electrodes was used to deliver currents below the threshold of perception, and bipolar voltages were measured in frontal-parietal and occipital-parietal locations, both on the left and the right.
2. Methods
2.1. The EIS Recording System
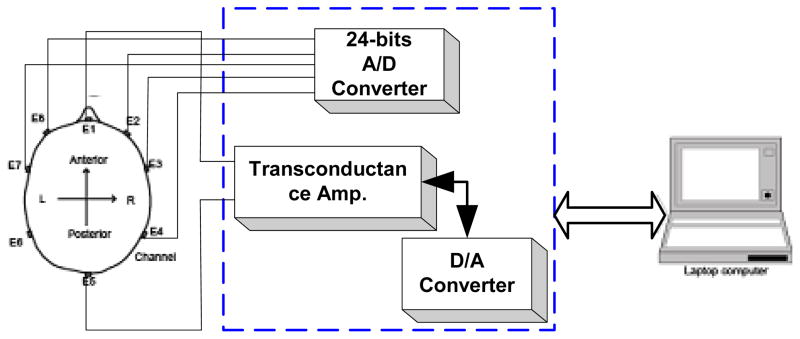
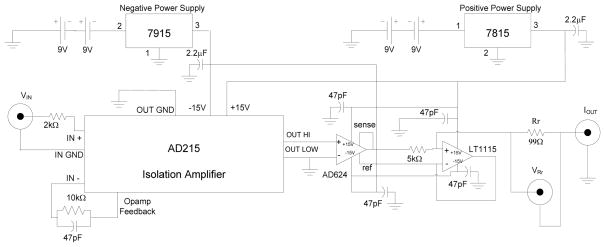
The EIS system (Fig. 1) consisted of a laptop computer (Dell Latitude C840, 750 MHz CPU, 512 MB RAM, and DELL Latitude C/Dock II docking station 4988U)), connected to a 24-bit analog to digital converter (ADC, NI4472, National Instruments Corp, Austin, TX), and a 16-bit digital to analog converter (DAC, NI2052E, National Instruments Corp., Austin, TX) which was connected to a transconductance amplifier (Fig. 2), used to produce white current noise.
Fig. 1.
Diagram of the custom-made EIS system and the electrode positions of the custom made cap for EIS measurements.
Fig. 2.
The circuit diagram of the transconductance amplifier used to deliver white noise probe current.
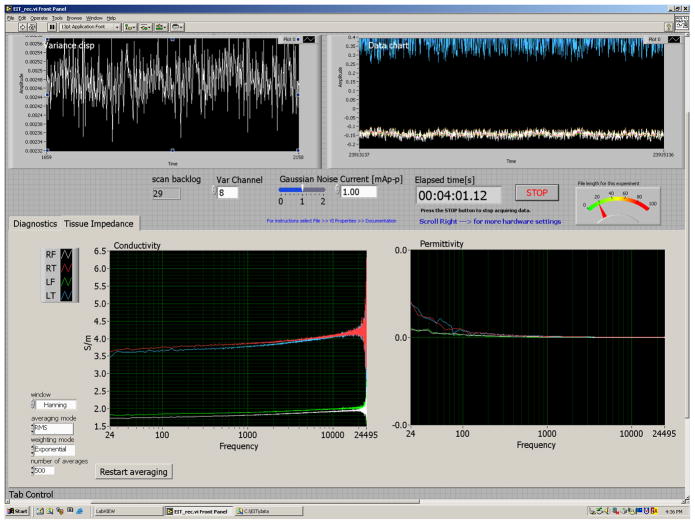
The acquisition software was written in Labview (National Instruments Corp., Austin, TX), and was capable of controlling the white noise current generation and the real-time EIS display. For each electrode pair the program plotted (Fig. 3) the raw traces of the measured voltage, the estimated complex dielectric constants, and the variance. The variance of each channel provided the operator with real-time information about signal artifact potentially due to subject motion, inadequate electrode contact, and low frequency environmental noise.
Fig. 3.
View of the Labview program which offers online: (top left) noise variance, (top right) raw voltage traces, (bottom left) conductivity Vs frequency and (bottom right) permittivity Vs. frequency.
2.2. The EIS estimation
The data were initially acquired as voltage differences between each electrode and the mastoid reference electrode. The data were subsequently transformed into bipolar montage by calculating differences between neighboring electrodes. Slow impedance drift from all electrodes [17] was removed by subtraction with the signal’s trend obtained by convolving the raw data with a second order 10s Kaiser window. The dielectric complex constants were computed using the following deconvolution:
| (6) |
where the tissue impedance was the ratio between the input power spectrum and the input/output cross-spectra computed at the bipolar pair k using the Welch’s method [18] because it provided a smooth spectral estimate. The input data vector was segmented into sections of N = 65,536 samples with 50% overlap, and the data vector from each section was multiplied by an N-point symmetrical Hanning window.
2.3. Calibration Procedures
Calibration was performed by comparison with measurements from a commercial synthesized LCR/ESR meter (Model #885, BK Precision, Yorba Linda, CA) while attached to the CHEMA phantom (see below). Electrodes were placed using the same montage used in our clinical EIS system as shown in Fig. 1. The concentration of NaCl was lowered to reach a DC resistance in each electrode of approximately 1kΩ. The probe currents (2 mAp-p) were applied to the E1 and E5 pair of electrodes. White noise electrical current with amplitudes up to 2.0 mAp-p was applied to electrodes E1 (i.e., frontal) and E5 (i.e., occipital). Calibration was performed at frequencies of 100Hz, 1 kHz, 10 kHz, and 100 kHz. A single scaling factor was determined using a linear least-squares method [19] to fit the spectral impedance curve to the discrete impedance values measured by LCR meter.
2.4. Common-Mode Rejection Ratio (CMRR)
CMRR is a measure of how well the system rejects the common-mode voltage, which indicates the susceptibility of the circuit to external noise. CMRR for entire frequency range was obtained from voltage measurements [13] using:
| (7) |
and displayed in frequency. The CMRR was measured by using the circuit shown in Fig. 4 in a shielded enclosure, shielded by vacuum deposition of aluminum in a acrylonitrile butadiene styrene plastic enclosure.
Fig. 4.
The diagram of the circuit used for CMRR measurements.
2.5. Resolution Measurements
In order to evaluate the resolution of the EIS recordings, digital potentiometers were arranged in an electrical circuit (Fig. 5) to obtain a digital potentiometer with a 20-bit dynamic range. This circuit cascades three 210-position digital potentiometers (AD5235, Analog Devices Inc., Norwood, MA) and a parallel a small (25 Ω) discrete resistor with an overall load of 25 kΩ.
Fig. 5.
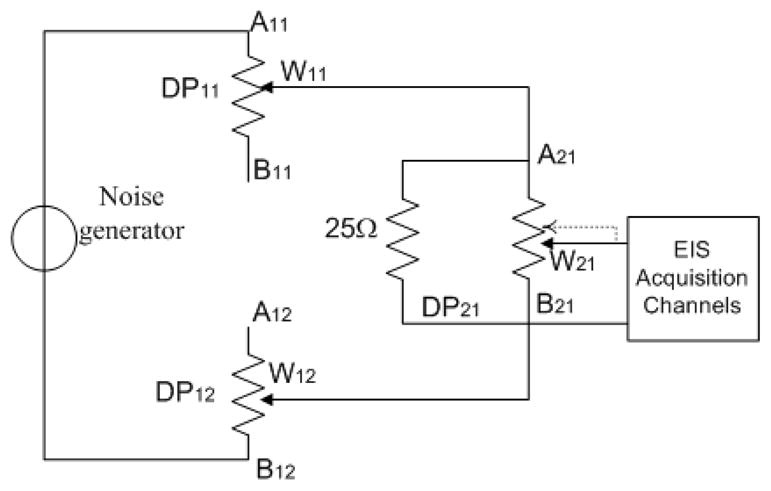
The diagram of the circuit used for the experiments to test the resolution of the impedance measurement.
2.6. Conductive Head Mannequin Anthropomorphic (CHEMA) Phantom Measurements
A model of the head based on T1-weighted MRI data was built with a 3D printer (ZCorp, Boston, MA), and RTV Silicone (GT Products, Grapevine, TX) was poured into the mold to form the head model. The advantage of this technique was that the physical and mathematical head models had matching dimensions [20]. The mold was composed of two symmetrical parts (sagittal cut) that could be perfectly sealed together, and an opening was present at the bottom of the mold for pouring. The poured mixture consisted of 4.4 l ± 5% distilled H20, 157 gr Agarose Type 1A - A0169 (Sigma Aldrich Inc., St. Louis, MO), and 3.2 gr NaCl (purity: 98% Catalog No. 31,016–6 Sigma Aldrich), which gave a conductivity of approximately 0.1 S/m, similar to the conductivity of gray matter at 10 kHz [21]. The relatively high percentage of Agarose (3%) in the final mix created a solid gel that allowed the placement of EEG electrodes/leads directly on the phantom surface (Fig. 6). T1-weighted MRI images with a 3 Tesla Advanto (Siemens, Erlangen, Germany) were obtained to verify and compute the size of a lesion made by carving out the solid agarose from the phantom and filling the resulting space with saline, mimicking a hemorrhagic lesion.
Fig. 6.
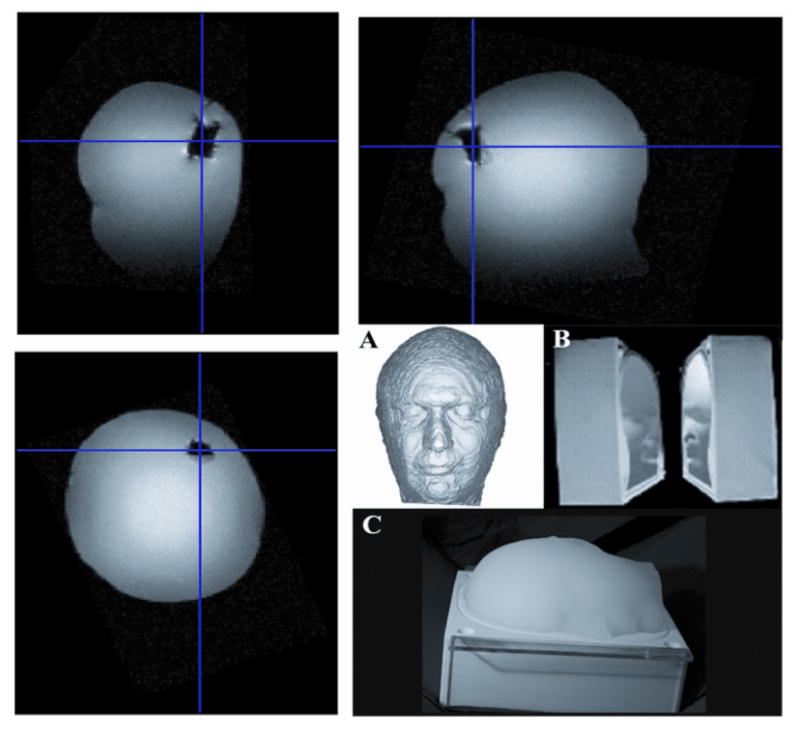
On the top: (A) MRI images of the Conductive Head Mannequin Anthropomorphic (CHEMA) phantom used in this study. (Bottom right) Mold used in phantom construction.
2.7. Human Studies
Four healthy subjects (32 – 41 years of age, three males) volunteered for this study. Written informed consent was obtained in compliance with the human research policies of the institutional review board of the Massachusetts General Hospital and the National Institutes of Health. EIS measurements were performed using white noise currents up to 500 μA in the 0–50 kHz frequency band delivered to two electrodes: a frontal (E1 or Fz according to the international 10–20 EEG system) and an occipital (E5 or Oz) along the midline. All electrode positions in three dimensional space (3D) were digitized using a Polhemus device (Polhemus Inc., Colchester, VT) and projected into the nearest plane using principal component vector projection.
3. Results
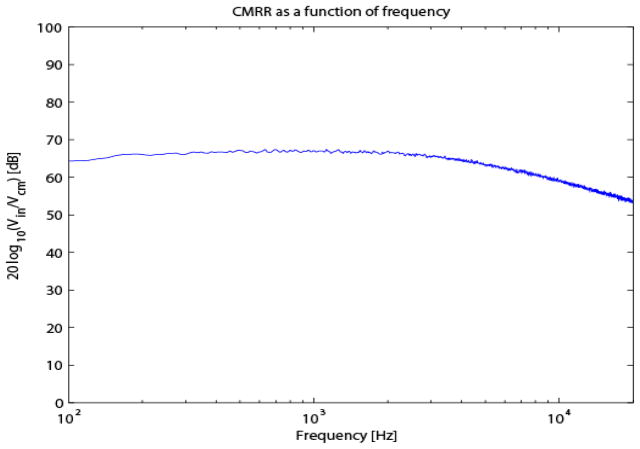
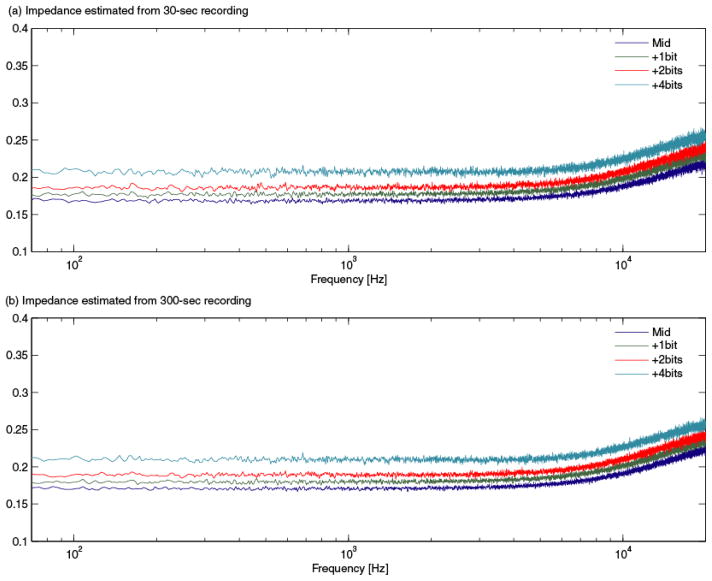
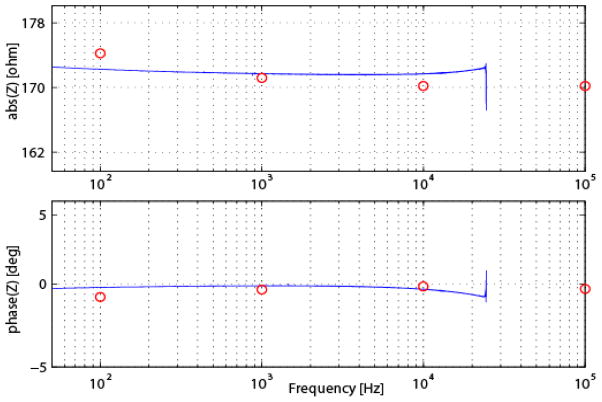
The EIS measurements from the load in Fig. 5 after calibration are shown in Fig. 6. The accuracy, 0.5%, matched that of a commercial LCR/ESR meter. Furthermore, the CMRR for the EIS system decreased as a function of frequency down to the limit of our spectral impedance measurement (Fig. 8). The CMRR obtained here was comparable to that of similar devices [13]. The EIS signals were measured on a digital potentiometer with the DP21 positions (a) at the mid-scale, (b) 1 bit, (c) 2 bits, and (d) 4 bits closer to the A21 terminal. Fig. 9 shows the resolution measurements. Part (a) shows the spectral impedances estimated from first 20 seconds of acquired data and part (b) the spectral impedance estimated from 300 seconds of data. Even in the short (30 seconds) measurements, 20-bits of true dynamic range (i.e., 0.024 Ω) were clearly present.
Fig. 8.
CMRR as a function of frequency.
Fig. 9.
EIS measurements observed by changing the least significant bits of the digital potentiometer.
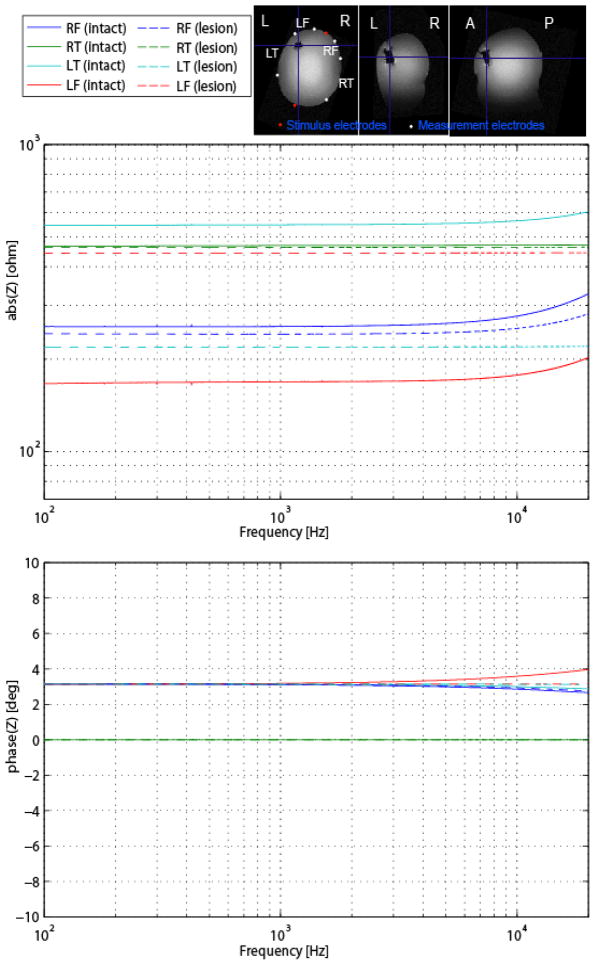
The instrument was then used to assess the presence of cavities filled with saline, as a method of modeling the lesions seen in hemorrhagic stroke. Results of the CHEMA phantom measurements with and without the simulated hemorrhagic lesion are presented in Fig. 10. There were changes in the estimated impedances in the pairs of measurement electrodes ipsilateral to the lesion (left). Specifically, there was an increase of approximately 300Ω in the absolute value of the impedance at the left frontal (LF) electrode pair and a decrease at the left temporal (LT) electrode pair, while there were no significant changes in the contralateral (right) electrodes.
Fig. 10.
On the top: (A) Conductive Head Mannequin Anthropomorphic (CHEMA) phantom used in this study. (B, C) Mold used in phantom construction. (Top) MRI images of the phantom. On the bottom: Results of the spectral impedance measurements with (a) the CHEMA phantom without simulated lesion (solid) and (b) with simulated lesion in left anterior temporal area (dashed).
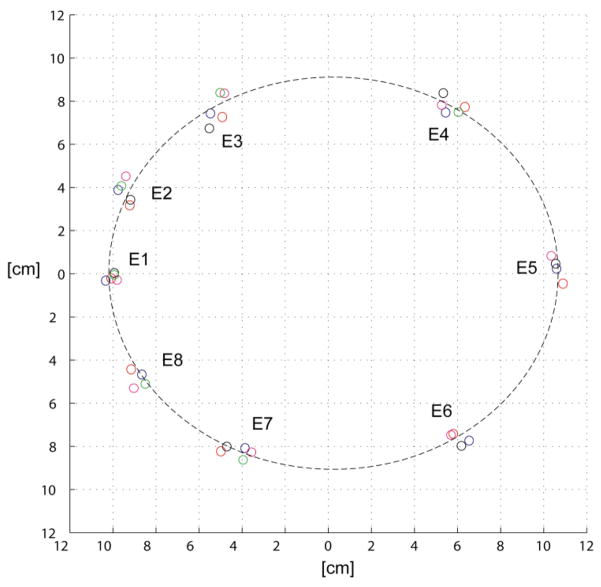
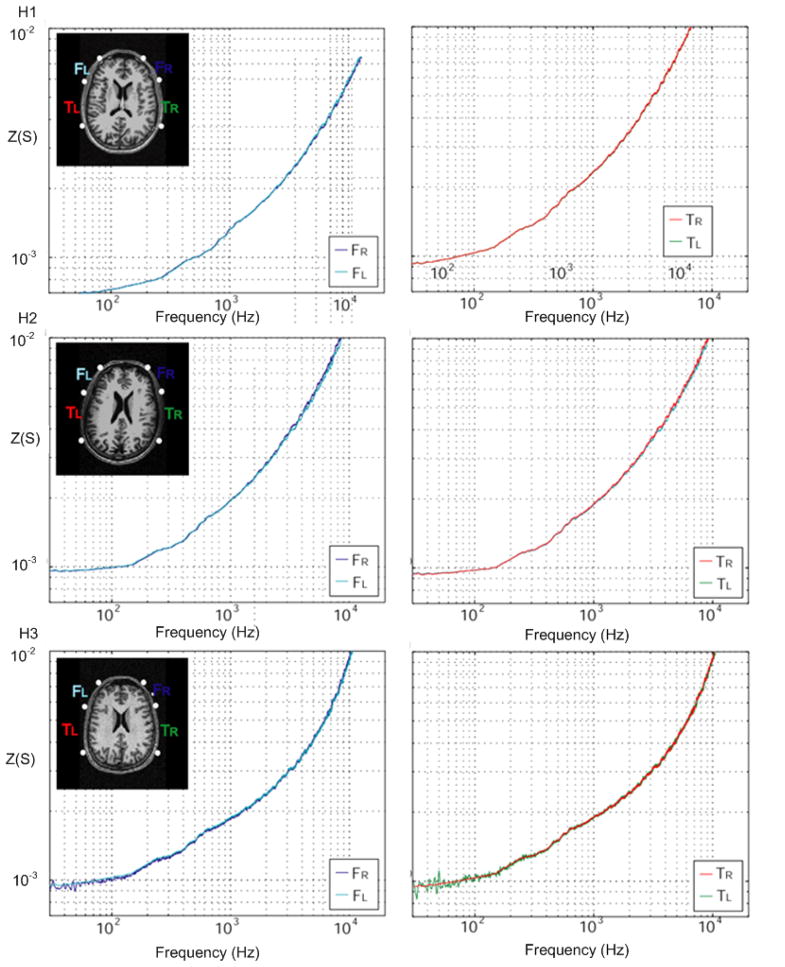
Finally, the EIS system was used to measure impedance spectra on healthy volunteers in order to establish a baseline for future measurements. Electrode positions in three-dimensional space were digitized and were placed systematically in equivalent positions (Fig. 11). Digitized distances of each electrode from the center were: 13.6 ± 1.9 mm, 13.2 ± 2.2 mm, 11.6 ± 2.7 mm, 10.1 ± 3.7 mm, 10.2 ± 4.1 mm, 10.5 ± 4.4 mm, 11.0 ± 3.7 mm, 10.4 ± 2.9 mm, 11.5 ± 3.2 mm, 13.2 ± 3.7 mm. Results of impedances are shown in Table 1 and all subjects’ electrode impedance was lower than our target 3kΩ impedance at DC. At higher frequencies the impedance decreases following the characteristic α-dispersion. Similarly, the estimated frequency distributions of conductivity spectra with the corresponding MR images in Fig. 12 show a similar characteristic α-dispersion and very high symmetry between hemifields in all subjects.
Fig. 11.
Digitization of the electrodes in four subjects projected onto the nearest 2-D plane.
Table 1.
Contact impedance details for each electrode and for various frequencies
| Subject | 100 Hz (kΩ) | 1 kHz (kΩ) | 10 kHz (kΩ) | 100 kHz (kΩ) |
|---|---|---|---|---|
| H1 | 1.53 ± 0.57 | 1.14 ± 0.44 | 0.58 ± 0.17 | 0.33 ± 0.10 |
| H2 | 1.63 ± 0.29 | 1.35 ± 0.23 | 0.68 ± 0.18 | 0.35 ± 0.07 |
| H3 | 2.36 ± 0.68 | 1.56 ± 0.55 | 0.65 ± 0.18 | 0.31 ± 0.05 |
| H4 | 1.43 ± 0.21 | 1.08 ± 0.16 | 0.49 ± 0.10 | 0.26 ± 0.04 |
Fig. 12.
Results of spectral conductivity measurements in Siemens (S) for healthy subjects. The position of the electrodes is superimposed on the MR image of the subject.
4. Discussion
EIS has been applied in other fields to detect the presents of liquids inside solids [15]. In planetary science, EIS has been used for in situ surveys to determine the water content, distribution, and phase in unconsolidated planetary regolith [22]. In oncological research, the different current distribution in liquids and solids has been studied as means of differentiating between normal and malignant tissue inside the human bladder [23]. The frequency response to electric current in polar or ionic liquid depends on a large number of factors, including: type and concentration of ions in solution, geometry, electric field, etc. Impedance shifts due to stroke have been studied with numerical simulations for microwave imaging [24]. We predict that acute stroke will produce asymmetries that were not seen in our healthy volunteers, and we have previously demonstrated asymmetries in chronic stroke patients [25]. Based on this preliminary data, we suggest that this instrument can be built using commercial components and could be used in the NICU to detect hemorrhage in stroke patients in real-time. The instrument could monitor the time constants of a Cole-Cole model [26] specific to each patient and set off an alarm if significant changes occur. The alarm could then prompt the clinical team to investigate the cause of the changes using conventional imaging techniques, such as CT or MRI. There are a large number of confounding factors that could influence the detection sensitivity, such as the electrode size. On one hand, increasing the electrode size improves the 3D reconstruction [27], while on the other it decreases sensitivity. When the electrode height is more than twice that of the target, the sensitivity decreases or remains the same with further increases in electrode height [28]. In this work, we have used standard gold plated electrodes (Grass Technologies, Astro-Med Inc., West Warwick, RI) with a 10mm diameter and a 2mm hole in the center, since these are commonly placed on the patient’s scalp in the NICU.
The use of a current generator with an enhanced Howland circuit [29] results in 19 bits of precision in the presence of a 10 000 + j4000 Ω load at discrete frequencies from 100 Hz to 1 MHz [30]. The enhanced Howland topology current source uses a single operational amplifier with both negative and positive feedback. The textbook [31] transconductance amplifier design offers more stable negative feedback and two operational amplifiers, and allowed us to achieve a better overall precision of 20-bits, though over a much more narrow impedance range (< 3kΩ). Furthermore, limiting the overall contact electrode impedance as we did in the present study is reported to reduce the errors in multiple commercial impedance analyzer systems [32]. Any non-idealities of the current generator, such as poor tuning in the frequencies of interest, are for the most part compensated numerically, since a 24-bit A/D converter also measures the current generated. One of the limitations of the current work is that recordings were performed using a modified quickcap (Neuroscan). Different types of caps have been tested for electrical impedance measurements [33], and have shown that commercial hydrogel elasticized electrode headnet produced the least amount of baseline noise. The other limitation was that a 3kΩ contact impedance limit for each electrode was adopted in our studies; in the future it may be possible to relax this constraint by improving the post-processing [34]. Finally, this paper also introduces a novel method for resolution measurements based on digital potentiometers, which allows for a more systematic and accurate measurement of impedance.
In the healthy human subjects the data show an increase of conductivity of greater than one order of magnitude over three orders of magnitude in frequency span. In all of our subjects, there were only minor differences between the frequency distributions of the EIS signals in both hemispheres Overall the conductivities in frequency are conformal to conductivity data on skin [26]. Finite Element Method (FEM) modeling studies in the human head have shown that predicted current pathways and intensities locally generated by EEG leads have components inside the brain [35]. More recently [36] a 3D adaptive refinement FEM also showed a particularly accurate solution near to the scalp electrodes. Furthermore, electrical impedance tomography (EIT) studies have shown that images of conductivity perturbations, simulating epileptic foci, in a head-shaped saline tank without and with a real human skull were detectable [37]. Delivering currents using an EIS system can be considered safe only if current below the current perception threshold (CPT) level is used, since the patient’s sensory responses could elicit a skeletal muscular reaction, disabling the vital signs monitoring system (e.g., due to disconnection) or even injuring the patient (e.g., due to fall from the stretcher). The CPT for a single sinusoidal stimulation is approximated by an exponential expression, estimated using a large number of studies [38]. This perception function has a minimum I0 of subjective CPT (typically 0.5 mA), plateaus at an intermediate frequency (~ 100 Hz), and increases exponentially for high and low frequencies. Excitable tissues show different CPTs [38] depending on the frequency of the sinusoidal stimulation [39]. In order to avoid current perception, one must carefully design the shape of its spectrum since detection can occur simply when its DC component is greater than the rheobase I0. For example, currents can produce peripheral stimulation if they are not zero-mean and/or when they are abruptly turned ON. In all of our recordings, the steady state currents were not detected by any subject/patient. Our EIS system uses currents with densities estimated to be below the level of 2 mA/cm2, in accordance with the IEC guidelines at all frequencies. In some subjects, CPT occurred because of a sharp OFF/ON current profile, therefore a tapering of the noise amplitude during OFF/ON and ON/OFF periods should be present.
The underlying assumption in this paper is of very high linearity of the skin-electrode interface. Non-linearity of skin impedance may occur because of current dependency, and it may exhibit both rapid and slow variations. The special mechanism of ionic conduction in the keratin layer is indicated as one cause of non-linearity [40].
5. Conclusions
An EIS system was developed to measure the electrical impedance spectrum within the skull cavity by using white noise current delivered at a pair of frontal-occipital shielded electrodes placed on the subject’s scalp. This system was calibrated and tested using CMRR and phantom measurements. Using white noise as the probing current, the spectral impedance was estimated from the EIS data, which enables us to rapidly diagnose possible asymmetries in impedance distribution. The white noise had uniform components over the entire 25kHz of spectrum, which was more robust than the one or two frequency components used more commonly in EIT measurements.
Fig. 7.
Results of the calibration of our EIS system; (a) absolute impedance and (b) phase. Calibration of the system was performed by comparing results using our system (solid blue line) with a network analyzer (red dots).
References
- 1.Lo EH, Dalkara T, Moskowitz MA. Mechanisms, challenges and opportunities in stroke. Nat Rev Neurosci. 2003;4(5):399–415. doi: 10.1038/nrn1106. [DOI] [PubMed] [Google Scholar]
- 2.Furie K, Feldmann E. Treating intracerebral hemorrhage effectively in the ICU. The key steps: provide supportive care and determine the cause. J Crit Illn. 1995;10(11):794–6. 799–800, 803–4. [PubMed] [Google Scholar]
- 3.Kun S, et al. Algorithm for tissue ischemia estimation based on electrical impedance spectroscopy. IEEE Trans Biomed Eng. 2003;50(12):1352–9. doi: 10.1109/TBME.2003.819846. [DOI] [PubMed] [Google Scholar]
- 4.Schaefer M, et al. The complex dielectric spectrum of heart tissue during ischemia. Bioelectrochemistry. 2002;58(2):171–80. doi: 10.1016/s1567-5394(02)00152-4. [DOI] [PubMed] [Google Scholar]
- 5.Seoane F, et al. Bioelectrical Impedance During Hypoxic Cell Swelling: Modelling of Tissue as a Suspension of Cells. 26th Annual Conference IEEE Engineering in Medicine and Biology Society; San Francisco: IEEE; 2004. [Google Scholar]
- 6.Hansen AJ, Olsen CE. Brain extracellular space during spreading depression and ischemia. Acta Physiol Scand. 1980;108(4):355–65. doi: 10.1111/j.1748-1716.1980.tb06544.x. [DOI] [PubMed] [Google Scholar]
- 7.Leathard AD, et al. A comparison of ventilatory and cardiac related changes in EIT images of normal human lungs and of lungs with pulmonary emboli. Physiol Meas. 1994;15(Suppl 2a):A137–46. doi: 10.1088/0967-3334/15/2a/018. [DOI] [PubMed] [Google Scholar]
- 8.Vonk-Noordegraaf A, 2nd, et al. Determination of stroke volume by means of electrical impedance tomography. Physiol Meas. 2000;21(2):285–93. doi: 10.1088/0967-3334/21/2/308. [DOI] [PubMed] [Google Scholar]
- 9.Davalos R, Rubinsky B. Electrical impedance tomography of cell viability in tissue with application to cryosurgery. J Biomech Eng. 2004;126(2):305–9. doi: 10.1115/1.1695577. [DOI] [PubMed] [Google Scholar]
- 10.Cherepenin V, et al. A 3D electrical impedance tomography (EIT) system for breast cancer detection. Physiol Meas. 2001;22(1):9–18. doi: 10.1088/0967-3334/22/1/302. [DOI] [PubMed] [Google Scholar]
- 11.Tarulli AW, et al. Electrical impedance myography in the assessment of disuse atrophy. Arch Phys Med Rehabil. 2009;90(10):1806–10. doi: 10.1016/j.apmr.2009.04.007. [DOI] [PMC free article] [PubMed] [Google Scholar]
- 12.Gabriel C, Gabriel S, Corthout E. The dielectric properties of biological tissues: II. Measurements in the frequency range 10 Hz to 20 GHz. Phys Med Biol. 1996;41:2251–2269. doi: 10.1088/0031-9155/41/11/002. [DOI] [PubMed] [Google Scholar]
- 13.Yerworth RJ, et al. Electrical impedance tomography spectroscopy (EITS) for human head imaging. Physiol Meas. 2003;24(2):477–89. doi: 10.1088/0967-3334/24/2/358. [DOI] [PubMed] [Google Scholar]
- 14.Paterno A, Stiz R, Bertemes-Filho P. Frequency-domain reconstruction of signals in electrical bioimpedance spectroscopy. Med Biol Eng Comput. 2009;47:1093–1102. doi: 10.1007/s11517-009-0533-1. [DOI] [PubMed] [Google Scholar]
- 15.Barsoukov E, Macdonald JR. Impedance spectroscopy : theory, experiment, and applications. 2. xvii. Hoboken, N.J: Wiley-Interscience; 2005. p. 595. [Google Scholar]
- 16.Isaacson D. Distinguishability of conductivities by electric current computed tomography. IEEE Trans Med Imaging. 1986;5(2):91–5. doi: 10.1109/TMI.1986.4307752. [DOI] [PubMed] [Google Scholar]
- 17.Regan D. Human brain electrophysiology: Evoked potentials and evoked magnetic fields in science and medicine. New York: Elsevier; 1989. p. 415. [Google Scholar]
- 18.Welch P. The Use of Fast Fourier Transform for the Estimation of Power Spectra: A Method Based on Time Averaging Over Short, Modified Periodograms. IEEE Trans Audio Electroacoustics. 1967 June;AU-15:70–73. [Google Scholar]
- 19.Paige C, Saunders M. LSQR: An algorithm for sparse linear equations and sparse least squares. CM Trans Math Soft. 1982;8:43–71. [Google Scholar]
- 20.Angelone LM, et al. On the effect of resistive EEG electrodes and leads during 7 Tesla MRI: simulation and temperature measurement studies. Magnetic Resonance Imaging. Magnetic Resonance Imaging. 2006 doi: 10.1016/j.mri.2006.01.006. [DOI] [PubMed] [Google Scholar]
- 21.Gabriel C, Gabriel S, Corthout E. The dielectric properties of biological tissues: I. Literature survey. Phys Med Biol. 1996;41:2231–2249. doi: 10.1088/0031-9155/41/11/001. [DOI] [PubMed] [Google Scholar]
- 22.Seshadri S, et al. sing Electrical Impedance Spectroscopy to Detect Water in Planetary Regoliths. Astrobiology. 2008;8:781–792. doi: 10.1089/ast.2007.0180. [DOI] [PubMed] [Google Scholar]
- 23.Keshtkar A. Modeled current distribution inside the normal and malignant human urothelium using finite element analysis. IEEE Trans Biomed Eng. 2008;55(2 Pt 1):733–8. doi: 10.1109/TBME.2007.905398. [DOI] [PubMed] [Google Scholar]
- 24.Semenov S, Corfield D. Microwave Tomography for Brain Imaging: Feasibility Assessment for Stroke Detection. International Journal of Antennas and Propagation. 2008:1–8. [Google Scholar]
- 25.Bonmassar G, Iwaki S. The Shape of Electrical Impedance Spectroscopy (EIS) is altered in Stroke Patients. Proceedings of the 26th Annual Conference of IEEE/EMBS; 26th Annual Conference of IEEE/EMBS; 2004; San Francisco, CA, USA. [DOI] [PubMed] [Google Scholar]
- 26.Gabriel C, Gabriel S, Corthout E. The dielectric properties of biological tissues: III. Parametric models for the dielectric spectrum of tissues. Phys Med Biol. 1996;41:2271–2293. doi: 10.1088/0031-9155/41/11/003. [DOI] [PubMed] [Google Scholar]
- 27.Demidenko E, et al. On optimal current patterns for electrical impedance tomography. IEEE Trans Biomed Eng. 2005;52(2):238–48. doi: 10.1109/TBME.2004.840506. [DOI] [PubMed] [Google Scholar]
- 28.Newell JC, et al. Effect of electrode size on impedance images of two- and three-dimensional objects. IEEE Trans Biomed Eng. 1998;45(4):531–4. doi: 10.1109/10.664209. [DOI] [PubMed] [Google Scholar]
- 29.Franco S. Design with Operational Amplifiers and Analog Integrated Circuits. 2. New York: McGraw-Hill; 1998. [Google Scholar]
- 30.Ross A, et al. Current source design for electrical impedance tomography. Physiol Meas. 2003;24:509–516. doi: 10.1088/0967-3334/24/2/361. [DOI] [PubMed] [Google Scholar]
- 31.Horowitz P, Hill W. The art of electronics. Cambridge, UK: Cambridge University Press; 1989. [Google Scholar]
- 32.Bogonez-Franco P, et al. Measurement errors in multifrequency bioelectrical impedance analyzers with and without impedance electrode mismatch. Physiol Meas. 2009;30(7):573–87. doi: 10.1088/0967-3334/30/7/004. [DOI] [PubMed] [Google Scholar]
- 33.Tidswell AT, et al. A comparison of headnet electrode arrays for electrical impedance tomography of the human head. Physiol Meas. 2003;24(2):527–44. doi: 10.1088/0967-3334/24/2/363. [DOI] [PubMed] [Google Scholar]
- 34.Boverman G, Isaacson D. Methods for Compensating for Variable Electrode Contact in EIT. IEEE Trans Biomed Eng. 2009 doi: 10.1109/TBME.2009.2027129. [DOI] [PMC free article] [PubMed] [Google Scholar]
- 35.Holdefer RN, Sadleir R, Russell MJ. Predicted current densities in the brain during transcranial electrical stimulation. Clin Neurophysiol. 2006;117(6):1388–97. doi: 10.1016/j.clinph.2006.02.020. [DOI] [PMC free article] [PubMed] [Google Scholar]
- 36.Sawicki B, Okoniewski M. Adaptive Mesh Refinement Techniques for 3D Skin Electrode Modeling. IEEE Trans Biomed Eng. 2009 doi: 10.1109/TBME.2009.2032163. [DOI] [PubMed] [Google Scholar]
- 37.Fabrizi L, et al. A comparison of two EIT systems suitable for imaging impedance changes in epilepsy. Physiol Meas. 2009;30(6):S103–20. doi: 10.1088/0967-3334/30/6/S07. [DOI] [PubMed] [Google Scholar]
- 38.Reilly JP. Applied Bioelectricity : From Electrical Stimulation to Electropathology. Springer Verlag; 1998. p. 632. [Google Scholar]
- 39.Reilly JP. Scales of reaction to electric shock. Ann N Y Acad Sci. 1997:21–37. doi: 10.1111/j.1749-6632.1994.tb30432.x. [DOI] [PubMed] [Google Scholar]
- 40.Yamamoto T, Yamamoto Y. Non-linear electrical properties of skin in the low frequency range. Med Biol Eng Comput. 1981;19(3):302–10. doi: 10.1007/BF02442549. [DOI] [PubMed] [Google Scholar]


